8.0 Examples of crystallization paths for Fo-An-Qz melts
KEY CONCEPTS
- The term phase refers to any compositionally and physically distinctive substance. Phases may be solids, liquids or gases.
- Phase equilibria involve chemical reactions when one or more phases react to form different phases.
- Minerals and mineral assemblages may be at stable, metastable, and unstable equilibrium. Stable equilibrium means chemical energy is at a minimum. Metastable equilibrium means chemical energy is not minimized but no reactions are occurring. Unstable equilibrium means that chemical reactions are occurring.
- The Laws of Thermodynamics govern phase equilibria. Thermodynamics deals with chemical systems, which are defined by the chemical components that make up everything in the system.
- To simplify analysis and broaden applications, petrologists often study model systems involving only one or a few components.
- We depict phase equilibria on phase diagrams. There are many different kinds of phase diagrams.
- Unary systems, contain only one component. We typically depict them on pressure-temperature phase diagrams.
- Binary systems involve two chemical components. We typically show binary equilibria on temperature-composition diagrams.
- Ternary systems involve three components. We generally show ternary equilibria on triangular diagrams.
- Minerals melt over wide range of temperature.
- Some minerals melt congruently – if heated to their melting temperatures they turn into a melt of the same composition as the original mineral. Other minerals melt incongruently – when heated to their melting temperatures they turn into a different mineral and a melt of a different composition.
- Mineral systems often contain eutectics which means that minerals together melt at lower temperature than they would individually.
- Eutectics mean that some magmas may cool to relatively low temperatures before crystallizing.
- Melts may be equilibrium with partially melted rocks that have compositions different from the melt.
- Many important minerals are solid solutions of multiple components, but often only limited ranges of compositions are stable.
8.1 Mineral Melting
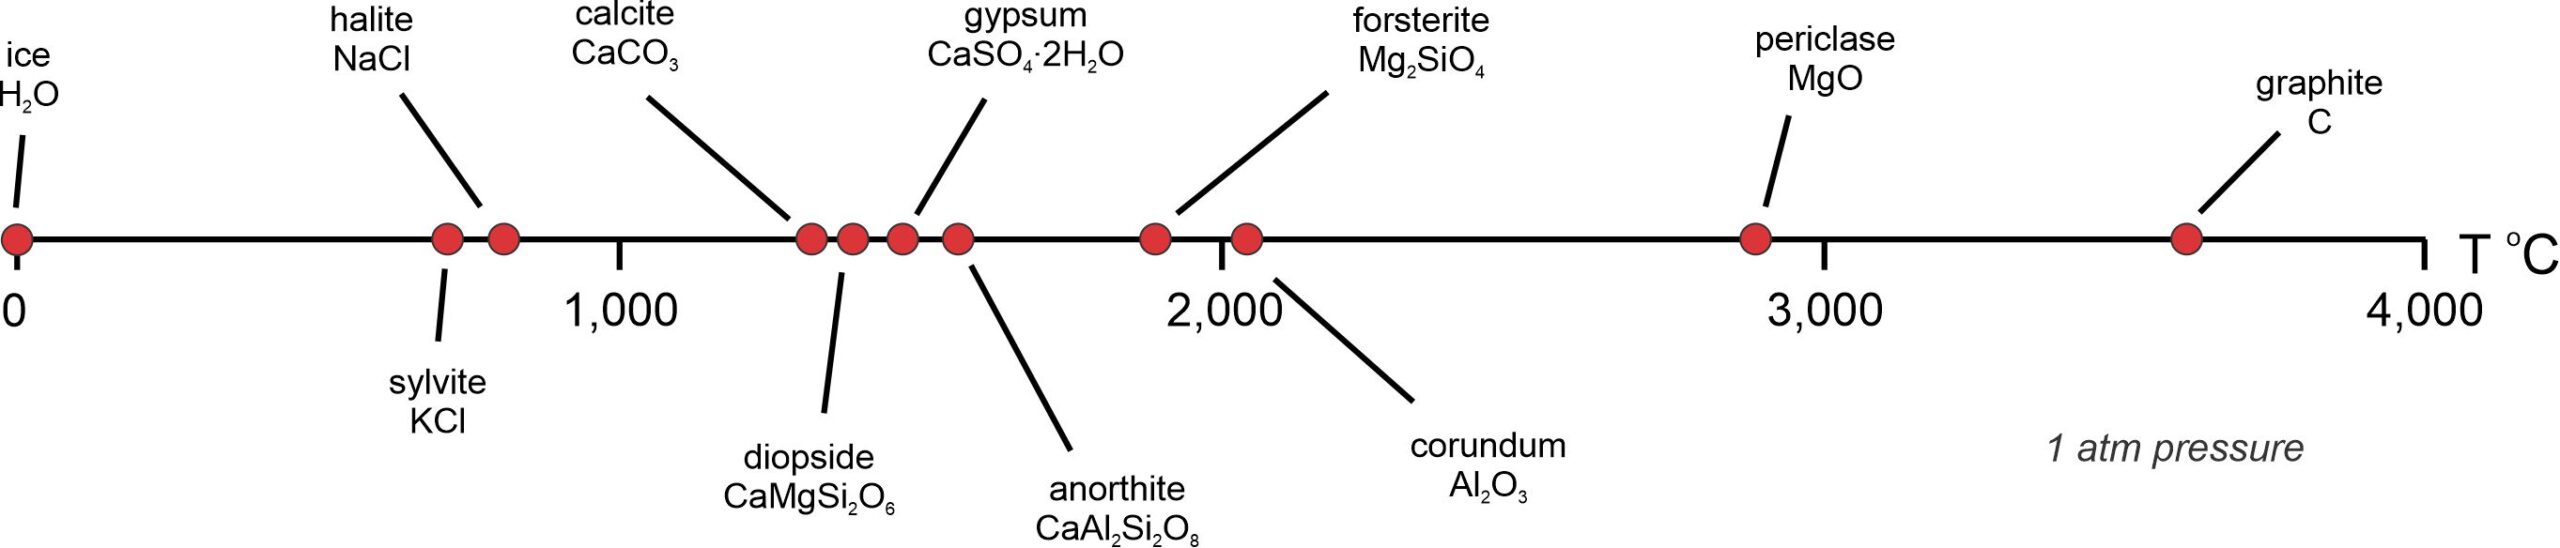
Heat ice and it melts at 0 oC. Some other minerals melt the same way. Heat them to their melting temperatures, sometimes called their melting points, and they turn into liquid with the same composition as the mineral. Figure 8.1 compares melting temperatures for some common minerals. Ice melts at 0 oC, sylvite melts at 790 oC, halite at just more than 800 oC, and the other minerals shown melt at higher temperatures. Periclase, one of the most refractory minerals known, does not melt until temperature reaches almost 3,000 oC. Graphite melts at even higher temperature (around 3,600 oC). There is a huge range!
Heating a mineral causes atomic bonds to begin vibrating. More heating leads to more vibrations, and eventually kinetic energy overcomes the bonds holding atoms together. This is melting. The stronger the bonding in a mineral, the higher the melting temperature. For example graphite contains very strong covalent bonds. It also contains delocalized electrons between carbon atoms that add to bond strength. This explains its very high melting point.
For minerals, the temperature at which melting occurs is singular. Heat a mineral (or any pure solid substance) to its melting temperature and it melts. Above its melting temperature the solid mineral cannot exist. Freezing is the opposite of melting. Cool a mineral melt until it reaches its freezing temperature and crystallization will begin.
But there are complications. For many mineral compositions, melting temperatures and freezing temperatures are identical, but for some minerals they are different. For such minerals, there is a range of temperature over which solid and liquid will coexist. Another complication is that the presence of H2O can greatly lower melting temperatures, a process called flux melting that we talked about in Chapter 3. For example, the melting temperature of albite may decrease by hundreds of degrees if a rock containing albite is saturated with water. For rocks that contain several minerals, a similar phenomenon (called eutectic melting) happens and a rock’s melting temperature may be much lower than the melting temperatures of the individual minerals it contains.
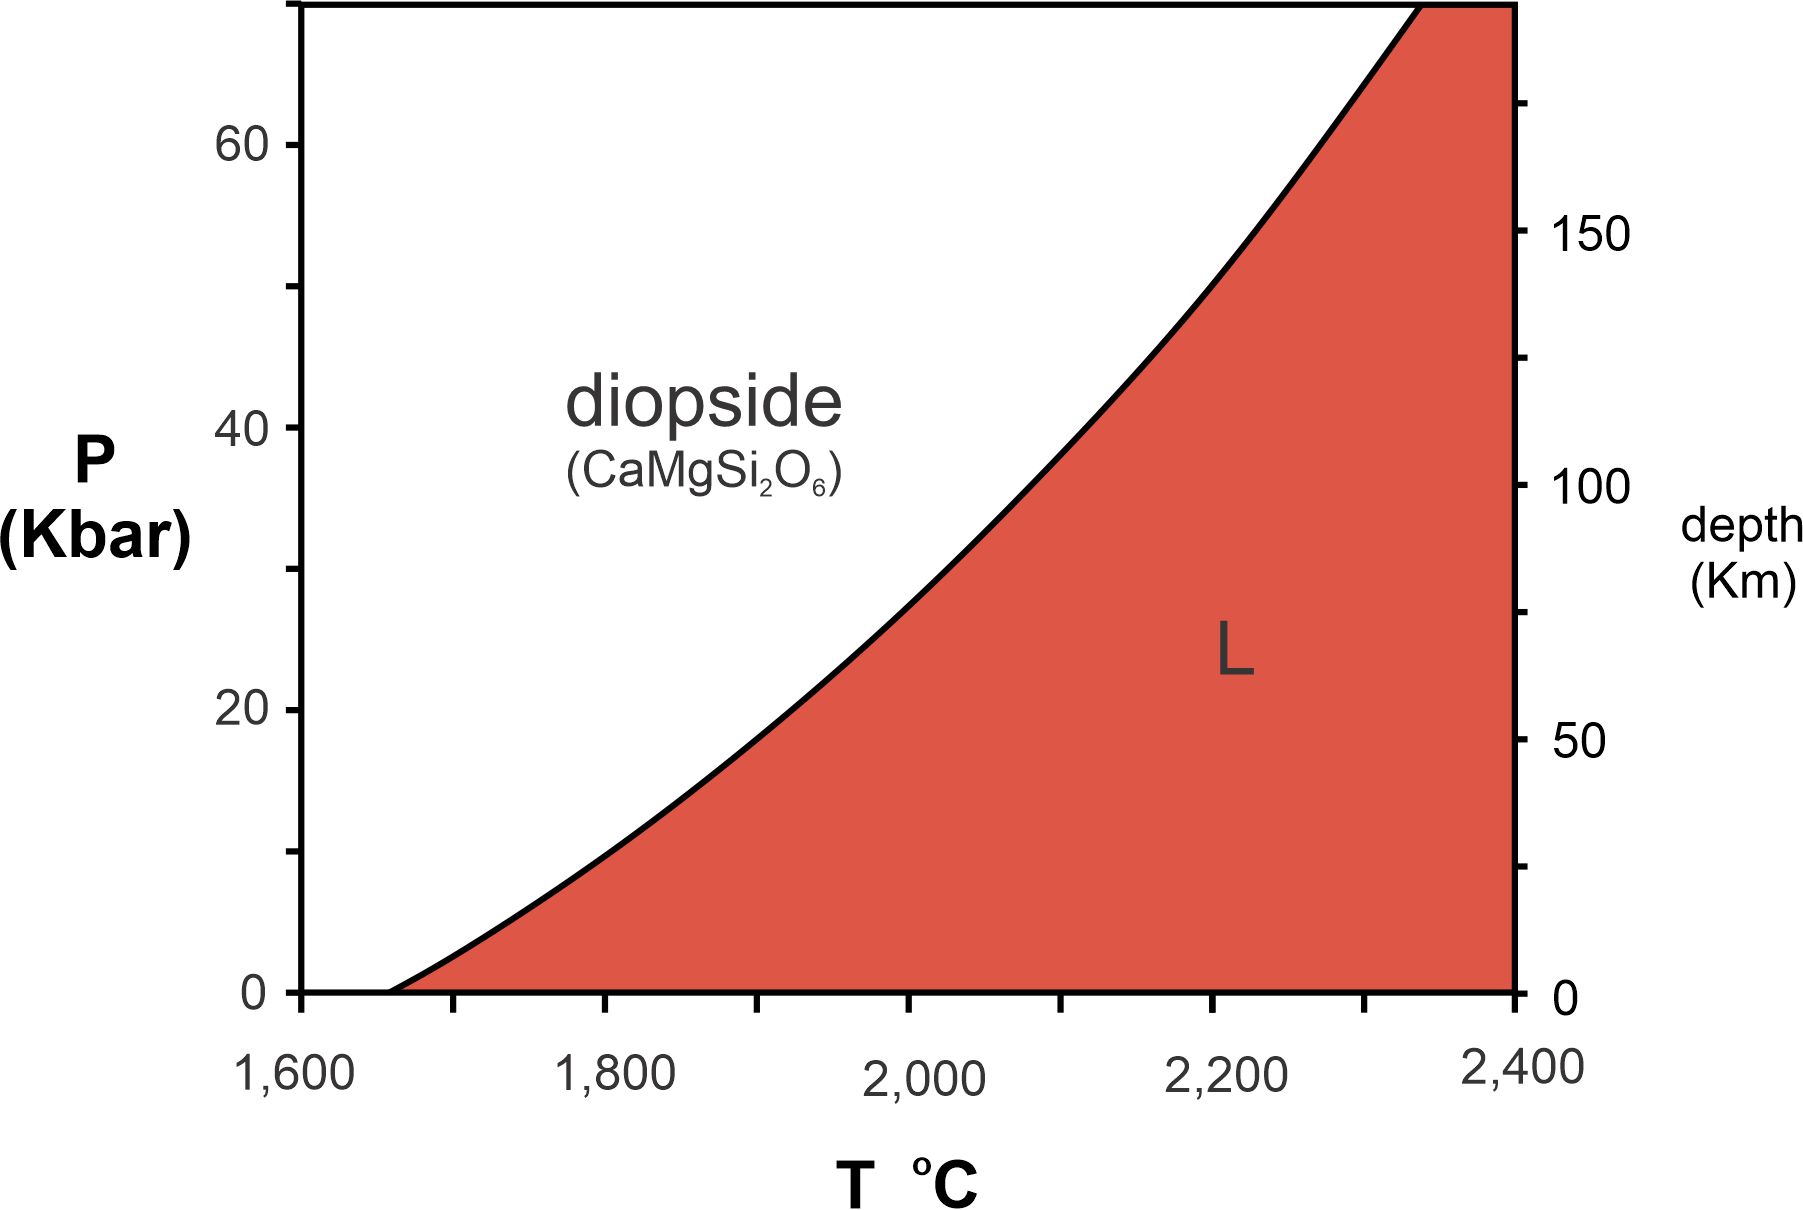
The melting temperatures in Figure 8.1 are for dry (no H2O present) minerals at 1 atmosphere pressure. These melting temperatures, however, vary with pressure and are usually greater if pressure is greater. We use pressure-temperature phase diagrams, commonly called P-T diagrams, to show how melting temperature changes with pressure. Figure 8.2 is a P-T diagram for diopside (CaMgSi2O6), a common mineral in mafic igneous rocks.
For simplicity, we often label the lowest pressure as zero on P-T diagrams. It is, however, implicit that we are not considering zero pressure, a total vacuum, and the lowest pressure, despite the label, is generally 1 atmosphere. Pressure increases about 10 kilobars (kbar) for every 30 kilometers (km) depth in Earth; the right side of Figure 8.2 gives depths corresponding to different pressures. For example, 150 kilometers deep in Earth, the pressure is a bit more than 50 kilobars. So, P-T phase diagrams like this tell us what occurs at great depths within Earth.
At low temperature (in the white field of Figure 8.2), CaMgSi2O6 forms the mineral diopside. At higher temperature (red field), it forms a melt of CaMgSi2O6 composition, labeled L, for liquid, in the figure. At 1 atmosphere, diopside melts at 1,675 oC. But, at higher pressures, the melting point is much greater, increasing to more than 2,200 oC at 150 kilometers depth.
8.2 Phase Equilibria
Although the term is sometimes used in other ways, when talking about minerals and rocks, we use the term phase to refer to any compositionally and physically distinctive substance. Phases must be homogeneous and can be solids, liquids or gases. Thus, minerals are phases, homogeneous obsidian is a phase, water is a phase, and important geological gases such as water vapor, carbon dioxide, oxygen or sulfur dioxide are also phases. Rocks, however, are not phases because they are heterogeneous mixtures of different things.
When a phase of one sort changes into a phase of another sort, a phase change has occurred. For example, when minerals melt, they undergo a phase change from a solid to a liquid phase. And when one mineral turns into another, for instance when calcite turns into aragonite during metamorphism (both minerals have composition CaCO3), a phase change has occurred. Figures 8.1 and 8.2 are examples of diagrams depicting phase equilibria, the relationships between different phases. Figure 8.2, a P-T diagram, is one of the most common of several different kinds of phase diagrams. Figure 8.1, a less common type of diagram, shows the temperatures at which a solid mineral turns into its molten equivalent.
8.2.1 Thermodynamics
The Laws of Thermodynamics govern phase equilibria. Thermodynamics is a hybrid science studied by chemists, physicists, engineers and others. Approaches in the different fields are different, but always the science deals with the relationships between energy and different forms of matter. For mineralogists and petrologists, we use thermodynamics to predict mineral stabilities. For example, thermodynamics tells us that (at 1 atmosphere pressure) ice will melt at 0 oC and that forsterite will melt at 1,890 oC.
Sometimes of more interest, we us thermodynamics to interpret information recorded by mineral assemblages. Thermodynamics tells us, for example, that if we find a rock containing diamond, it formed a very high pressure deep in Earth. Figure 8.3 depicts phase relationships of graphite and diamond. The line separating the diamond and graphite fields is a reaction line, showing the conditions where diamond can react to form graphite.
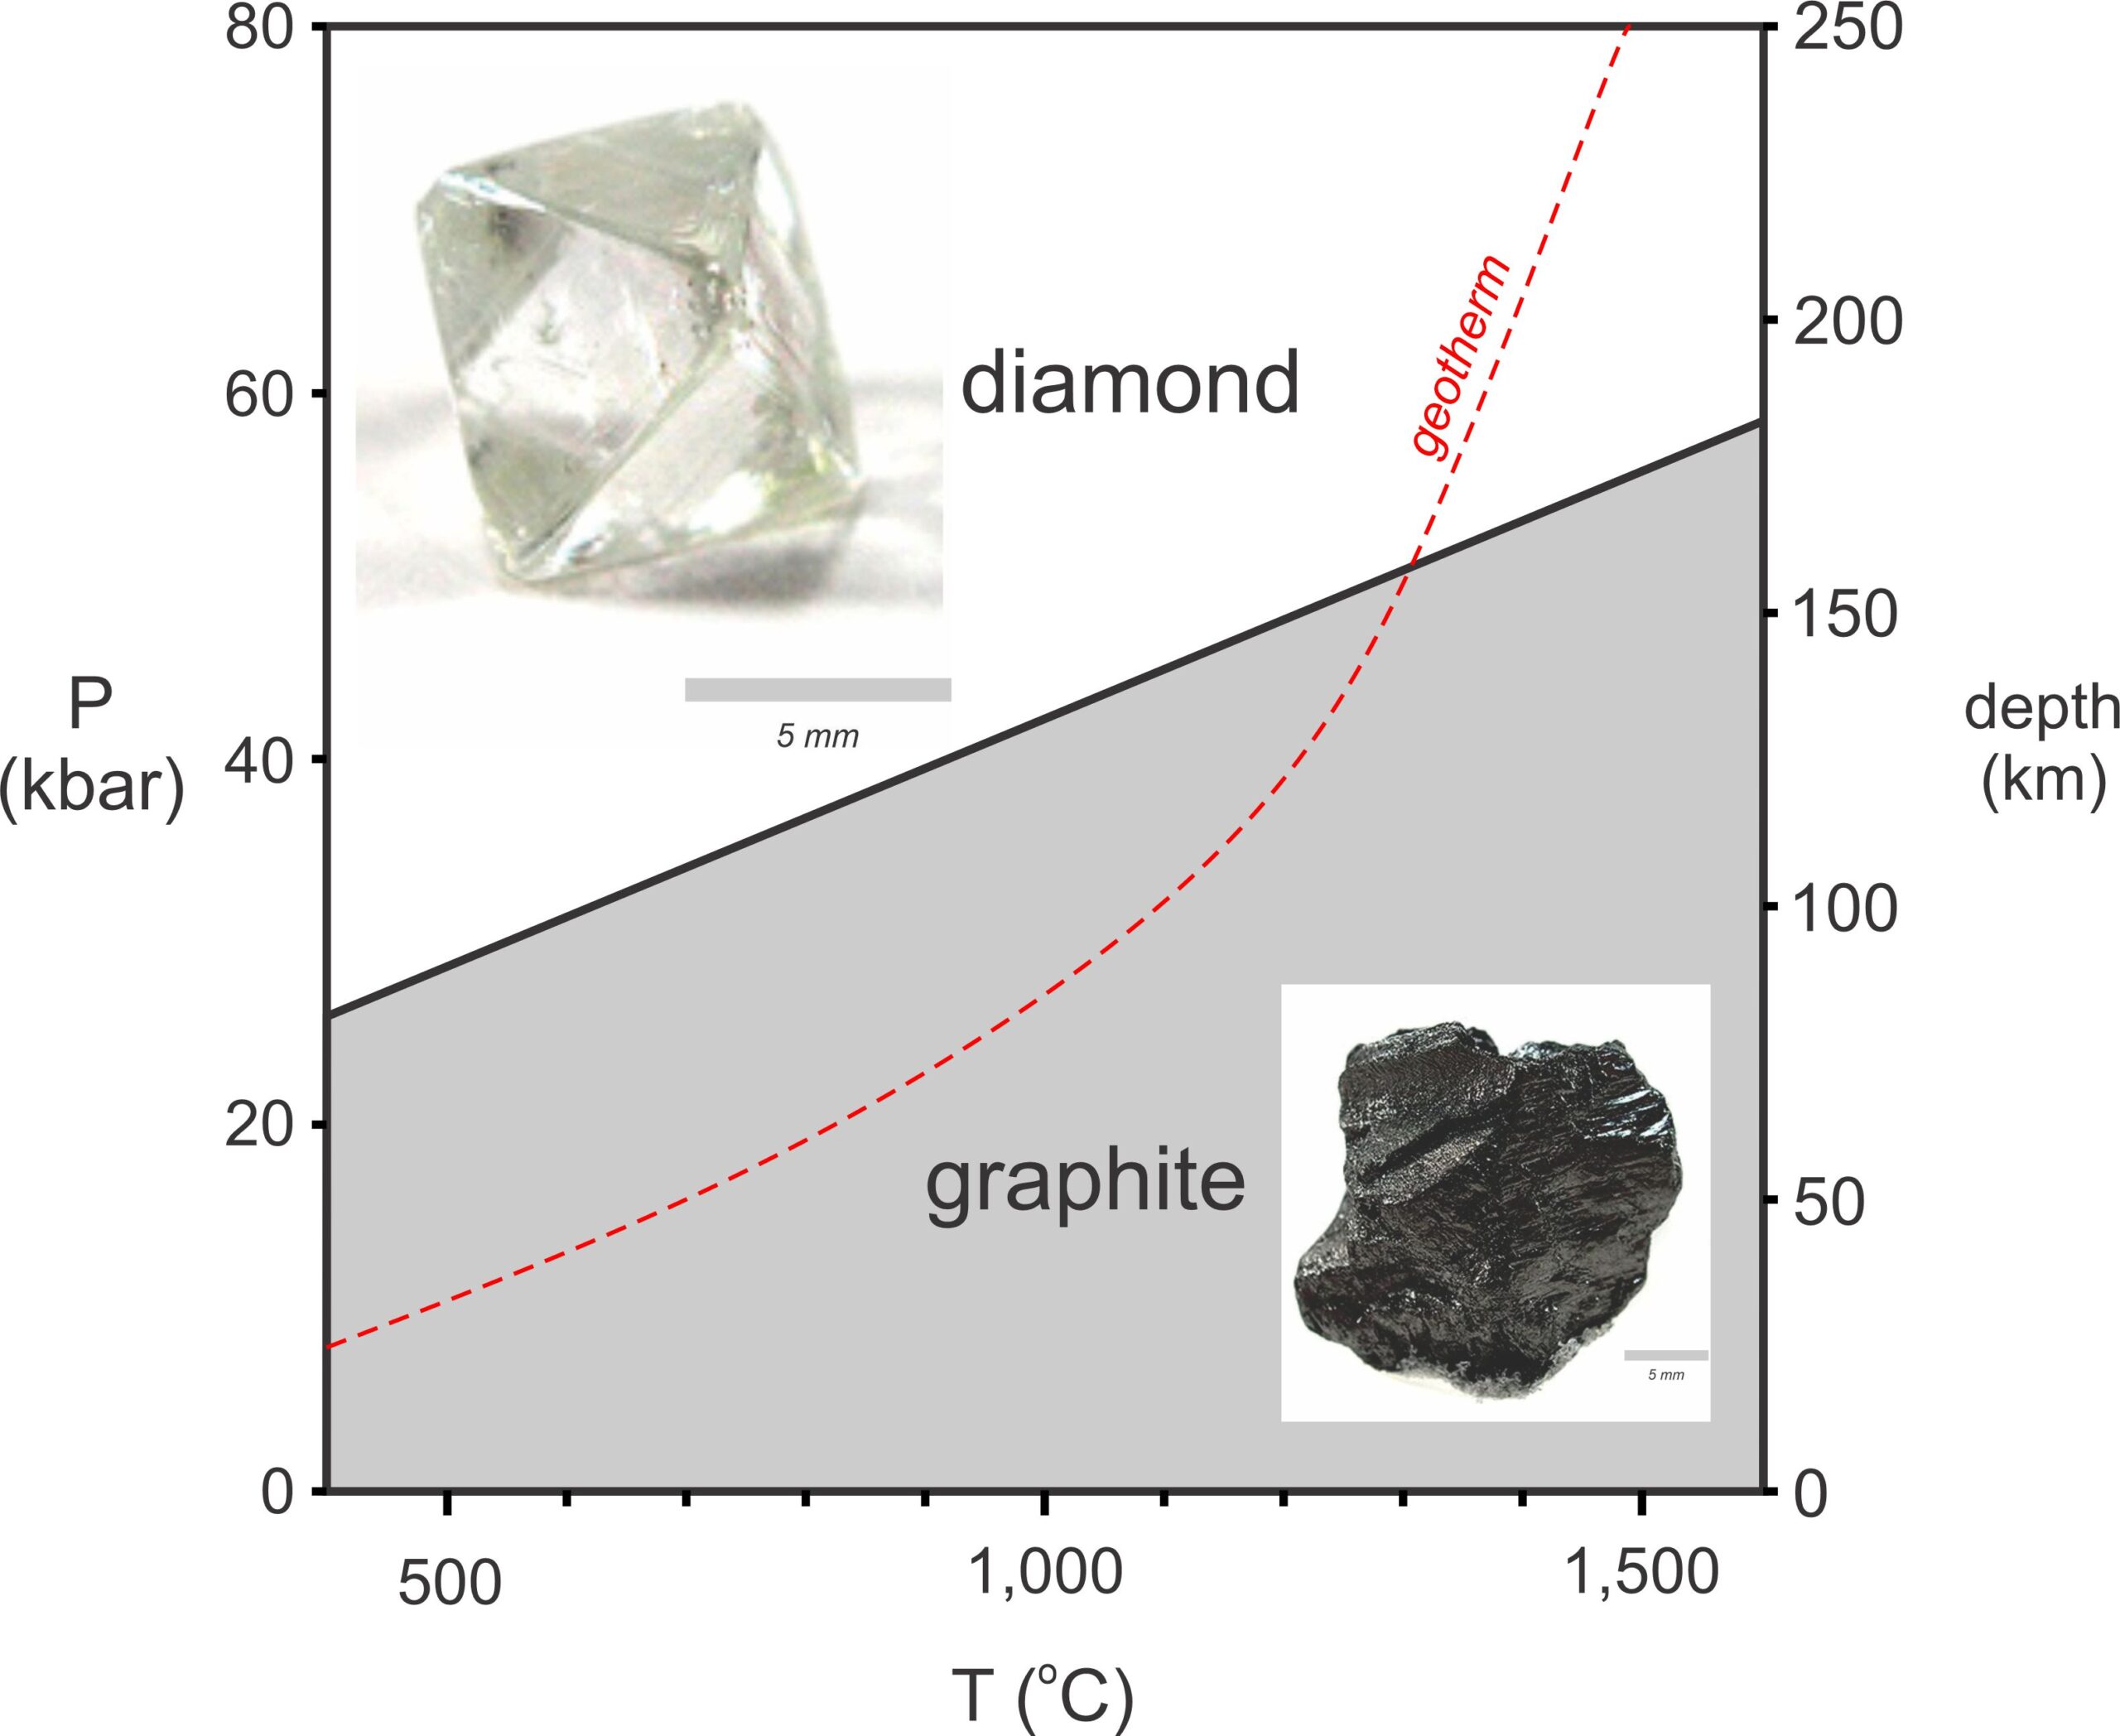
The red dashed line in Figure 8.3 is a geotherm showing temperatures at different depths in Earth. (Geotherm, as we discussed in Chapter 3, is a shortened version of geothermal gradient.) Geotherms are different in different places, but the curve shown is typical. Most diamonds form at depths of 150 kilometers and temperatures of about 1,300 oC, near where the geotherm and the reaction line intersect. Diamond cannot form at shallow depths, no matter what the geotherm or temperature.
8.2.2 Chemical Systems
Thermodynamics deals with chemical systems, and chemical systems are defined by their compositions, that is, by the chemical components that make up everything in the systems. For example, the diagram in Figure 8.2 deals with the CaMgSi2O6 system. The phase diagram in Figure 8.3 deals with the C (carbon) system. These are both 1-component systems – in both examples, every phase being considered consists of the same single chemical component. We will see examples of systems with more than 1 component later in this chapter.
Systems may have different characteristics. Isolated systems are insulated from everything around them. Neither energy nor mass can be transferred in and out of the system. Such systems do not exist in nature but close approximations do exist under laboratory conditions. Think of a very well-insulated thermos with a tight cap and “stuff” inside it. The stuff is largely isolated from anything outside the thermos. No matter or energy moves from inside the thermos to outside, and vice versa.
Most geological systems are closed systems. This means that energy, mostly heat, can pass in and out, but that the composition of the system – perhaps a rock – remains constant. Open systems, a third kind of system, allow both energy and matter to enter and leave. An example might be a lake that is evaporating while absorbing heat from the atmosphere. Thermodynamics and phase diagrams do not easily apply to open systems that can change composition.
8.2.3 Stable, Metastable, and Unstable Equilibrium

If rocks are perched on a hillside, as in Figure 8.4, they will eventually slide or tumble downhill. This happens because gravitational potential energy is less if the rock is at the bottom of the hill than if it is higher up. And nature always tries to minimize energy. When a rock reaches the bottom of the slope, and energy is at its minimum, things are in stable equilibrium. No further change will occur. When a rock is perched up high, but not moving, the rock is at metastable equilibrium – a situation that is temporarily unchanging. And if a rock is sliding downhill, even if very slowly, the rock is unstable. We can expect metastable rocks to become unstable at some time but, for the moment, they are happy where they are. For another general discussion of stable, metastable, and unstable equilibrium, follow this link to Chapter 11.
The example in the previous paragraph was about gravitational energy and equilibrium, and chemical systems (including mineral systems) behave the same way as gravitational systems. The fundamental principle behind chemical thermodynamics is that chemical systems will react in ways that minimize energy and move toward stable equilibrium. This means that if a chemical system is at equilibrium and pressure, temperature, or composition of the system change, chemical reactions will occur until equilibrium is once again obtained. In broader terms, this is a manifestation of Le Chatelier’s Principle that formally states that if a dynamic equilibrium is disturbed by changing the conditions, the position of equilibrium shifts to counteract the change to reestablish an equilibrium.
There are different kinds of energy, but when talking about chemical equilibria we are talking about a type of energy called Gibbs free energy, symbolized ΔG. All phases, whether minerals or not, have a Gibbs free energy value that varies with pressure and temperature. For example, at low temperatures, solid minerals have lower ΔG than molten equivalents. So the minerals are stable. But, at high temperatures, molten minerals have lower ΔG than their solid equivalents, so mineral melts are stable.
A second principle of thermodynamics deals with entropy. Entropy, abbreviated S, is a measure of randomness or disorder that characterize a phase. Solids have relatively low entropy compared with liquids, because relatively inflexible bonds hold atoms in solids together and in place. And gases have greater entropy than liquids because atoms in gases move completely randomly. Atoms in liquids do not. The principle is that phases with higher entropy are stable at higher temperature. It makes sense, in a way, that high temperature favors greater disorder because kinetic energy is greater at higher temperature. This principle explains why solids eventually melt when heated, and melts may vaporize (boil) to become gases with even more heating.
A third fundamental principle of thermodynamics is that phases with greater density are more stable at greater pressure. To put it another way, phases with greater volume (V) are most stable at lower pressure. This too makes sense – that high pressure favors dense and compact materials. For example, diamond (which has the same composition as graphite) forms at high pressures; graphite forms at low pressures. Diamond has density of 3.51 g/cm3 and graphite has density of 2.26 g/cm3.
Gibbs free energies are typically given in units of joules (J) or calories (cal). We express entropies in units of joules per Kelvin (J/K) or calories per Kelvin (cal/K). And we normally express volumes in cubic centimeters (cm3). Gibbs free energy, entropy, and volume values are molar quantities, so their values depend on the amount of material being considered.
Gibbs free energies are relative values, so differences between Gibbs free energies of different phases are important, but absolute values are not. Consider halite and molten NaCl. If halite has a lower Gibbs free energy than molten NaCl, it is more stable than molten NaCl. If molten NaCl has lower Gibbs free energy than halite, it is more stable than halite. The difference between the two ΔG values describes how much more (or less) stable one is compared with the other. If the two have the same energies, they are equally stable. Because ΔG values for both halite and molten NaCl vary with pressure and temperature, under some conditions one is stable and under other conditions the other is stable.
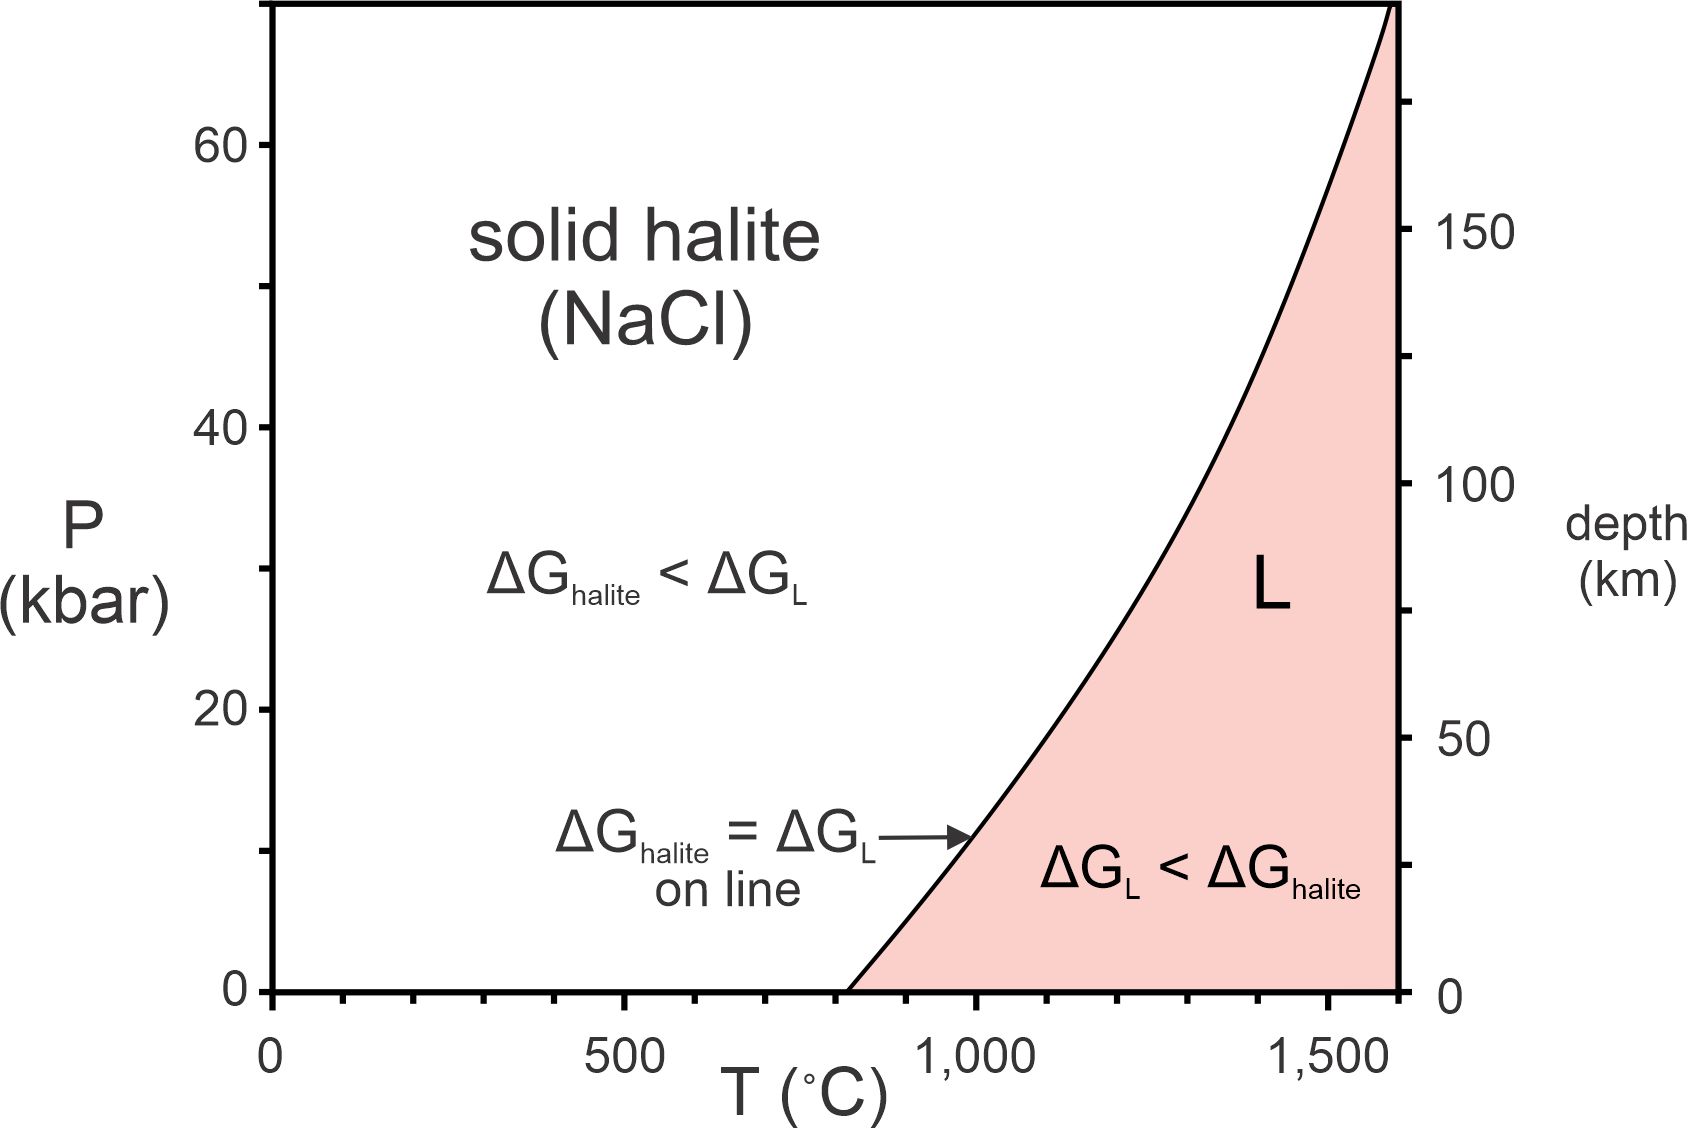
Th phase diagram in Figure 8.5 shows the temperature at which halite melts for different pressures. A reaction curve separates the solid and (red) melt fields; along this curve the solid and molten forms of NaCl have the same Gibbs free energy. To the left of the curve, halite has lower Gibbs free energy than the NaCl melt. To the right of the curve, the melt has lower energy than halite. Halite has greater density than liquid NaCl, and so is stable at higher pressure, no matter what the temperature. Molten NaCl has greater entropy than halite, and so is stable at higher temperature, no matter what the pressure.
8.2.4 Phase Equilibria in Rocks
Single minerals or melts are often relatively simple to analyze – rocks are more complicated. For example, gabbros are generally aggregates of several minerals. The total Gibbs free energy of a rock is the sum of the energies of its constituent parts. If, for instance, a gabbroic rock contains 55 mol% plagioclase, 41 mol% pyroxene, and 4 mol% olivine, its molar Gibbs free energy is
ΔGrock = 0.55 x ΔGplagioclase + 0.41 x ΔGpyroxene + 0.04 x ΔGolivine
However, the ΔG values for plagioclase, pyroxene, and olivine vary with pressure and temperature and with mineral composition. So, things can get complicated in a hurry. In principle, though, given the composition of a rock, we can calculate the stable minerals or melt, that will be present under all conditions, their relative proportions, and their compositions. And, we can use phase diagrams to depict the results of stability calculations.
While thermodynamic calculations can inform us about very complex systems containing many components, the results may be difficult to interpret or may only apply in a few instances. To simplify analysis and broaden applications, petrologists often study model systems containing only a few components. The results still apply to more complex systems. For example, the diopside melting curve in Figure 8.2 applies to diopside even if it is in a rock that contains other minerals. Temperature cannot be greater than the melting curve or diopside will not be stable. Phase diagrams, by necessity, are usually models that involve only a few components. If not, they would be too complex to be useful.
8.2.5 Extensive Variables and Different Kinds of Phase Diagrams
The key variables that affect phase equilibria are pressure (P), temperature (T), and composition (abbreviated X). We call these parameters intensive variables because they contrast with extensive variables, such as Gibbs free energy, entropy, volume, weight, and mass, that depend on the amount of material being considered. In contrast with extensive variables, the intensive variables pressure, temperature, and composition of a rock do not vary with sample size.
Pressure generally corresponds to depth in Earth, temperature generally follows the geotherm, but may be greater if magmatic heat is added, and composition can be anything we wish to consider. We can only use two of these variables for axes of a phase diagram, and the most common phase diagrams are pressure-temperature (P-T) diagrams and temperature-composition (T-X) diagrams. Figure 8.6, below, contains examples of both. For a P-T diagram, we must specify the composition being considered. Often this is implicit from labels in different fields. For a T-X diagram, we must specify pressure. Sometimes this is not done and, if so, we assume pressure is 1 atmosphere.
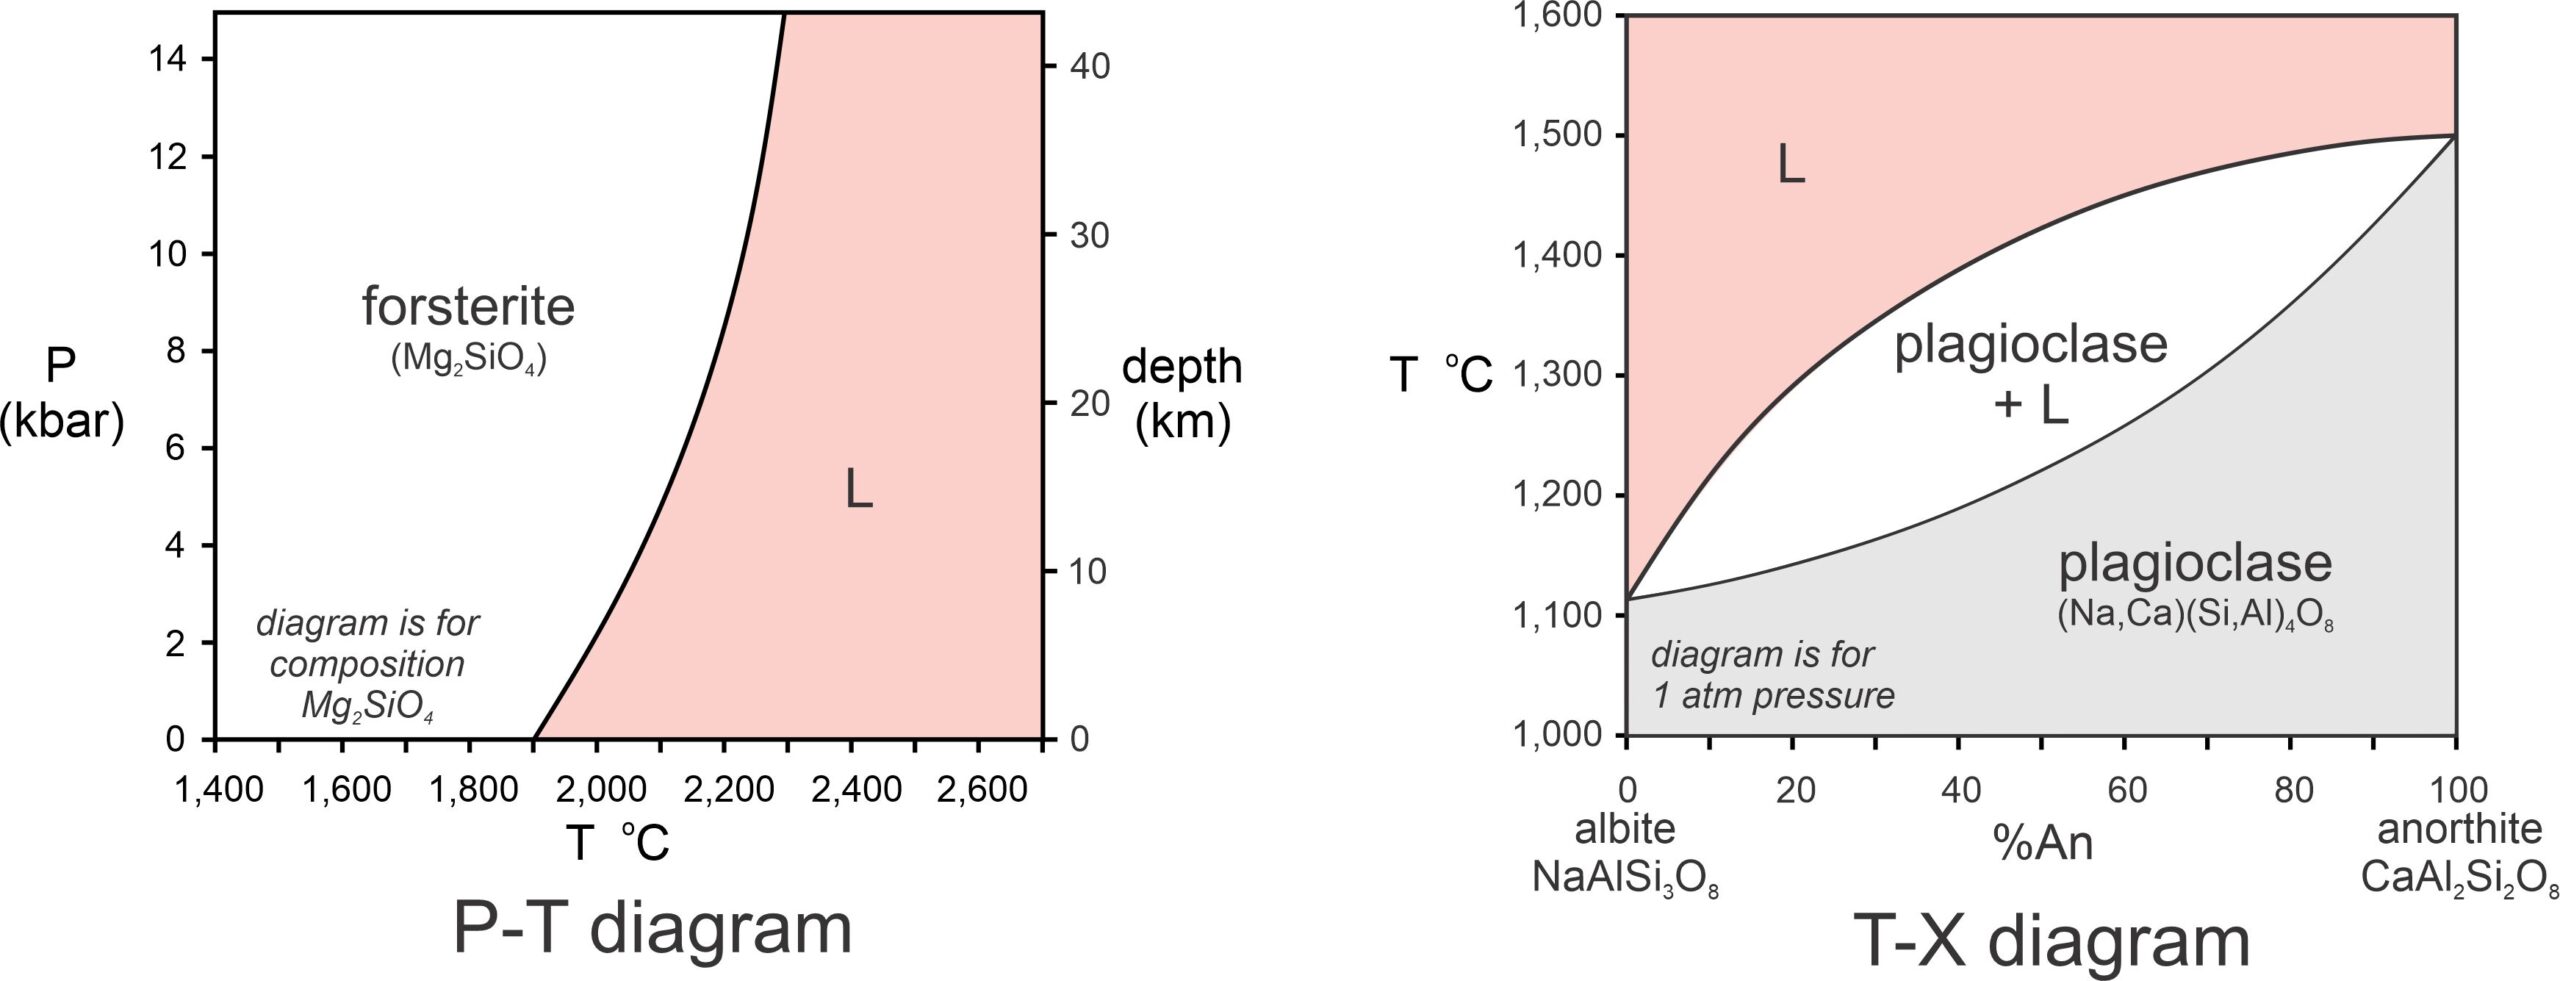
The diagram on the left in Figure 8.6 is a simple melting P-T phase diagram. It is similar in most ways with the diopside and halite diagrams we already discussed (Figures 8.2 and 8.5). The diagram on the right, a T-X diagram, is different. Plagioclase can have any composition between albite and anorthite, shown by the horizontal axis. The vertical axis is temperature. At low temperature, for composition and temperature that plot in the gray field, crystalline plagioclase is stable. At higher temperatures, in the red field, intermediate composition plagioclase melts over a range of temperatures depending on composition. For temperatures and compositions that plot in the white field, plagioclase and melt coexist. The diagram also tells us – although it may not be clear at this time – that if plagioclase melts only partially, the melt will not have the same composition as the starting feldspar. These are important considerations for many different kinds of igneous rocks and we will come back to them in more detail later.
8.2.6 Caveat
There is one important caveat about thermodynamic calculations and phase diagrams. Thermodynamics and phase diagrams tell us about systems that are at stable equilibrium only. Some systems, especially at low temperatures where reaction rates may be slow, do not reach stable equilibrium. For example, diamond is unstable at Earth’s surface, but diamonds are commonplace. Fortunately, disequilibrium is not often a problem when considering igneous rocks because they form at high temperatures where reaction kinetics are robust. It may be more of a problem for low-temperature metamorphic rocks.
8.2.7 More Complicated Examples
8.2.7.1 The SiO2 System
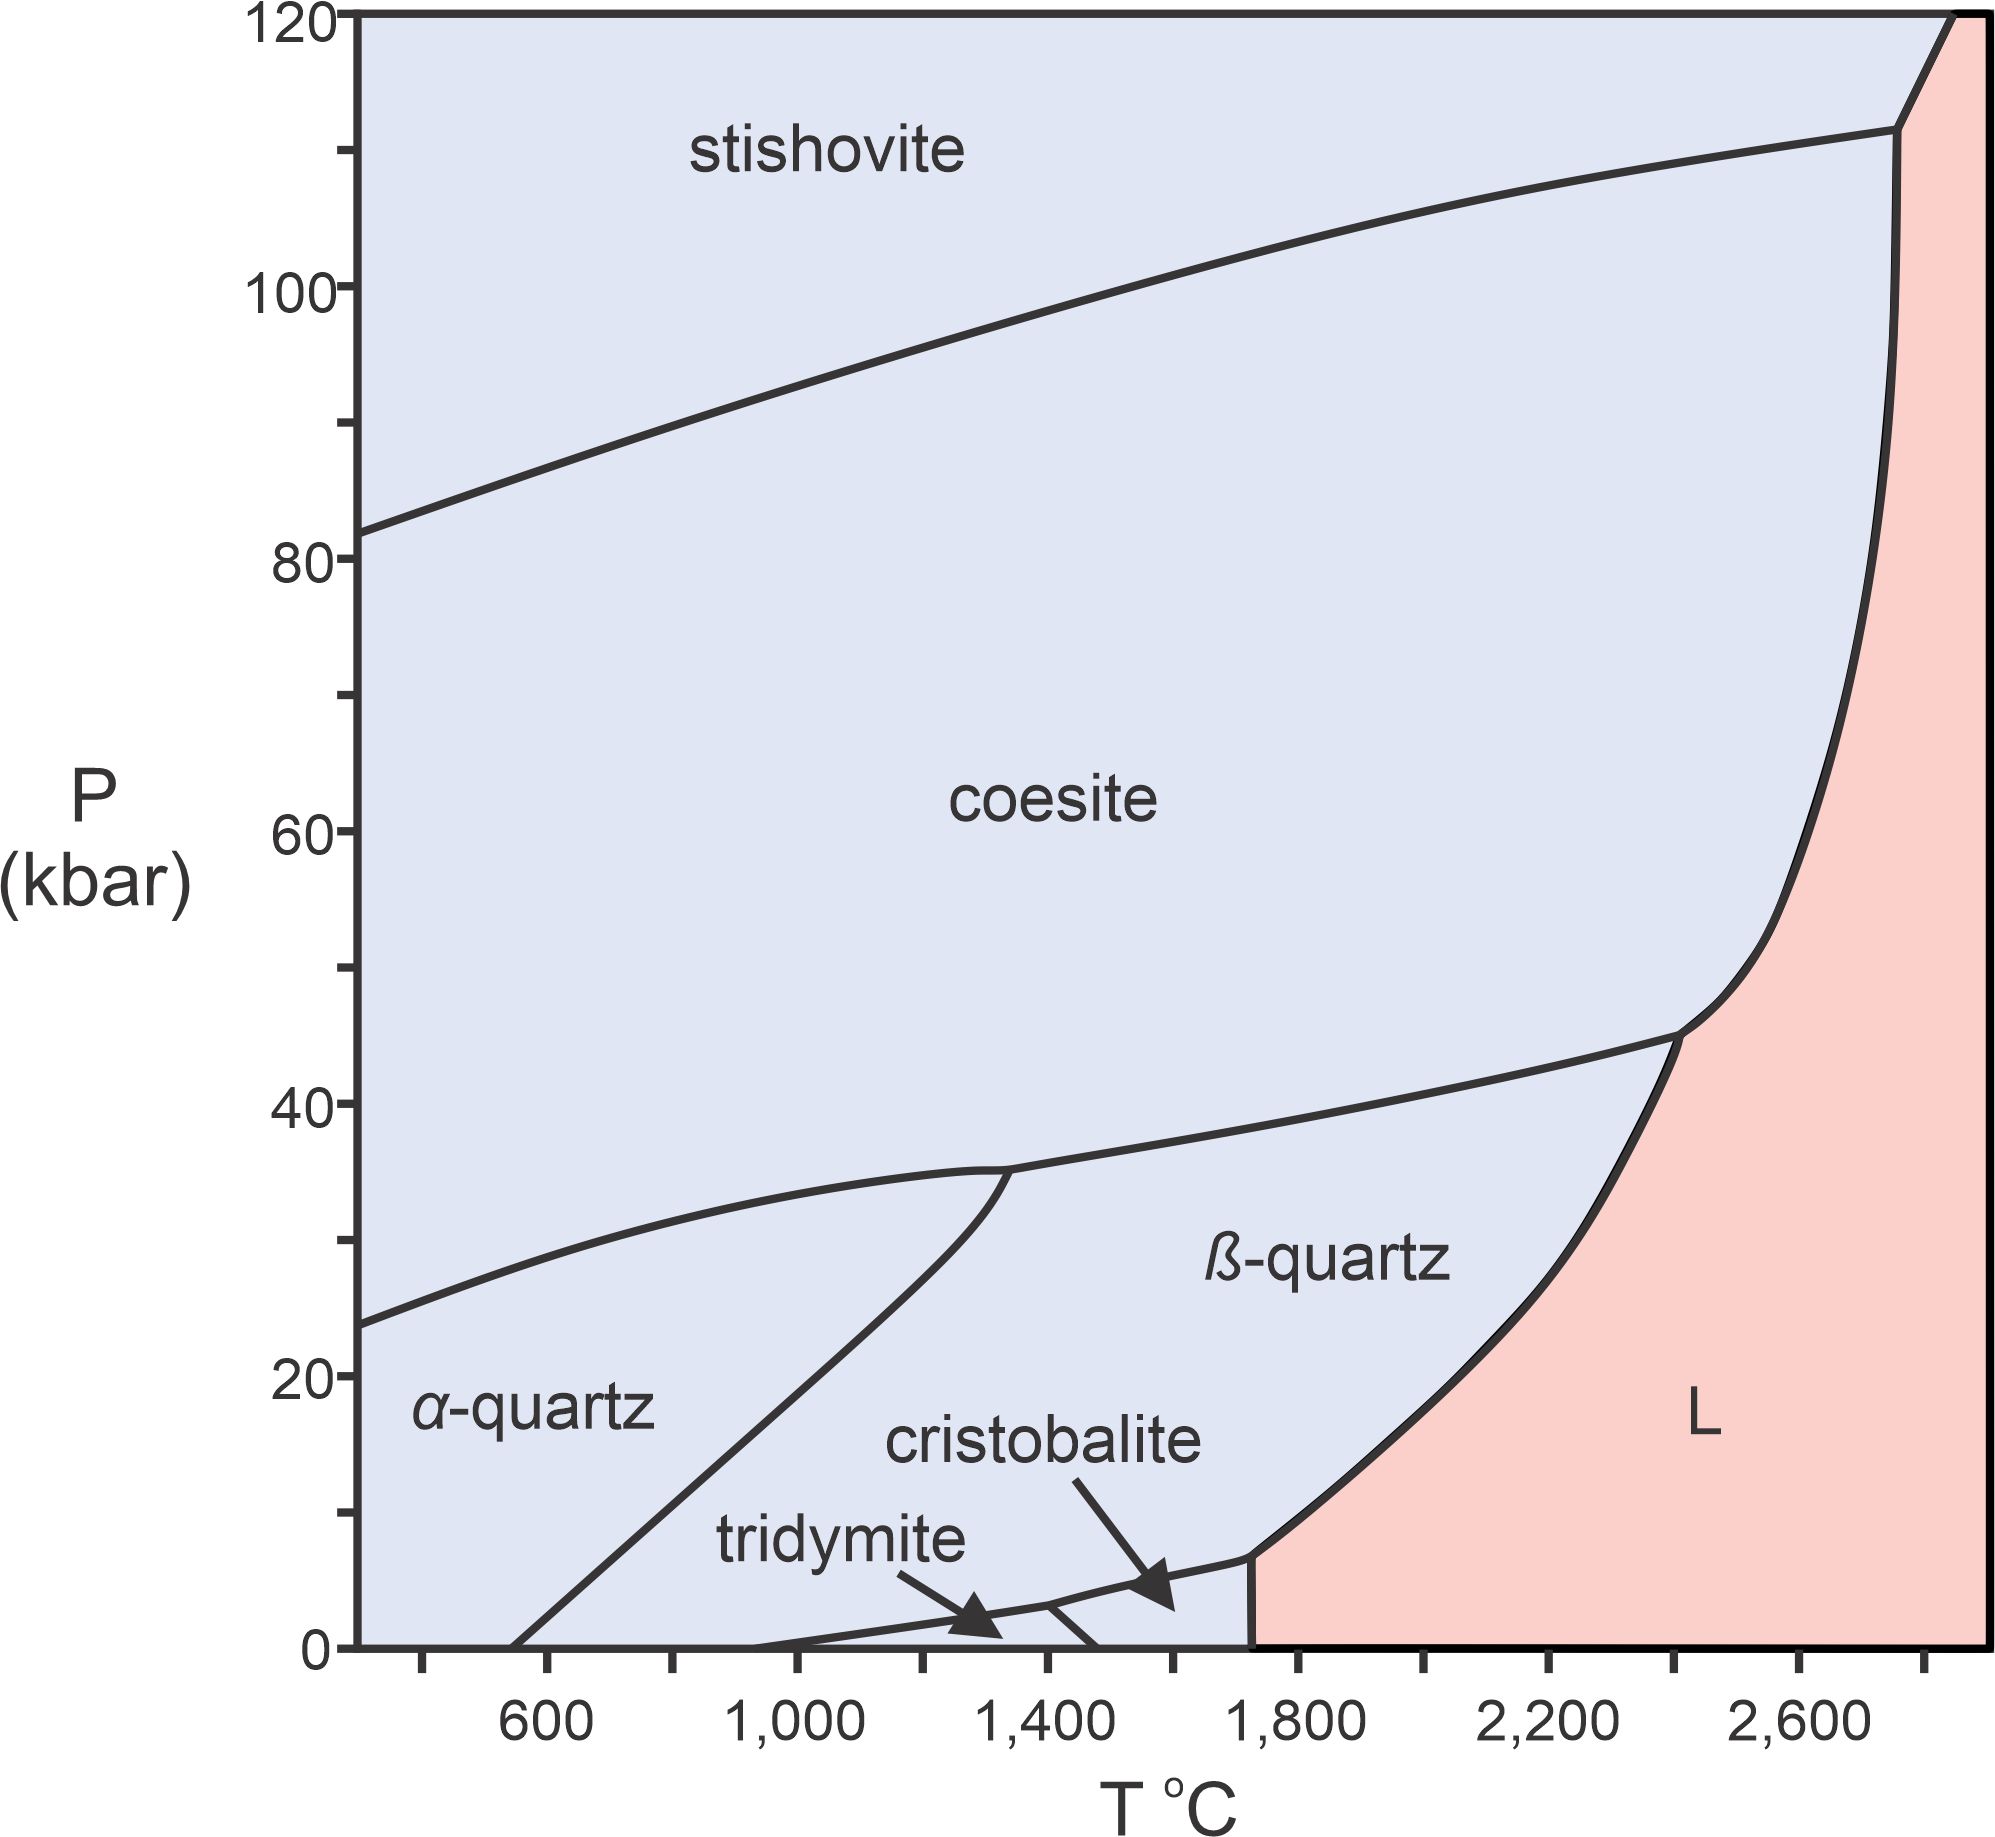
In Figures 8.2, 8.5, and 8.6 we saw melting curves for diopside, halite, and forsterite. These are relatively simple systems, involving one component and two phases (a mineral and a melt). Some 1-component systems are more complicated. The phase diagram in Figure 8.7 is an example – a P-T diagram for the silica (SiO2) system. This diagram involves a single component (SiO2), like the diopside and halite diagrams, but it includes seven phases. Six of them (stable in the blue fields on the diagram) are polymorphs – they are all crystalline SiO2, but have different arrangements of atoms within them. Molten silica is stable in the high-temperature red field, labeled L.
Quartz, more properly called alpha quartz, or sometimes low quartz, is the most common form of silica. It is the stable form of silica at normal Earth surface conditions (which plot on the bottom of the phase diagram in Figure 8.7 but off-scale to the left). The other forms of silica are each stable in their own pressure-temperature stability fields. For example, as shown in this figure, at very high pressures silica will be in the form of the mineral stishovite. Stishovite is a rare mineral only found in some meteorite impact craters where pressure was intense. At somewhat lower pressures, silica crystallizes as coesite. Coesite, too, is found in meteorite impact craters, but, it is also found in some mantle xenoliths – rocks carried from Earth’s mantle to the surface during volcanic events.
At Earth’s surface, however, most silica is α-quartz. If we heat α-quartz, it changes from α-quartz to β-quartz, then to tridymite, and then to cristobalite. Finally, with more heating, cristobalite will melt at about 1,730 oC. So, quartz, like many other minerals, does not really have a melting point. With heating, if equilibrium is maintained, it changes into other solid phases before it can melt. The red field on the diagram shows the conditions when silica will be molten. If a silica melt cools at high pressures, stishovite will crystalize. At moderate pressures, coesite or β-quartz will crystalize, and at relatively low pressures, cristobalite will crystalize. Figure 8.7 is actually a bit simplified – other rare silica polymorphs have been omitted for clarity.
8.2.7.2 The Mg2SiO4 System
Most natural olivine is a mix of iron-olivine and magnesium-olivine. Forsterite is the magnesium end-member. Figure 8.8 is a phase diagram for the Mg2SiO4 system, equivalent to the composition of forsterite. The pressure scale on this diagram goes to more than 250 kilobars, in contrast with Figure 8.6 that shows Mg2SiO4 melting up to 15 kilobars.

Unlike quartz, forsterite does not change into any other minerals with heating at low pressure. Figure 8.8 tells us however that, like quartz, forsterite turns into different polymorphs at high pressure, labeled modified spinel and spinel on this diagram. At the highest pressures, Mg2SiO4 reacts to form two separate minerals, MgSiO3-perovskite and periclase. Pressures of 100s of kilobars are only found in Earth’s mantle. The high-pressure polymorphs (spinel or modified spinel) and perovskite-periclase are only stable at depths of more than 400 kilometers.
8.2.7.3 The H2O System
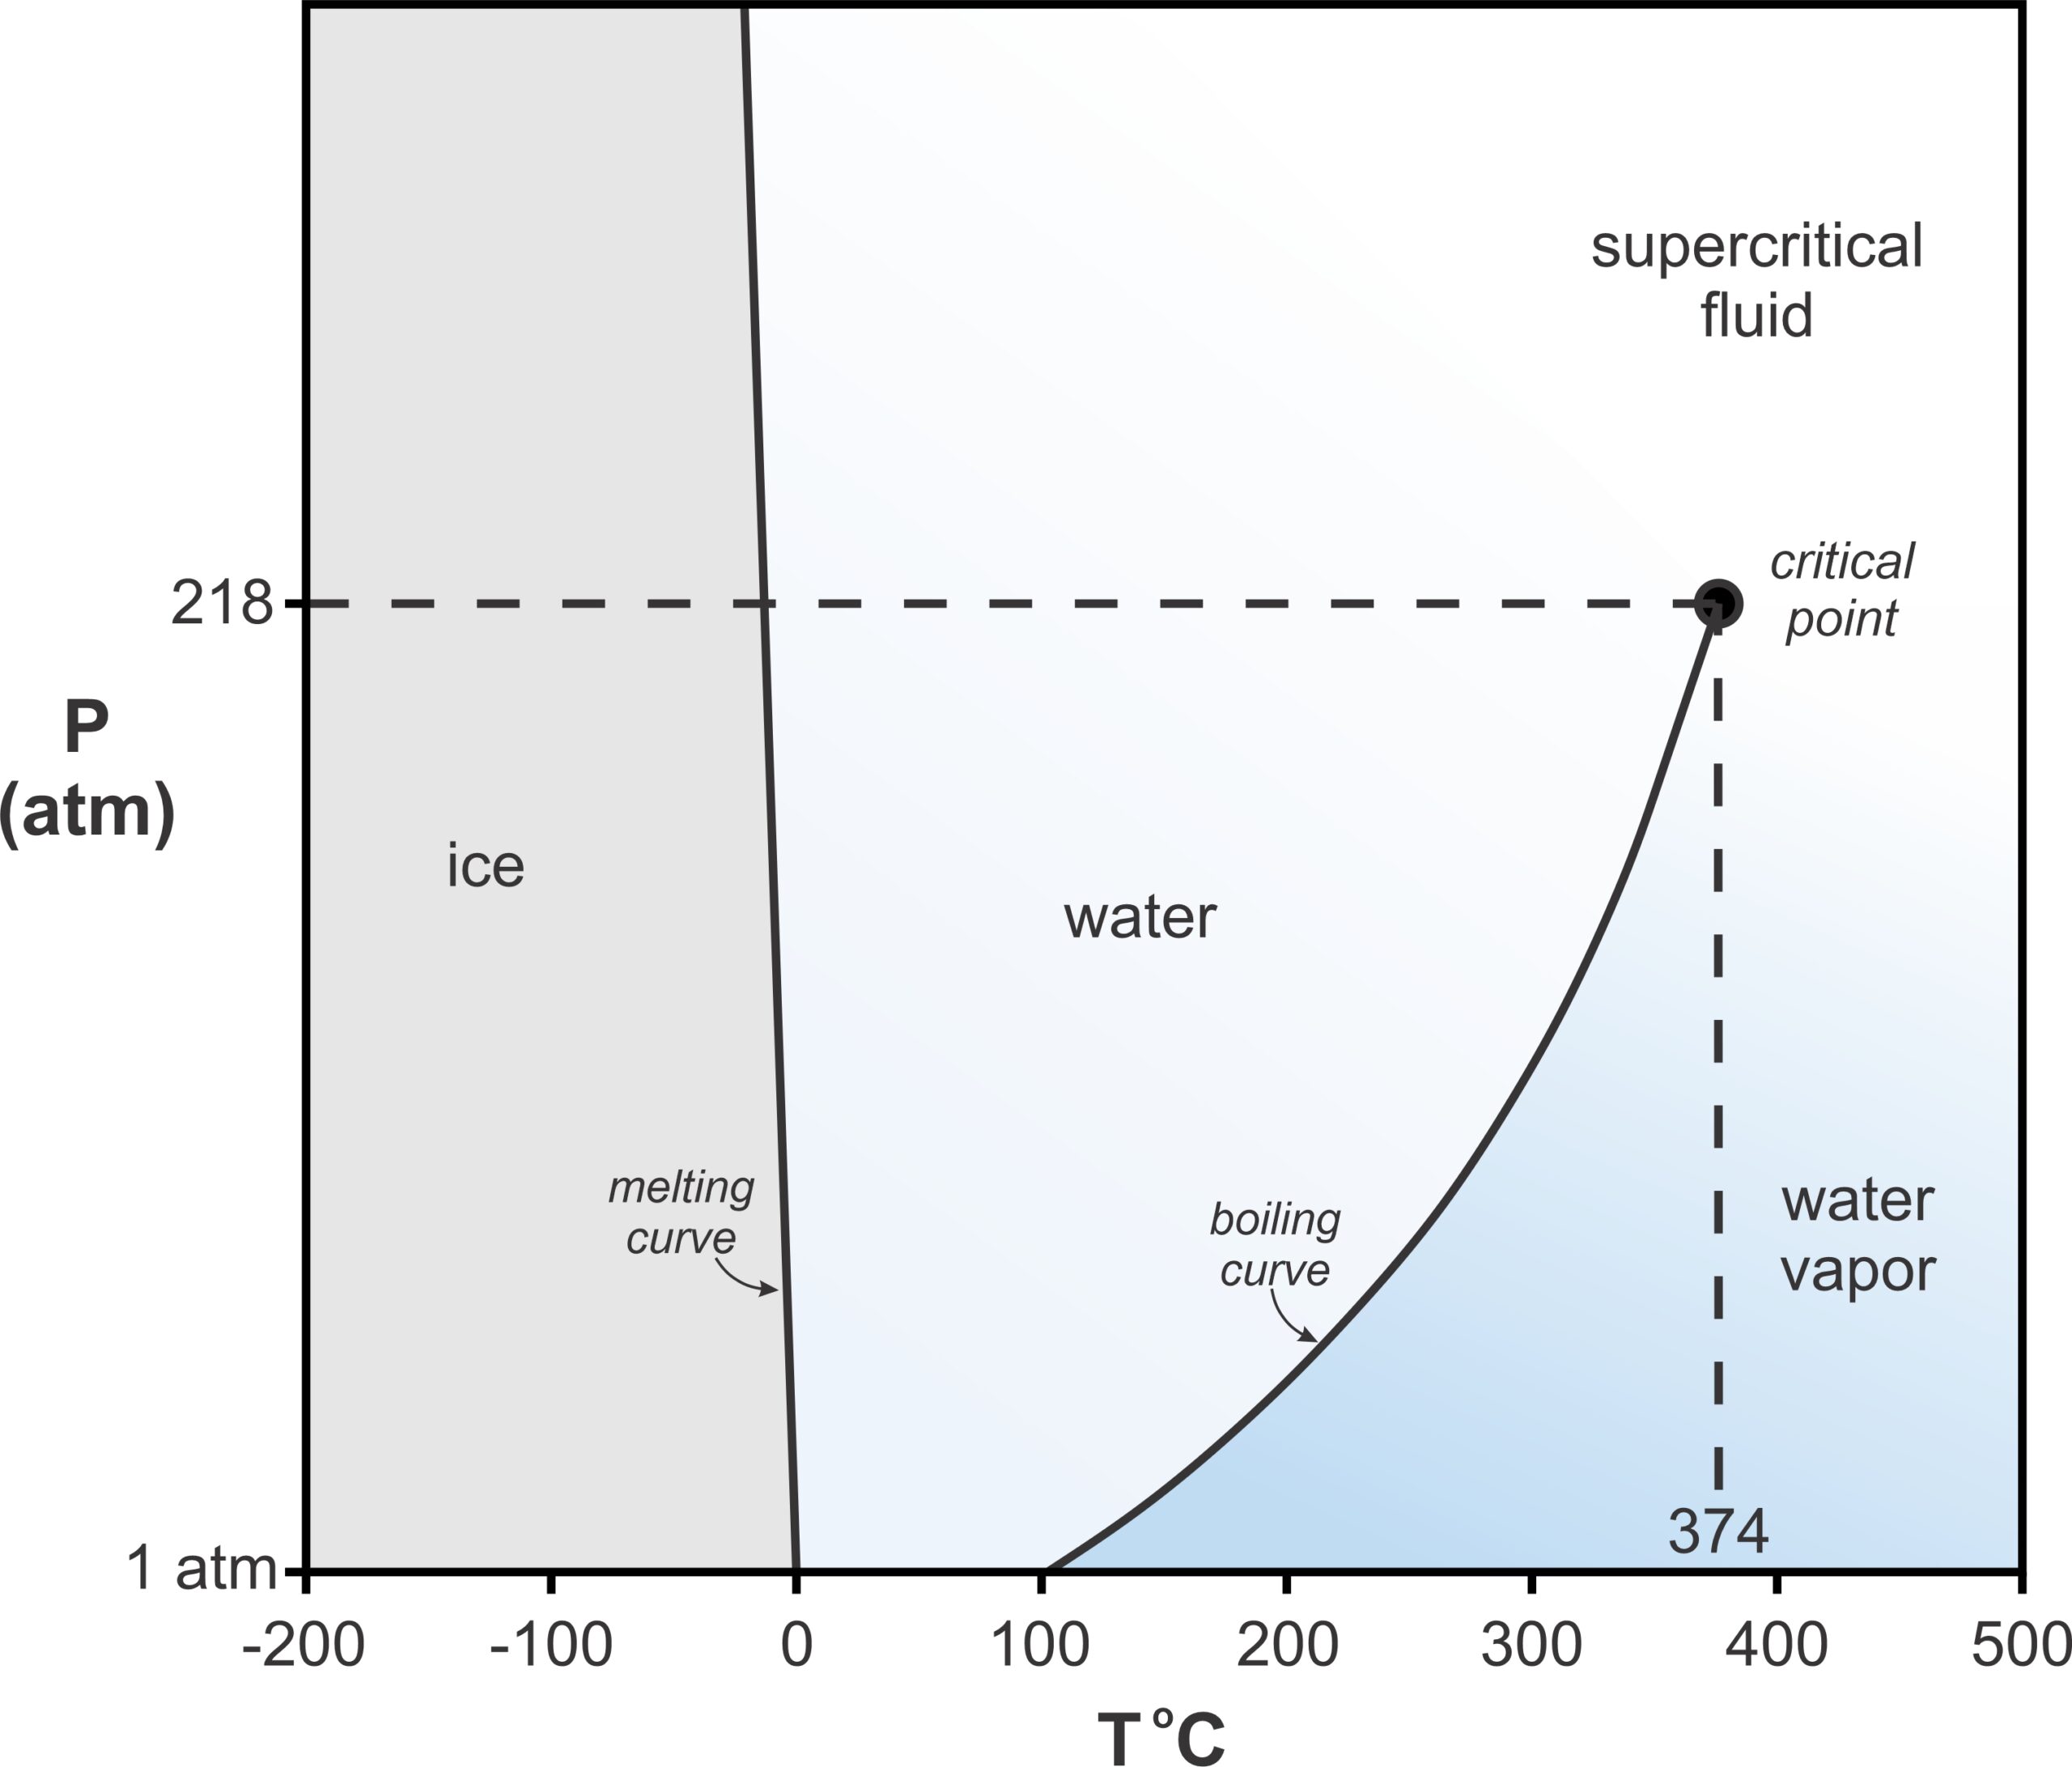
Before moving on to systems that contain more than one component, let’s look at another example of a 1-component system. Figure 8.9 is a phase diagram for H2O. Most minerals melt at higher temperatures if pressure increases. Ice is one exception. Solid H2O (ice) is less dense than liquid H2O (which explains why ice floats on water). This means that line between the ice and water fields, showing melting temperatures, has a negative slope on this phase diagram. This contrasts with all the melting curves we saw on previous diagrams that had positive slopes.
At 1 atmosphere, ice melts at 0 oC and water boils, producing steam, at 100 oC. But a curious thing happens at higher pressures. At pressure a little more than 200 atmospheres, above the critical point, water and steam have identical properties. Both become supercritical fluids – we cannot distinguish liquid water from water vapor (steam). The H2O system also contains another (mostly esoteric) interesting feature. At low pressures, much less than 1 atmosphere and off the scale of this diagram, ice, water, and water vapor all may coexist at what we call a triple point where the melting curve and the boiling curve intersect.
8.3 Binary Systems
The T-X diagram for plagioclase in Figure 8.6 was an example of a binary system, also called a two-component system. The phases considered were made of some combination of NaAlSi3O8 and CaAl2Si2O8. Now, let’s look more closely at binary systems.
Figure 8.10 depicts another binary system and minerals it contains. The two chemical components are MgO and SiO2, and the line between them includes compositions made of combinations of the two.

As seen in Figure 8.10, MgO and SiO2 are the compositions of minerals – periclase and quartz, respectively, but chemical components do not have to correspond to minerals. Components are simply the ingredients that combine in different proportions to make the phases of interest. Periclase is 100% MgO and plots at the left end of the line. Quartz is 100% SiO2 and plots at the right end of the line. This system, MgO-SiO2, also contains two other relatively common minerals: forsterite (Mg2SiO4) and enstatite (MgSiO3).
Generally, we use weight % values in these kinds of diagrams. Forsterite contains 42.7 wt% SiO2 and enstatite contains 59.8 wt% SiO2, shown by red dots on the composition line. Wt% and mol%, however, are not the same. The formula of enstatite is equal to MgO plus SiO2, so, on a molar basis enstatite is 50% MgO and 50% SiO2. If the horizontal axis was in mol% instead of wt%, enstatite would plot at 50% not 59.8%. Similarly, forsterite’s formula equals 2 MgO plus 1 SiO2. On a molar basis, forsterite is 66.7% MgO and 33.3% SiO2, but not on a weight basis. The difference between wt% values and mol% values is because a mole of MgO does not weigh the same as a mole of SiO2.
Sometimes we use mineral names for components, and it can lead to confusion. For example, we may call the component MgO periclase (Pe) even if we are not talking about the mineral with that composition. And we call the component SiO2 quartz (Qz), even if quartz is not present. We also commonly abbreviate when describing phase compositions. So, forsterite has composition Pe57.3Qz42.7, and enstatite has composition Pe40.2Qz59.8.
One convenient thing about binary composition diagrams is we can easily write reactions involving three phases. We choose any three from a composition line and a balanced reaction will involve the two on the outside reacting to produce the one between them. Two examples from Figure 8.10 are:
| [Rxn 1] | forsterite + quartz = 2 enstatite Mg2SiO4 + SiO2 = 2 MgSiO3 |
| [Rxn 2] | periclase + quartz = enstatite MgO + SiO2 = MgSiO3 |
Just because we can write and balance a reaction does not mean it will occur. But, reactions 1 and 2 do occur in any rock if the reactants on the left side of the equal sign are present. This explains why we do not find forsterite or periclase with quartz in igneous rocks – enstatite would be present instead.
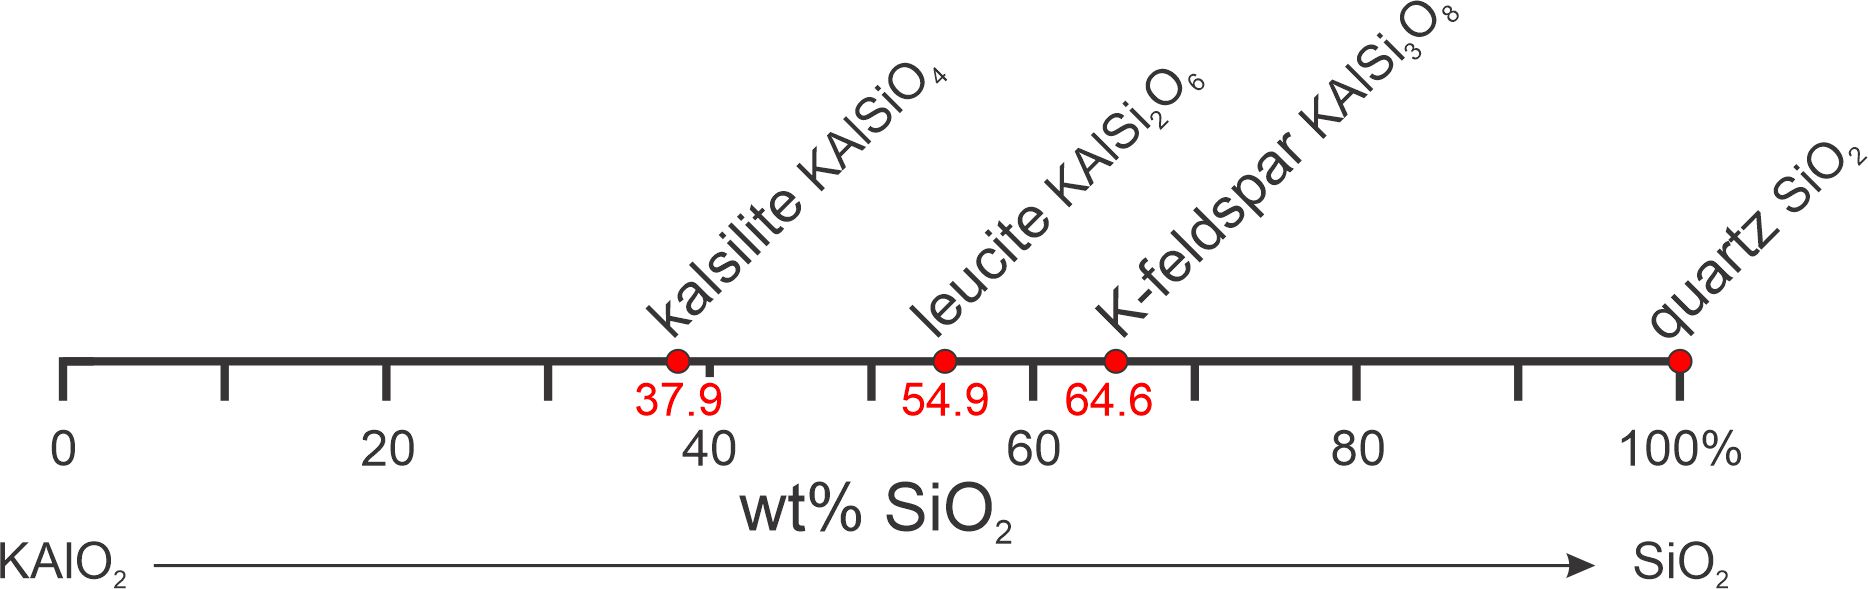
Here (Figure 8.11) is another example of a composition diagram, this time with components KAlO2 and SiO2. This system contains three intermediate-composition minerals: kalsilite, leucite, and K-feldspar. SiO2 is, of course, the composition of quartz, but KAlO2 corresponds to no known mineral. Although KAlO2 is an unconventional choice for a component, I chose it to emphasize the idea that components need not correspond to minerals. Composition diagrams are still valid and useful. Note that we can pick reactions off of this diagram as we did for Figure 8.10, for example:
| [Rxn 3] | kalsilite + 2 quartz = K-feldspar KAlSiO4 + 2 SiO2 = KAlSi3O8 |
This reaction, like reactions 1 and 2, always occurs if possible and explains why we do not find kalsilite and quartz together in igneous rocks. Because Figure 8.11 contains four minerals, we could list four reactions (every reaction is missing one mineral). If we had five minerals on our 2-component diagram, there would be many more possible reactions, but all would involve three minerals. It is impossible to balance a reaction involving more than three phases in a binary system. Try it for yourself.
8.3.1 Binary Eutectics and Crystallization
Now that we understand composition diagrams and components, let’s look at an example that shows why they are meaningful.
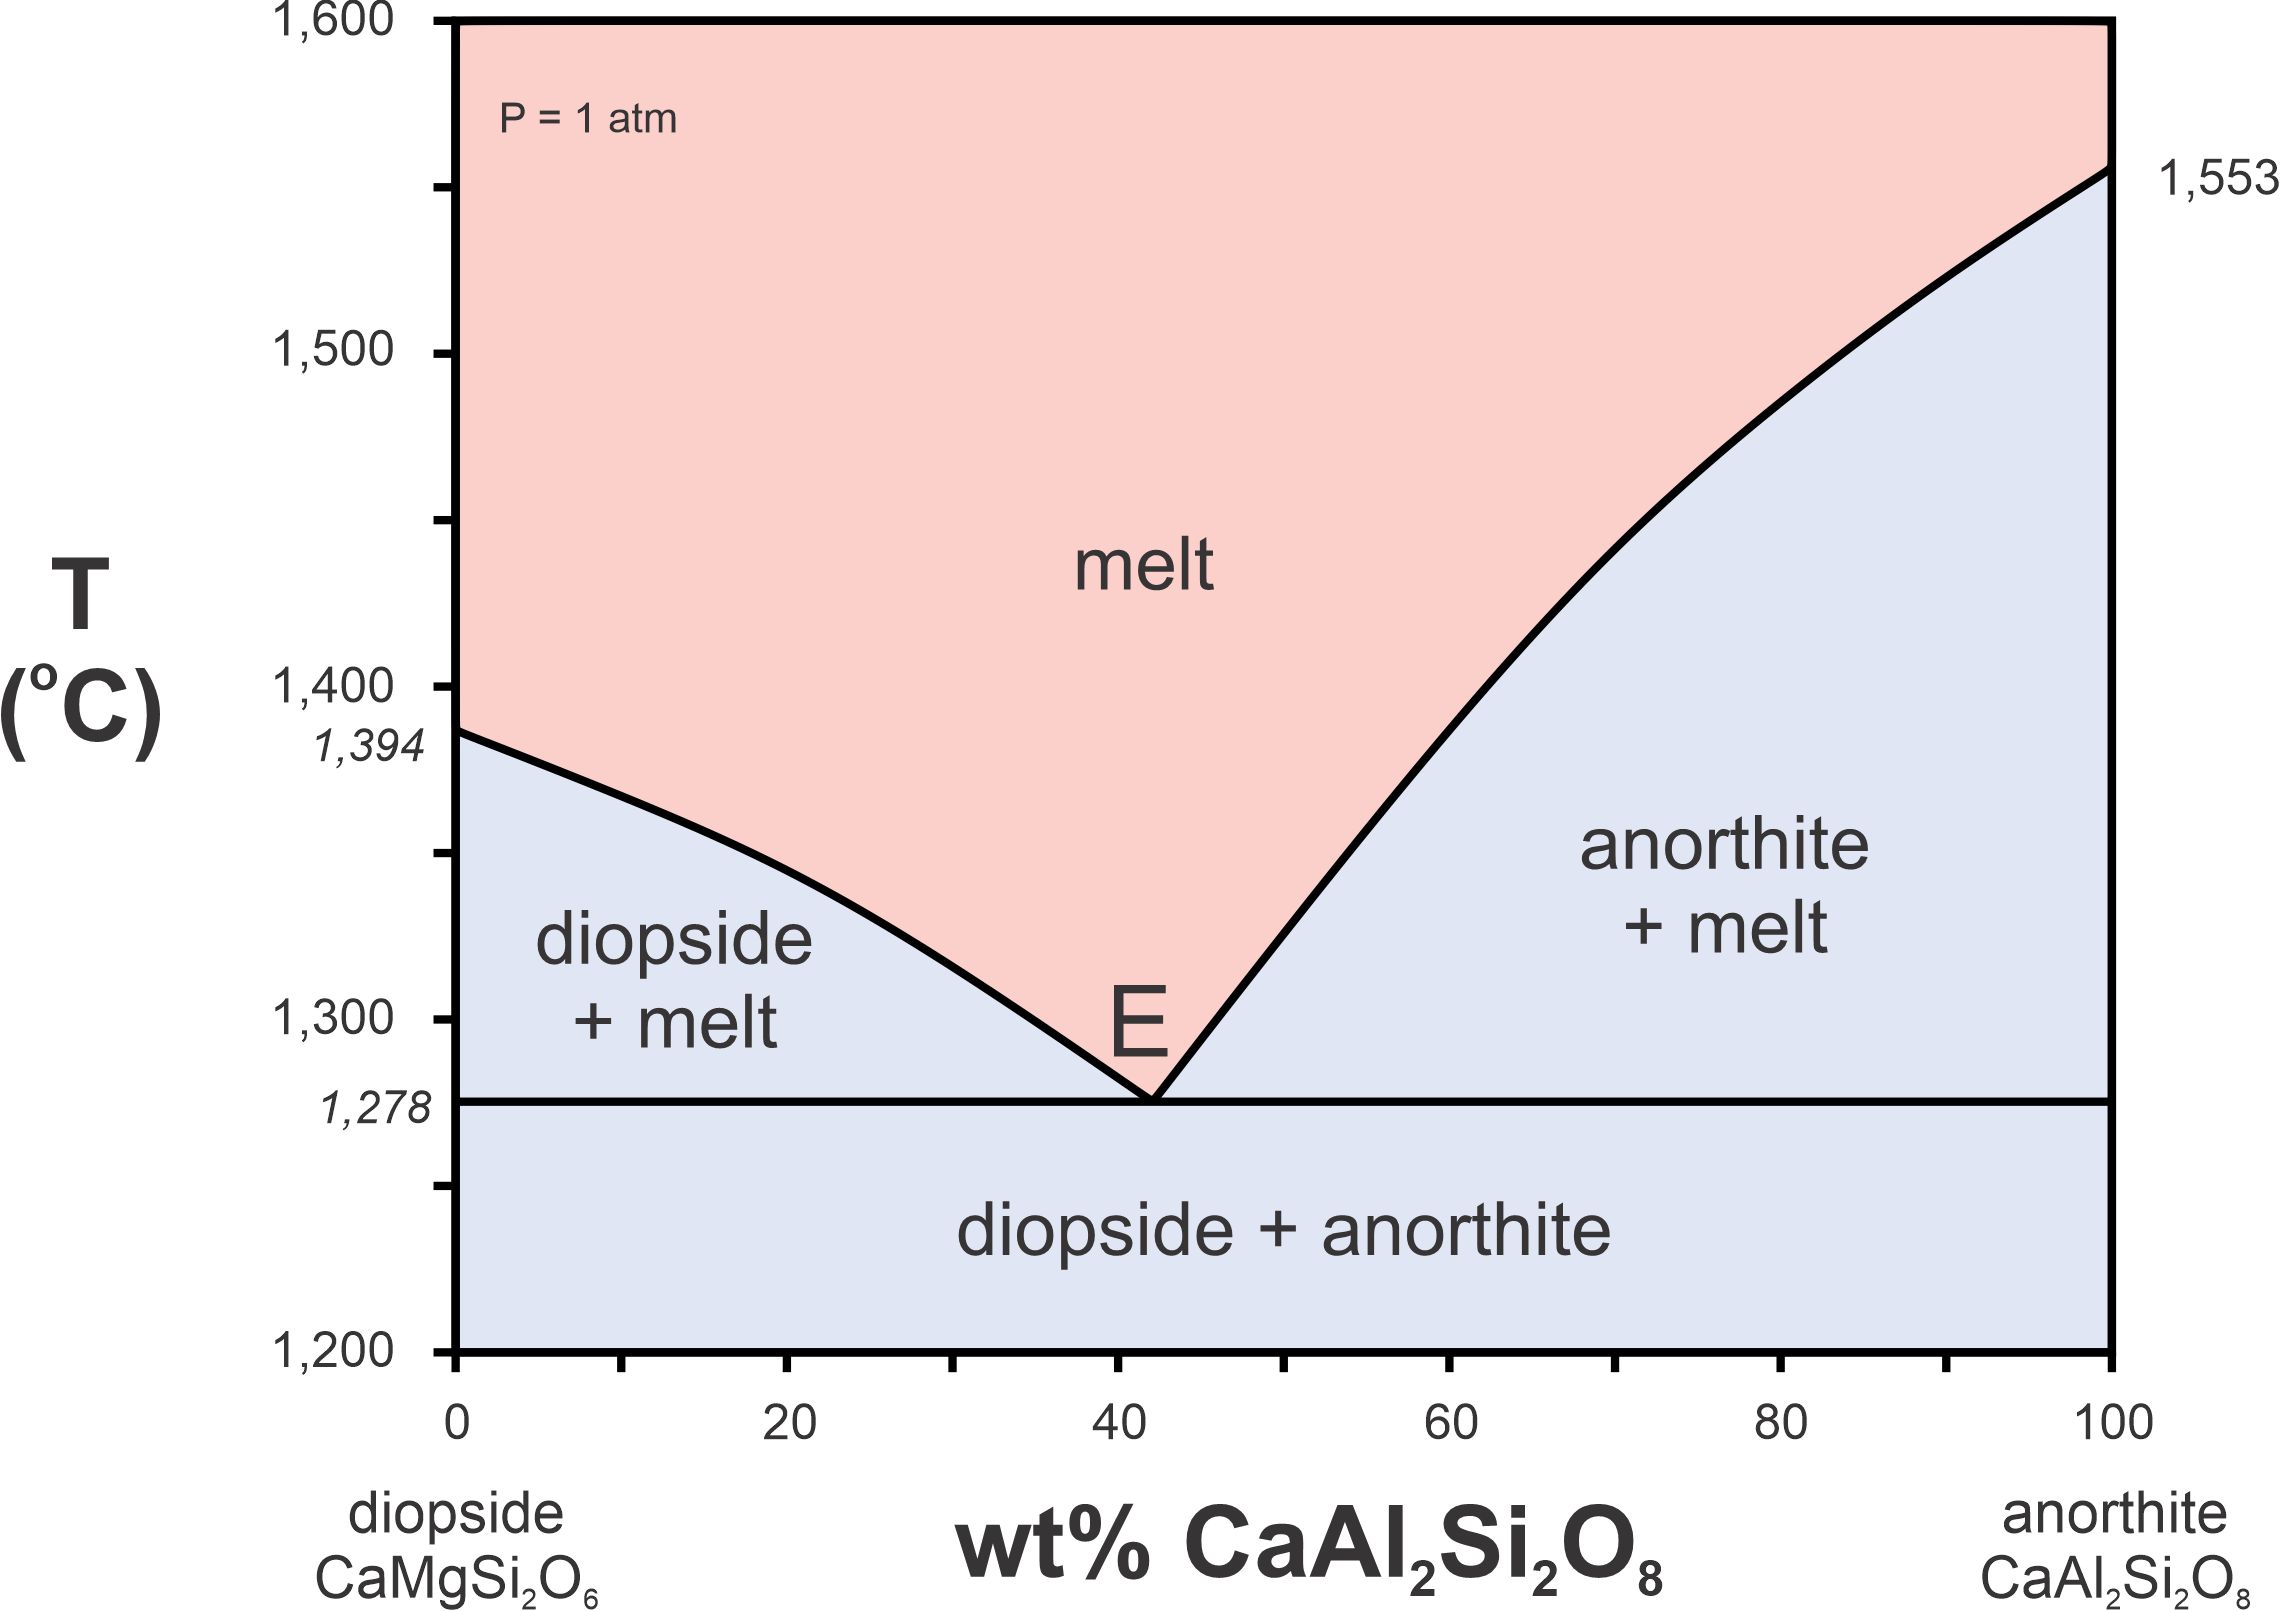
The components in Figure 8.12 are CaMgSi2O6 and CaAl2Si2O8, more complicated than ones considered previously. The diagram involves three phases: diopside (CaMgSi2O6), anorthite (CaAl2Si2O8), and melt. The red region is the melt field – the melt can have any composition between CaMgSi2O6 and CaAl2Si2O8, depending on the temperature. This diopside-anorthite system is a simple model of melting and crystallization of basalt.
Numbers on the left and right sides of this diagram show that a melt equivalent to diopside in composition will crystallize at 1,394 oC, and a melt equivalent to anorthite composition will crystallize at 1,553 oC. But a melt of intermediate composition may cool all the way down to 1,278 oC before it starts to crystallize (the lowest point in the melt field). This happens for a melt that is about 42% anorthite and 58% diopside (Di58An42).
The phase diagram in Figure 8.12 is an example of a binary eutectic diagram, and point E is the eutectic point. The eutectic point is at the lowest temperature where a melt can exist; in this system it is at 1,278 oC. The composition corresponding to point E, An42Di58, is the eutectic composition. Figure 8.12 is for 1 atm pressure, but as we saw previously, melting temperatures depend on pressure. So, T-X diagrams of this sort will be different if pressure is different. Usually, if pressure is greater, the melting and eutectic temperatures are greater. And commonly, the eutectic composition changes slightly depending on pressure.
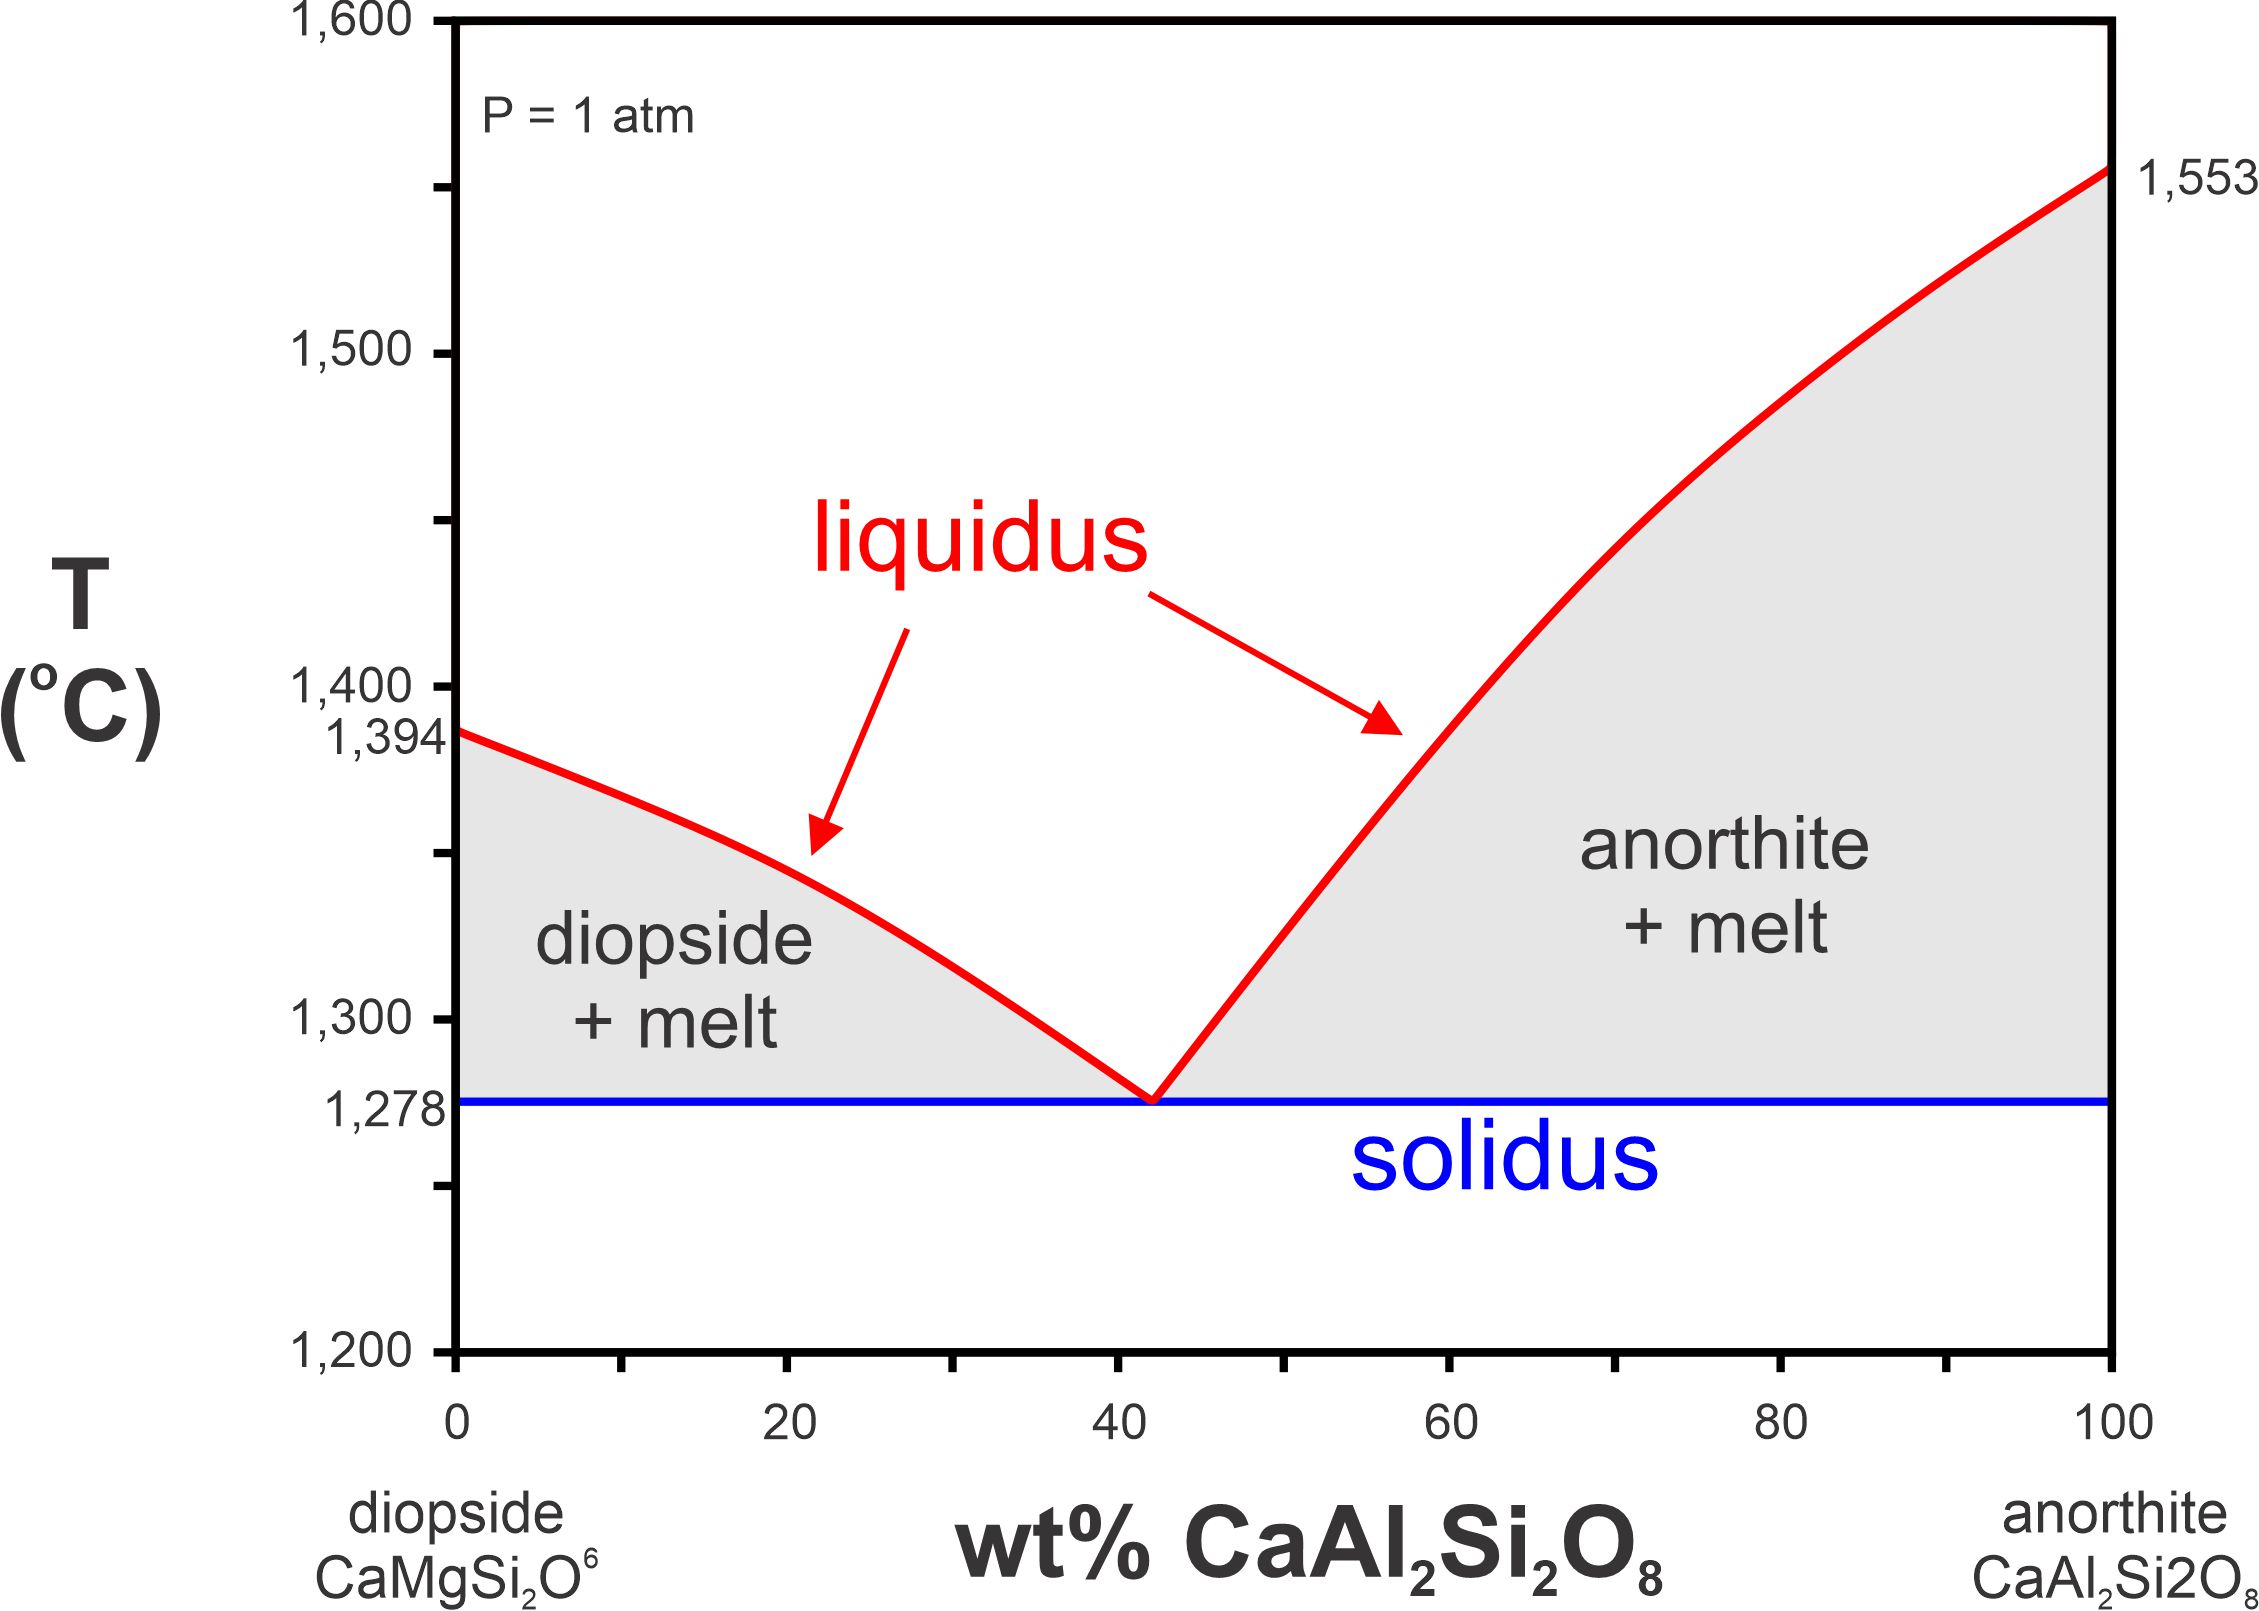
We call the two curves bordering the bottom of the melt field, together, the liquidus (Figure 8.13). For a composition and temperature that plots above the liquidus, all will be molten. And, if a melt that is at high temperature cools, crystallization will begin when the temperature reaches the liquidus. Crystallization will continue as temperature drops until the temperature reaches the solidus, the temperature below which everything must crystallize. The difference between liquidus and solidus temperatures may be 0 to many 100s of degrees depending on melt composition. In the diopside-anorthite system, the solidus (at 1 atm pressure) is a horizontal line at the eutectic temperature, 1,278 oC.
At temperatures between the liquidus and solidus, melt and crystals can coexist in what we call two-phase fields, the field in gray in Figure 8.13. If the original melt composition is to the left of the eutectic, after crystallization begins, diopside and melt will be present until the temperature reaches the solidus. If the melt composition is to the right of the eutectic, anorthite and melt will be present until the temperature reaches the solidus. This is why the gray fields are labeled as they are in the phase diagram.

Consider, for example, a melt with composition 80% CaAl2Si2O8 and 20% CaMgSi2O6 (An80Di20). It is entirely molten at some temperature above the liquidus and starts cooling (point A in Figure 8.14). Crystallization will start at point B, at about 1,485 oC. At this temperature, anorthite crystals will begin to form. With further cooling, the blue dashed line and arrow showing cooling pass through the two phase anorthite + melt field. So, more anorthite will form until temperature reaches point C at 1,278 oC. This is the eutectic temperature and the solidus temperature. At this temperature, crystals of diopside and anorthite will crystallize simultaneously until all the melt is gone. More cooling moves the now solid melt below the solidus into the diopside + anorthite field (point D). The result will be a rock that is 80% anorthite and 20% diopside.
During cooling, as anorthite crystallizes, the remaining melt will become more diopside-rich. As the temperature drops, the melt composition follows the liquidus curve from point B to the eutectic (E). As the temperature nears 1,278 oC, the eutectic temperature, only a very small amount of melt will remain. The very last drop of melt will have the eutectic composition, about An42Di58.
8.3.1.1 Examples of Rocks
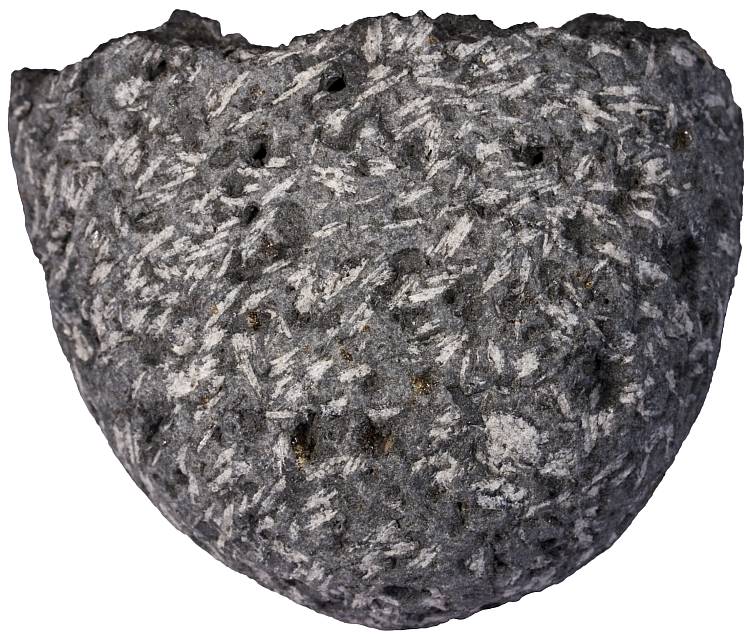
The photo in Figure 8.15 is a diabase, an intrusive rock made mostly of plagioclase and pyroxene that has the composition of common basalt. The white plagioclase phenocrysts are euhedral to subhedral because they grew first while surrounded by melt. Subsequently, at the eutectic temperature, pyroxene crystallized all at once. So the dark colored pyroxene groundmass contains fine-grained anhedral crystals that filled the space around plagioclase crystals. In diabase, the pyroxene is augite, which is similar to diopside (CaMgSi2O6) but contains small amounts of additional elements. The feldspar is anorthite-rich plagioclase. So the phase diagram example in Figure 8.14 is a good model for this rock.
Rocks, like the one in Figure 8.15, that have lath-shaped crystals of plagioclase surrounded by pyroxene (or olivine), have what we call an ophitic texture, sometimes called a diabasic texture. We discussed this texture in Chapter 7 (Section 7.7.2), and Figure 7.38 is a photo of a gabbro that displays ophitic texture.
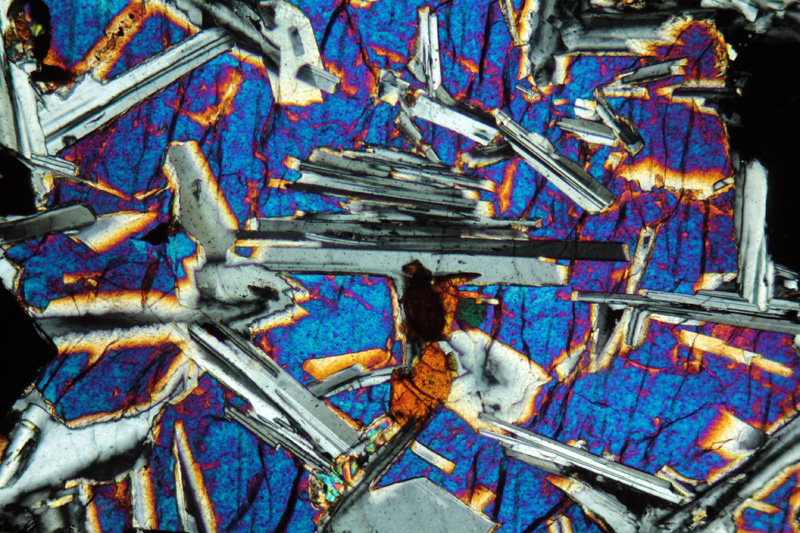
Figure 8.16 is a microscope view of a thin section of a rock with ophitic texture. The largest grains in this view are only a few millimeters long. The colors are not mineral colors – they are interference colors, artifacts of viewing a thin section using a polarizing petrographic microscope. But the textures are real and it does not take much imagination to interpret this texture to mean that the gray striped plagioclase crystals formed before the blue-red brightly colored pyroxene crystals developed around them.

Crystallization of a melt with composition to the left of the eutectic in Figure 8.14 will be similar to the crystallization just discussed, except that diopside will crystallize first. It will be the only mineral present until temperature reaches the eutectic. Then diopside and anorthite will crystallize together until the melt is entirely gone. The rock seen in Figure 8.17, a gabbro, is an example. Fine grained, light-colored, plagioclase surrounds large dark colored pyroxene crystals.
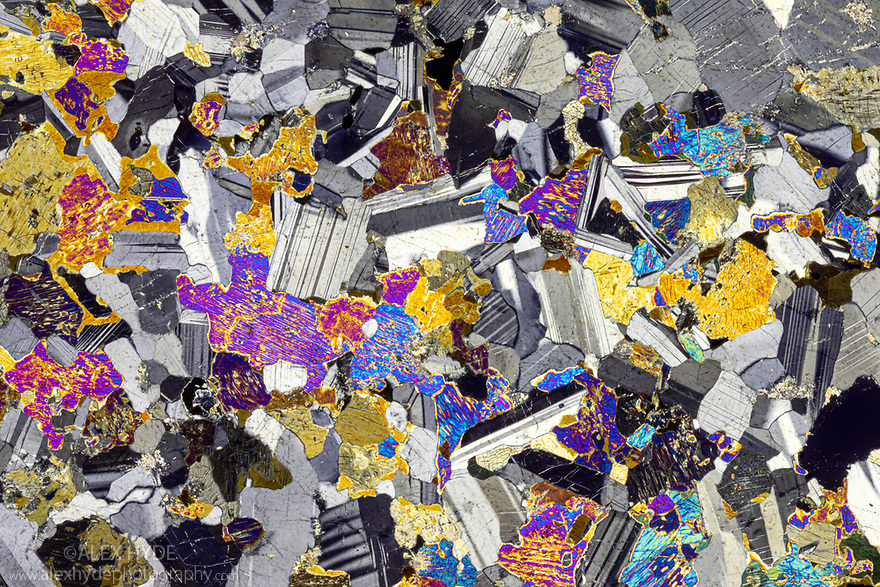
The photo in Figure 8.18 is a thin section view of an olivine-containing gabbro. The crystals in this rock are up to 1 to 3 millimeters across. The brightly colored minerals – mostly pyroxene but also some olivine, crystallized first. Subsequently the gray plagioclase laths filled spaces left over. The colors seen, as in Figure 8.16, are interference colors, not the real colors of the minerals.
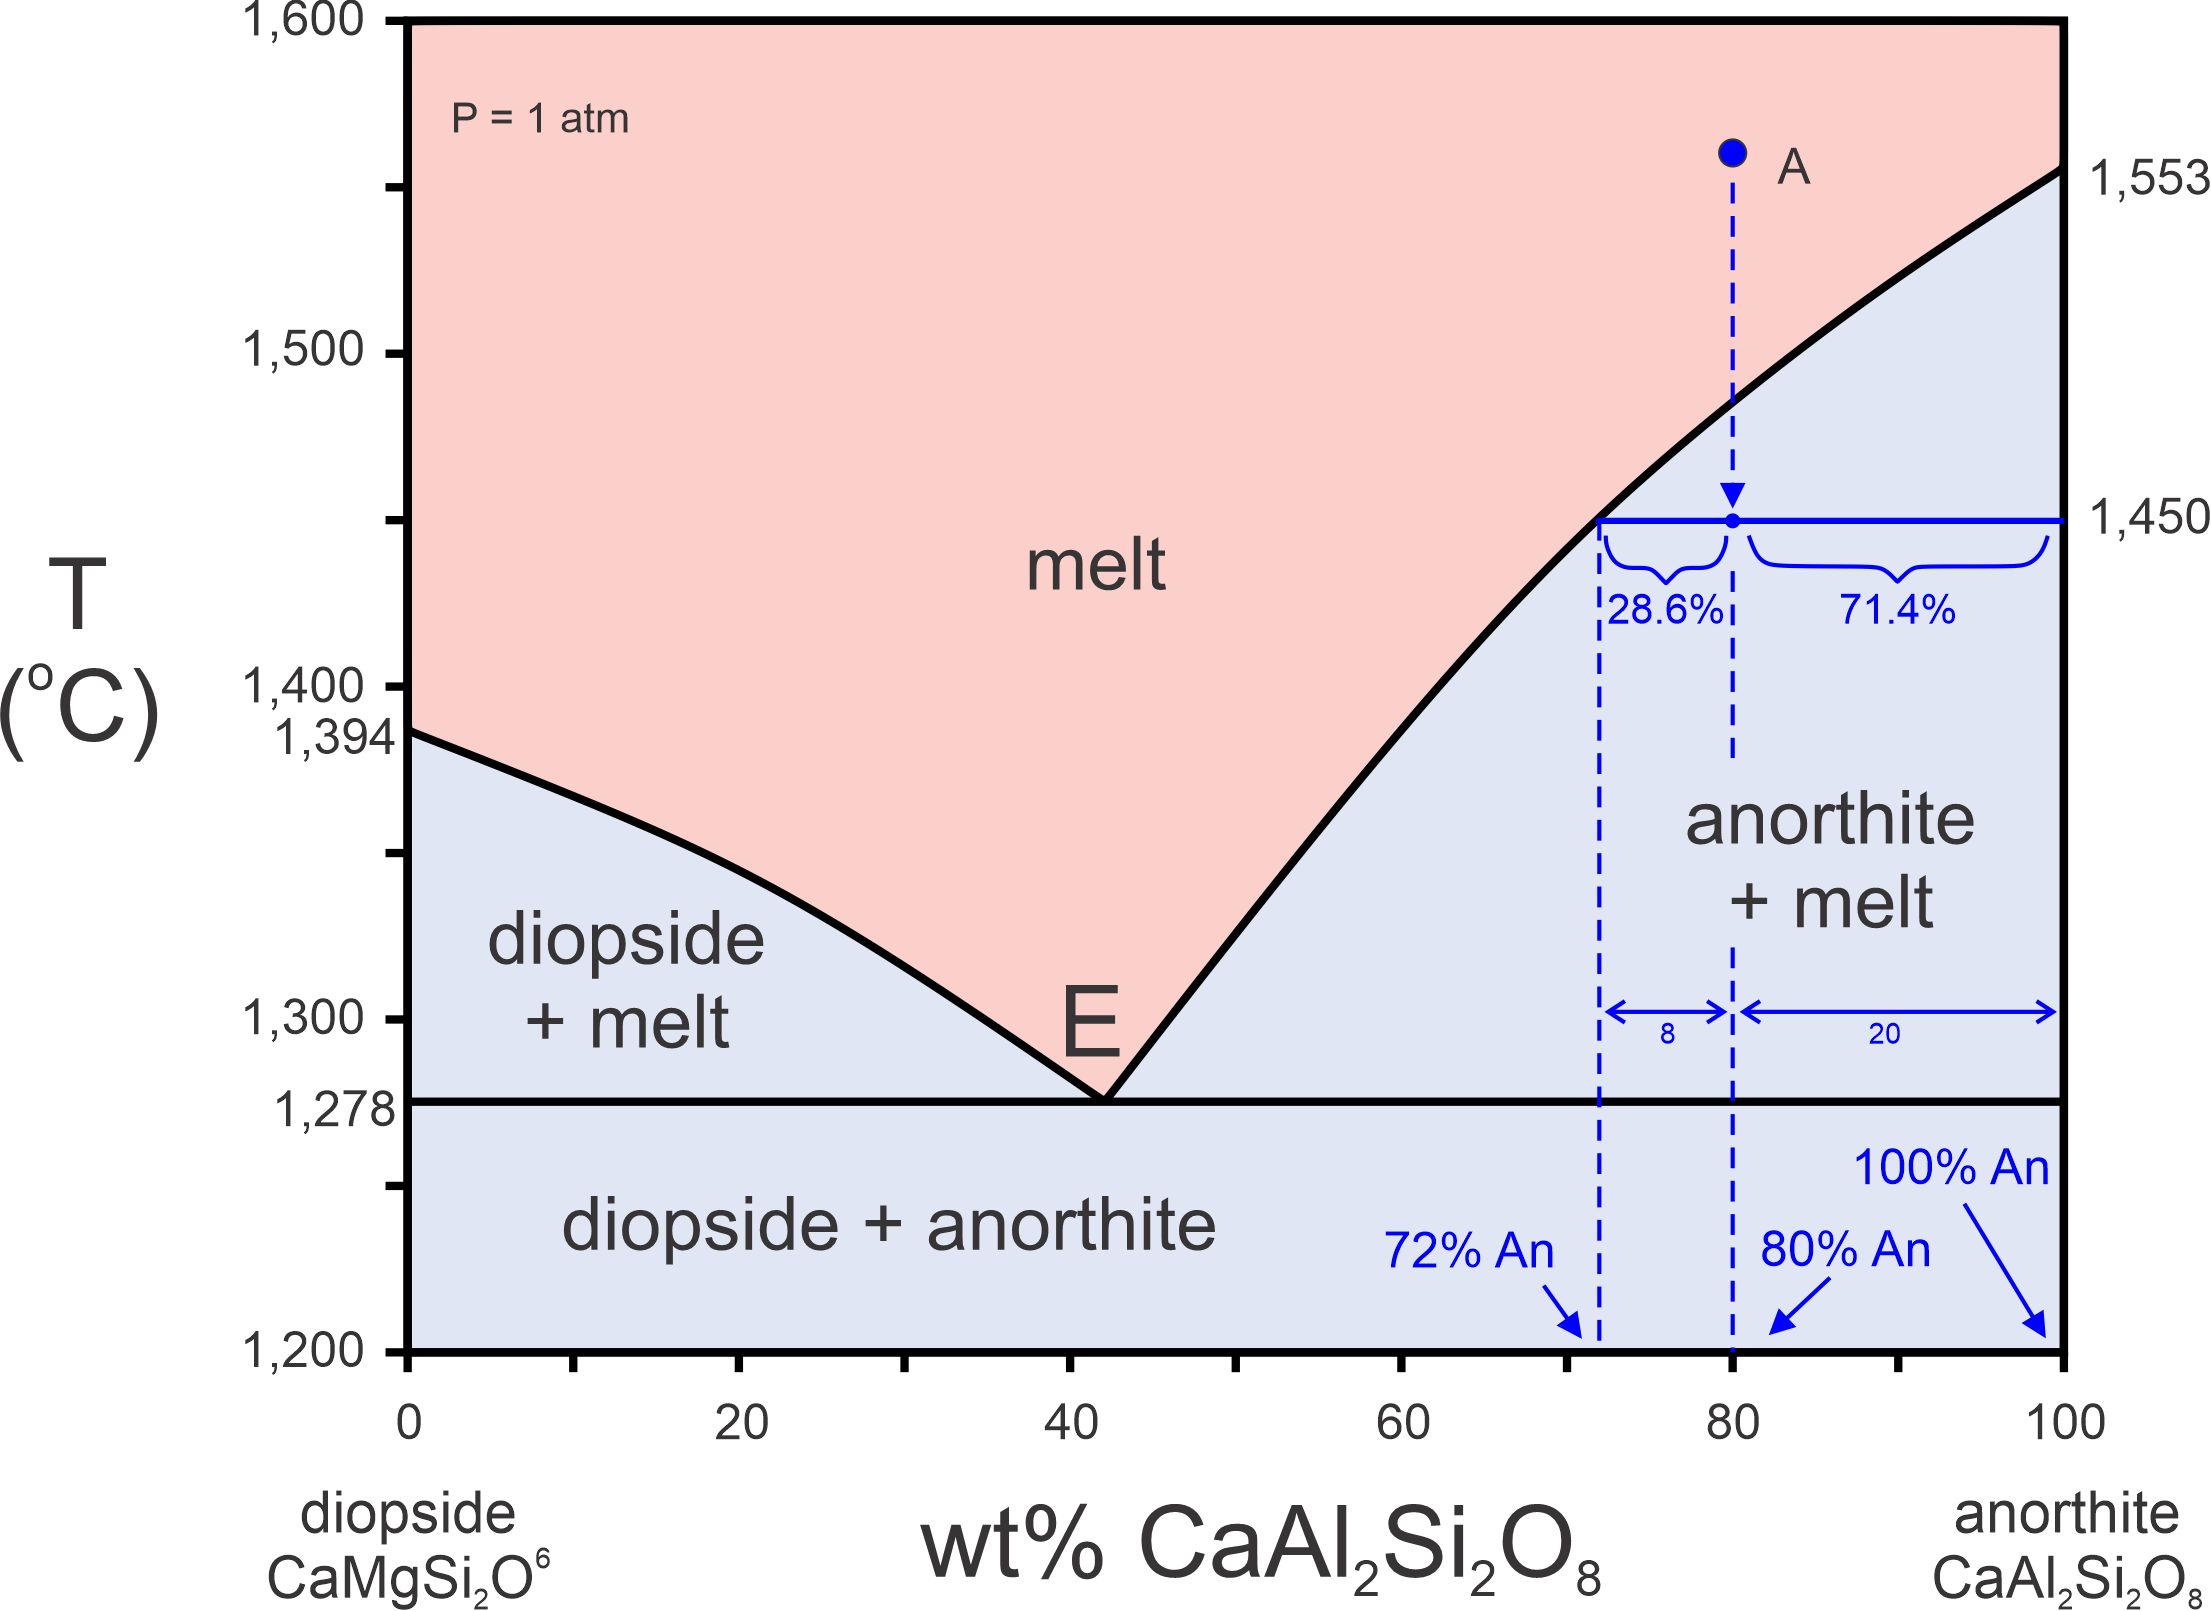
T-X diagrams may reveal quantitative, not just qualitative information. In Figure 8.19, we are considering the same melt (An80Di20) as in the previous phase diagram. Suppose the melt cools from point A to 1,450 oC. The intersection of the melt composition with a horizontal line at 1,450 oC is in the anorthite + melt field, so anorthite and melt will be present. The horizontal line in the two-phase field intersects the liquidus at a composition of 72% CaAl2Si2O8. This is the melt composition at 1,450 oC. And we can divide that horizontal line into two segments – one from the liquidus to the original melt composition – from 72% to 80%. The other goes from the original melt composition to the right side of the diagram (80% to 100%). These lengths are proportional to the amount of anorthite and melt present at 1,450 oC. The sum of the two lengths is 28%. 8/28 is 28.6% and 20/28 is 71.4%, so we have 28.6% anorthite crystals and 71.4% melt. We call this calculation the lever rule. To some people, the rule seems backwards because the line segment closest to the melt field is proportional to the amount of anorthite present. And the line segment closest to anorthite composition is proportional to the amount of melt present. If you look at Figure 8.19 for a while, you will see why this is the case.
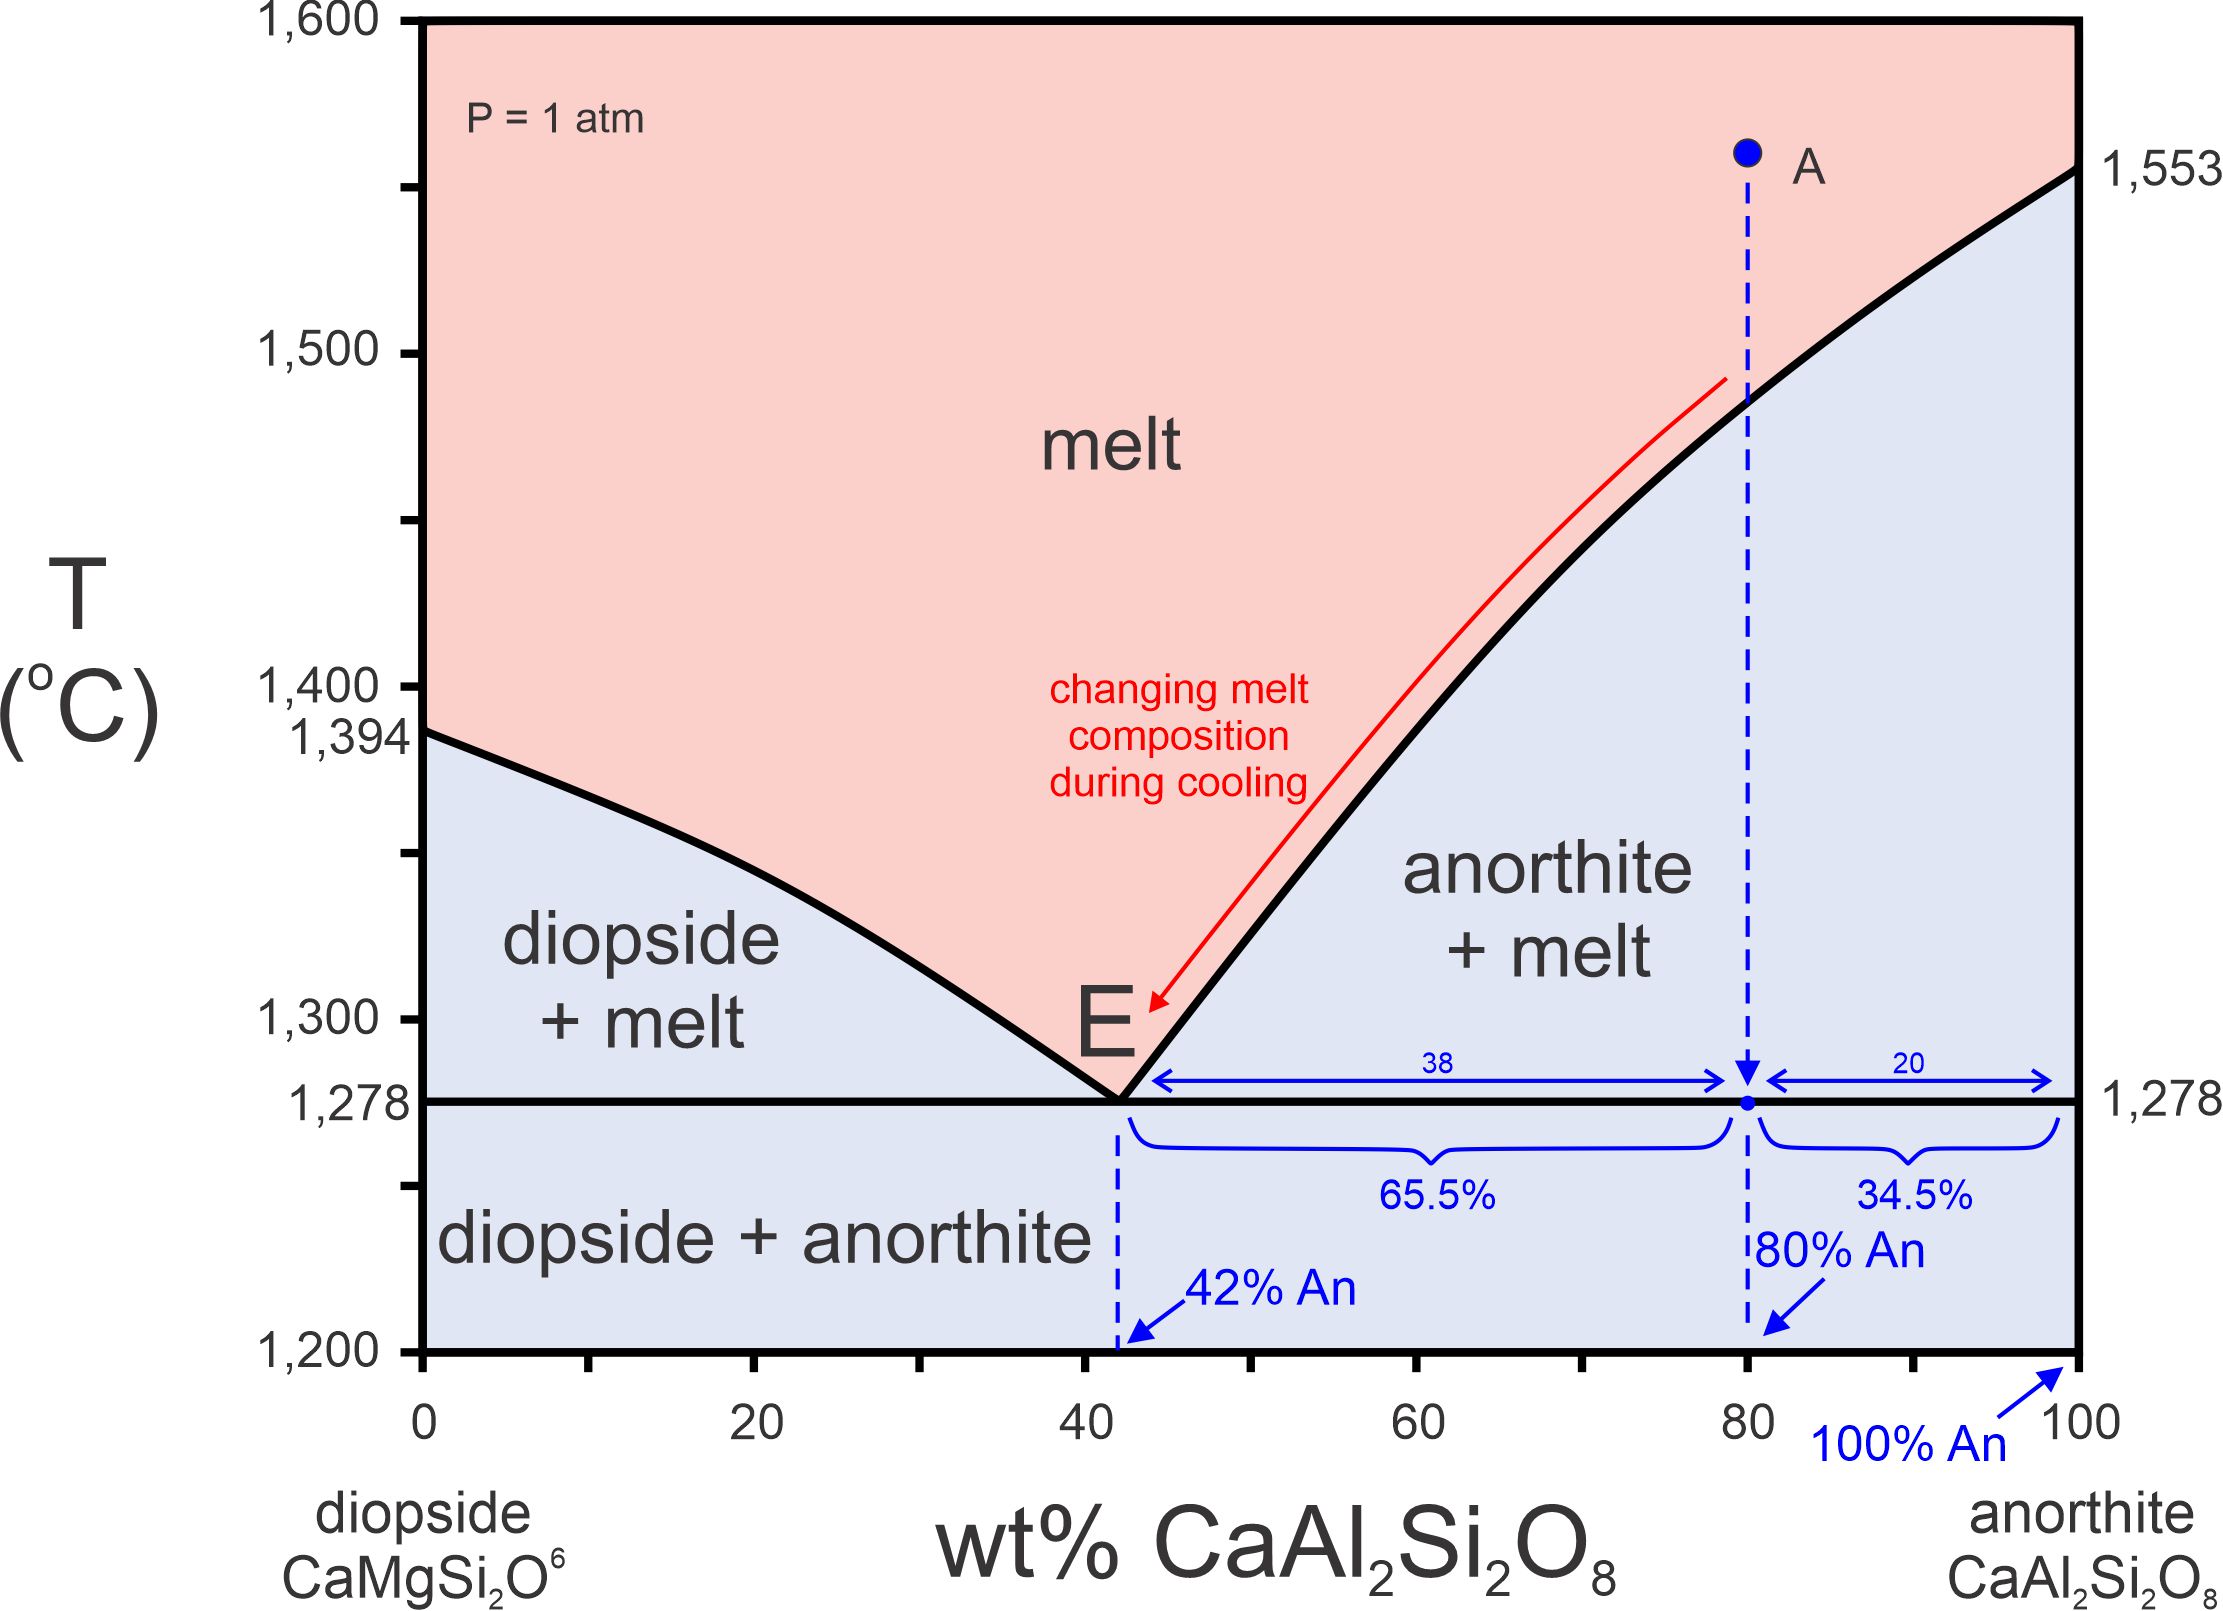
Note that with cooling, melt composition follows the liquidus, eventually reaching the eutectic (red arrow in Figure 8.20). As this occurs, the length of the line segment representing the amount of anorthite present increases as anorthite crystallizes. When the temperature finally reaches the eutectic at 1,278 oC (Figure 8.20), the small amount of remaining melt will have the eutectic composition. We can apply the lever rule using the line segments from the eutectic to the original melt composition (An42 to An80) and from the original melt composition (An80 to An100) to the right side of the diagram. These two line segments are 38% and 20%, totaling 58%. 20/58 = 34.5%, so about 34.5% of the original melt will remain just as temperature reaches the eutectic. About 2/3 (38/58 = 65.5%) of the melt will have crystallized to anorthite. With just a bit more cooling – when temperature drops below the eutectic – the entire melt will crystallize to 80% anorthite and 20% diopside.
8.3.2 Binary Eutectics and Melting

So far, we have talked about eutectic systems and crystallization. What about melting? Figure 8.21 is a phase diagram for the SiO2-CaAl2Si2O8 system. Consider a rock containing 34% anorthite crystals and 66% quartz crystals. When heated, the quartz will turn into tridymite at 870 oC (off scale and below the temperatures shown in Figure 8.21). The rock will begin to melt at 1,370 oC (point A), the eutectic temperature. The melt will be the eutectic composition, about 51% anorthite. At the eutectic temperature, melting will continue until all the anorthite is gone – then temperature can increase. From point A to point B, tridymite and melt will coexist, and then at 1,471 oC, the tridymite will turn into cristobalite. When the temperature reaches 1,569 oC (point C), temperature will not increase until the rock is entirely molten. In the 199 oC between points A and C, an SiO2 mineral (tridymite or cristobalite) will coexist with melt. And at temperatures above 1,569 oC, we will have a melt that is equal in composition to the starting rock. So, during melting, melt composition follows the curves from the eutectic (E) to point C.
8.3.2.1 Why Is Eutectic Melting Important?
Why are eutectic diagrams important? Mostly, because they tell us two important things. First, that minerals together often melt at lower temperature than they would individually. The example we just discussed only included two minerals, but many igneous rocks include more, and every additional mineral can lower melting temperature. Figure 8.1 in this chapter shows melting temperatures for some important igneous minerals. Most melt at 1,500 to 2,000 oC. But, because of eutectic melting, temperatures need not get so high to create magmas. Consequently, eutectic melting means that igneous activity is much more common than it would be otherwise. For example, dry granitic magmas have temperatures around 1,100 oC and basaltic magmas have temperature a bit hotter, but individually the minerals in granite and basalt melt at much higher temperatures.
A second, and closely related, lesson from eutectic diagrams is that magmas may cool to relatively low temperatures before crystallizing. A melt that is 100% CaMgSi2O6 will crystallize to 100% diopside at 1,394 oC, and a melt that is 100% CaAl2Si2O8 will crystallize to 100% anorthite at 1,553 oC (Figure 8.20). But when a melt contains both components, crystallization will begin at lower temperature and will not be over until the melt cools to the eutectic temperature at 1,278 oC.
The third, and maybe most important, take-away from eutectic diagrams is that melts and coexisting rocks may have different compositions. If a magma partially crystallizes to rock, and the remaining melt gets separated from the rock, it creates a new melt of a different composition. Similarly, if a rock partially melts, and the magma gets separated from the crystals, we also get a melt of different composition. In either case, we get derived melts that will move upwards in Earth and contribute to Earth’s differentiation as they leave high-temperature minerals and rocks behind. We talked about derived melts previously in Chapter 3 (Section 3.6.6).
● Box 8.1 Slippery Sidewalks in the Winter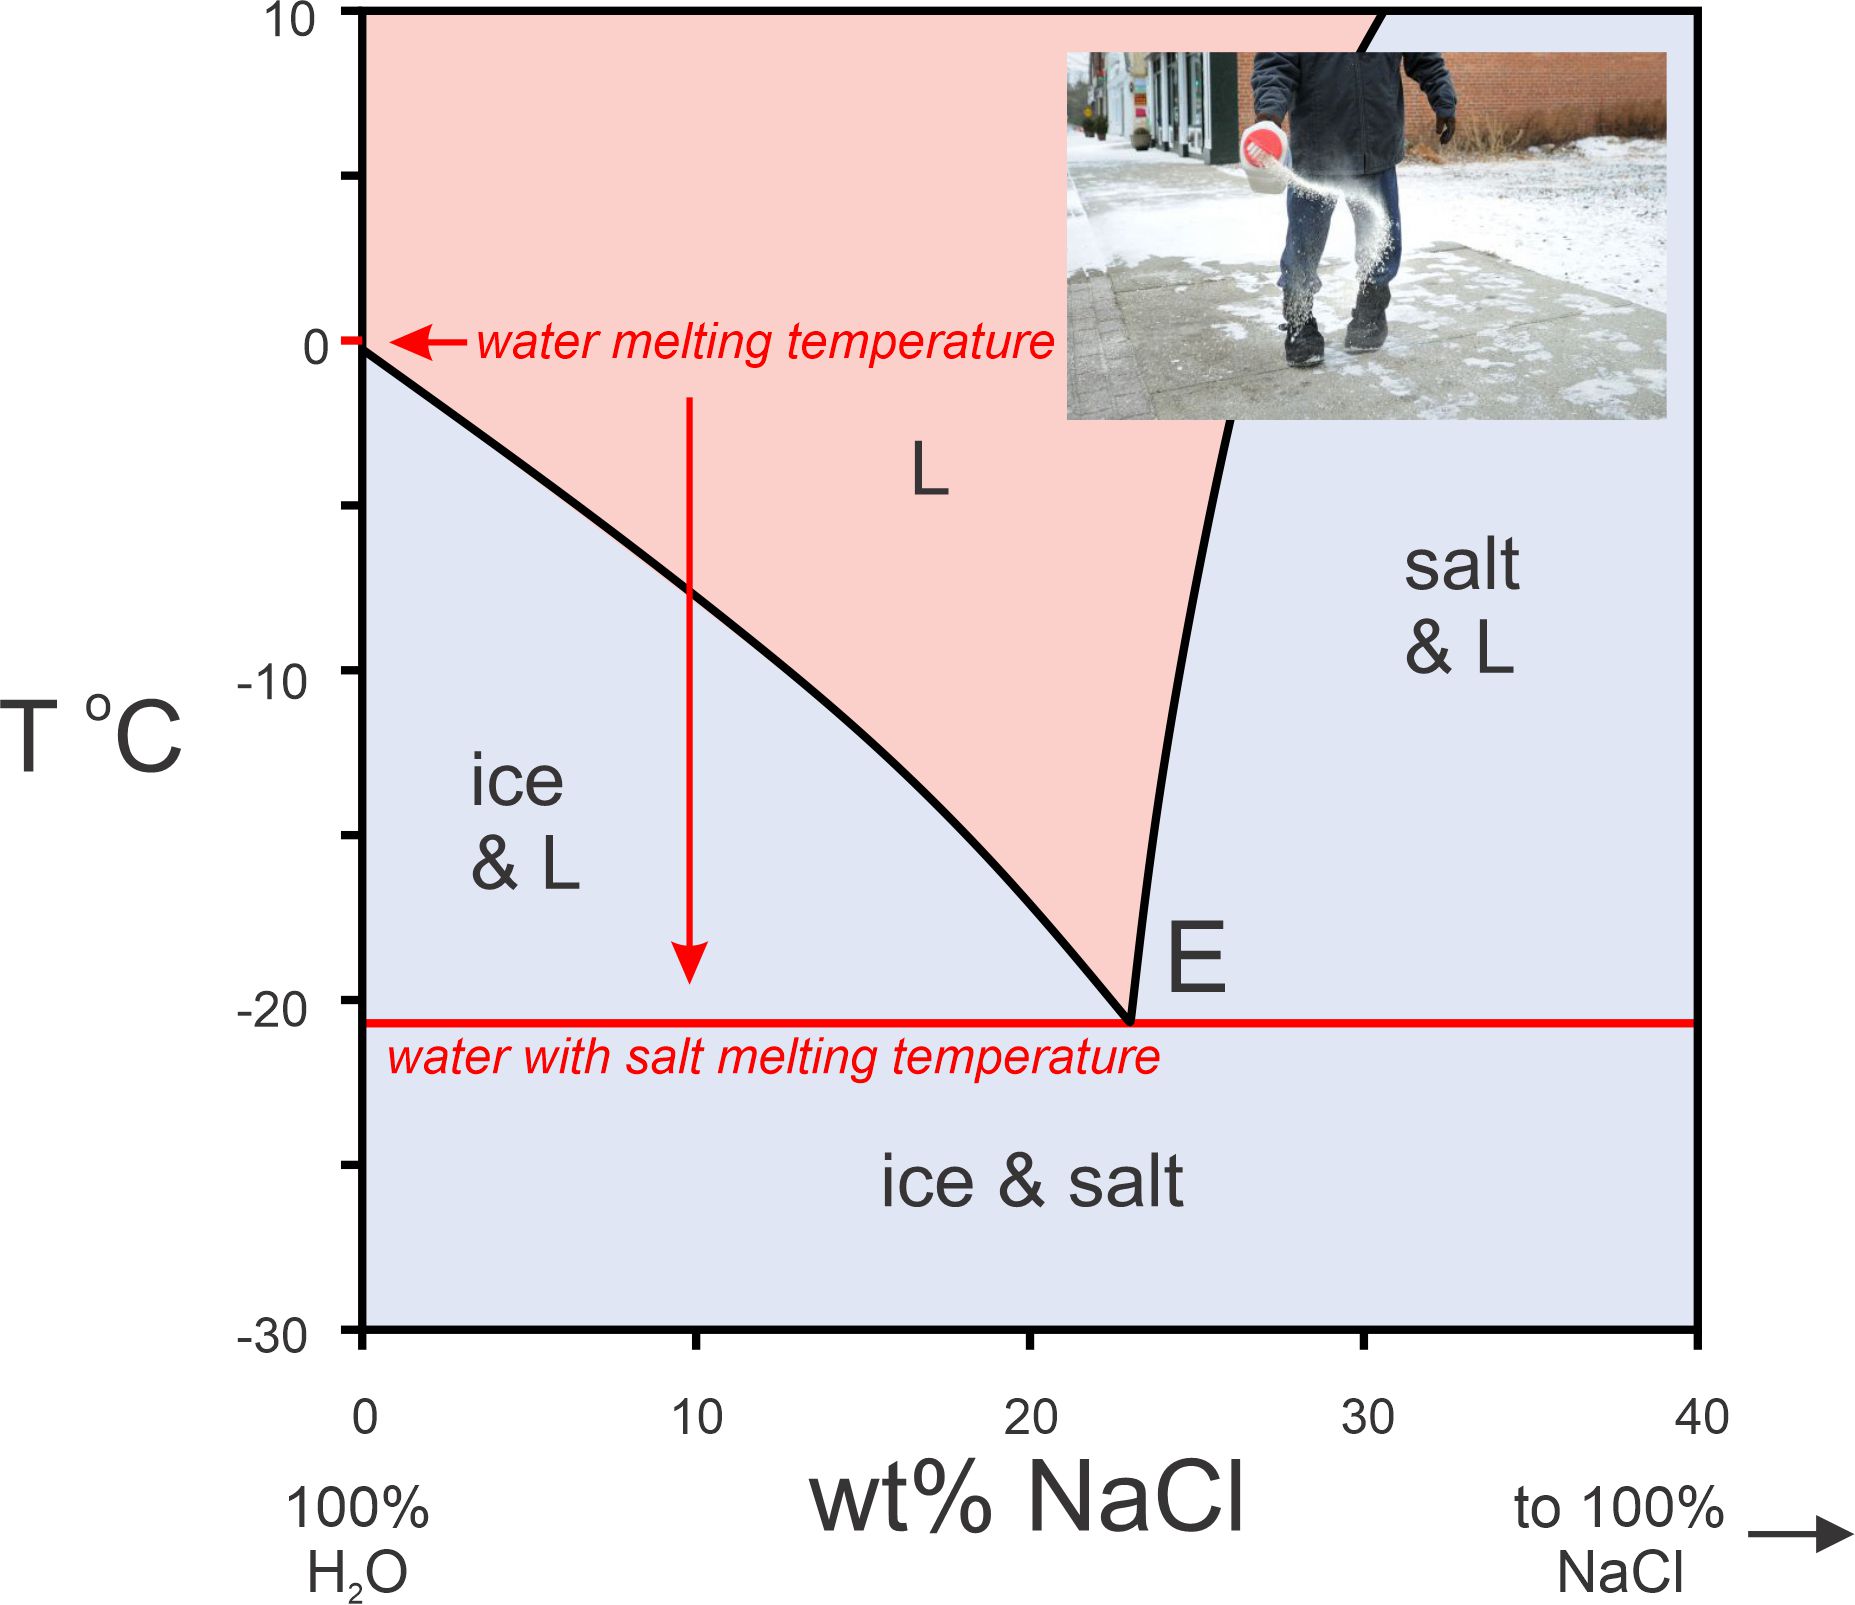 Eutectic melting also has one very common practical application. We put salt on ice to make it melt during the winter. As seen in Figure 8.22, ice and salt melt at about 20 oC lower temperature than ice would normally. The salt trick works because salty water has a lower freezing point than pure water. The higher the concentration of dissolved salt, the lower its overall freezing temperature. But there is a limit to the amount of salt that can dissolve in water. Water containing the most salt possible has a freezing point just below -20 oC. Consequently, if the temperature is really cold, below -20 oC (0 oF), putting salt on roads or sidewalks accomplishes nothing. |
8.3.3 Incongruent Melting
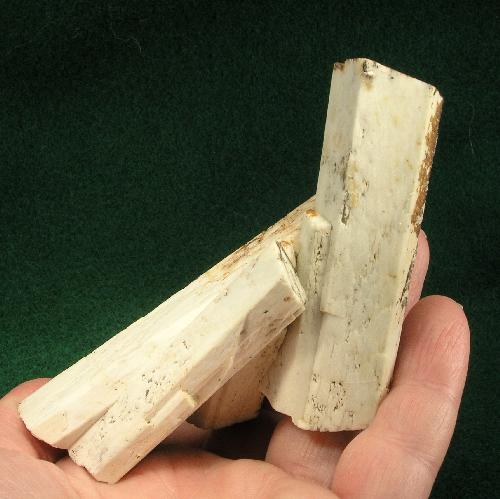
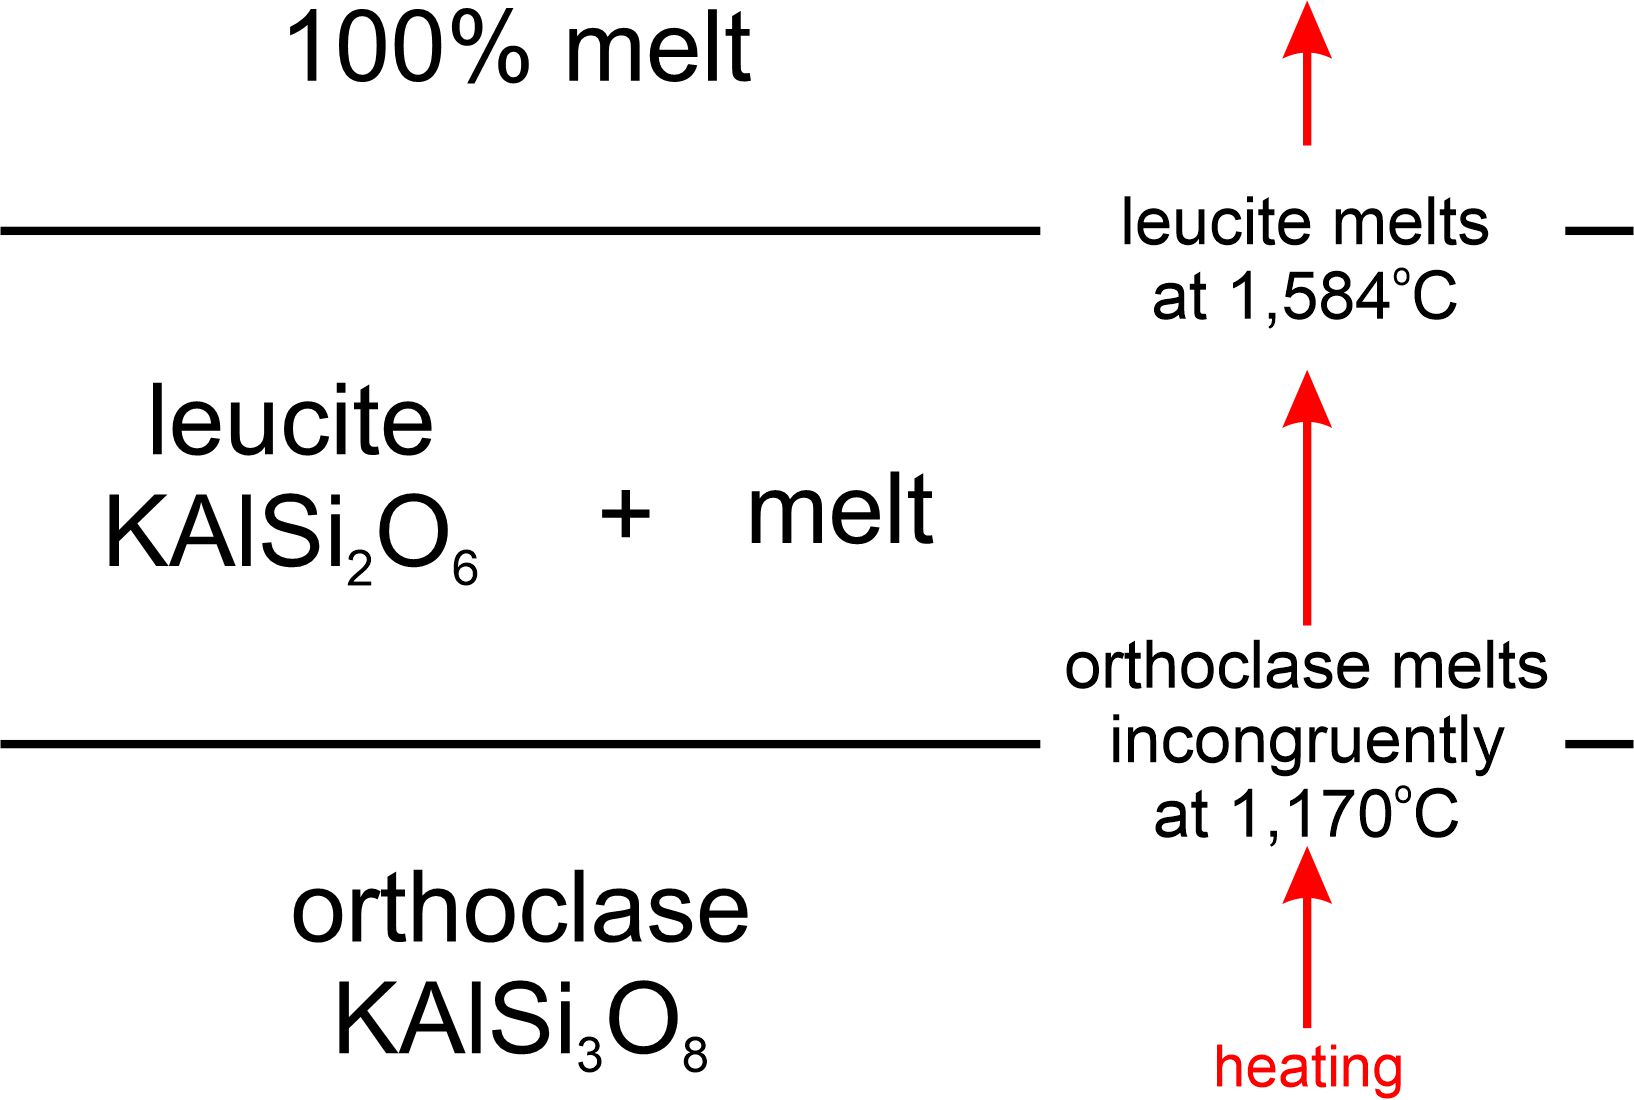
The photo below in Figure 8.23 shows some classic orthoclase crystals from Namibia. Orthoclase (KAlSi3O8), a potassium feldspar, is one of many minerals that melts incongruently. This means that when orthoclase melts, the first melt produced is not the same composition as orthoclase. Consequently, a different mineral is left behind. For orthoclase, that different mineral is leucite (KAlSi2O6). Suppose we heat orthoclase at 1 atmosphere pressure. As depicted in Figure 8.24, orthoclase will melt at 1,170 oC, and be replaced by solid leucite (which has composition equivalent to orthoclase with some silica removed) and a melt that has composition equivalent to orthoclase plus extra silica. Above 1,170 oC, no orthoclase will remain. When the temperature reaches 1,584 oC, all the leucite will melt too, producing a melt of orthoclase composition. So, there is a span of 414 oC where only partial melting has occurred. (Incongruent melting of orthoclase, however, takes place for rocks that contain no, or very small amounts of H2O. If significant H2O is present – as it is in many rocks – orthoclase melts congruently.)
|
|
|
● Box 8.2 Kids and Incongruent Melting Kids, like the kids in Figure 8.25, have great experience with incongruent melting. If you were ever a kid, I bet you did. When kids suck on a popsicle, all the colored sugary syrup comes out first. It tastes sweet and dyes their lips and tongue bright colors. Eventually, the popsicle that remains is white tasteless ice. All the good stuff comes out first, leaving nothing but boring ice behind. Popsicles behave as they do because frozen sugar-rich water melts incongruently to form sugar syrup and sugar-free ice. The converse is also true. Sugary water freezes at a lower temperature than pure water. So, if you freeze a can of pop, you initially get sugar-free ice forming, leaving a concentrated drink behind. If you wait longer or if you lower the temperature, eventually all the liquid will freeze. But your original homogenous pop will now be two different composition frozen substances. |
8.3.3.1 The Leucite-Quartz System
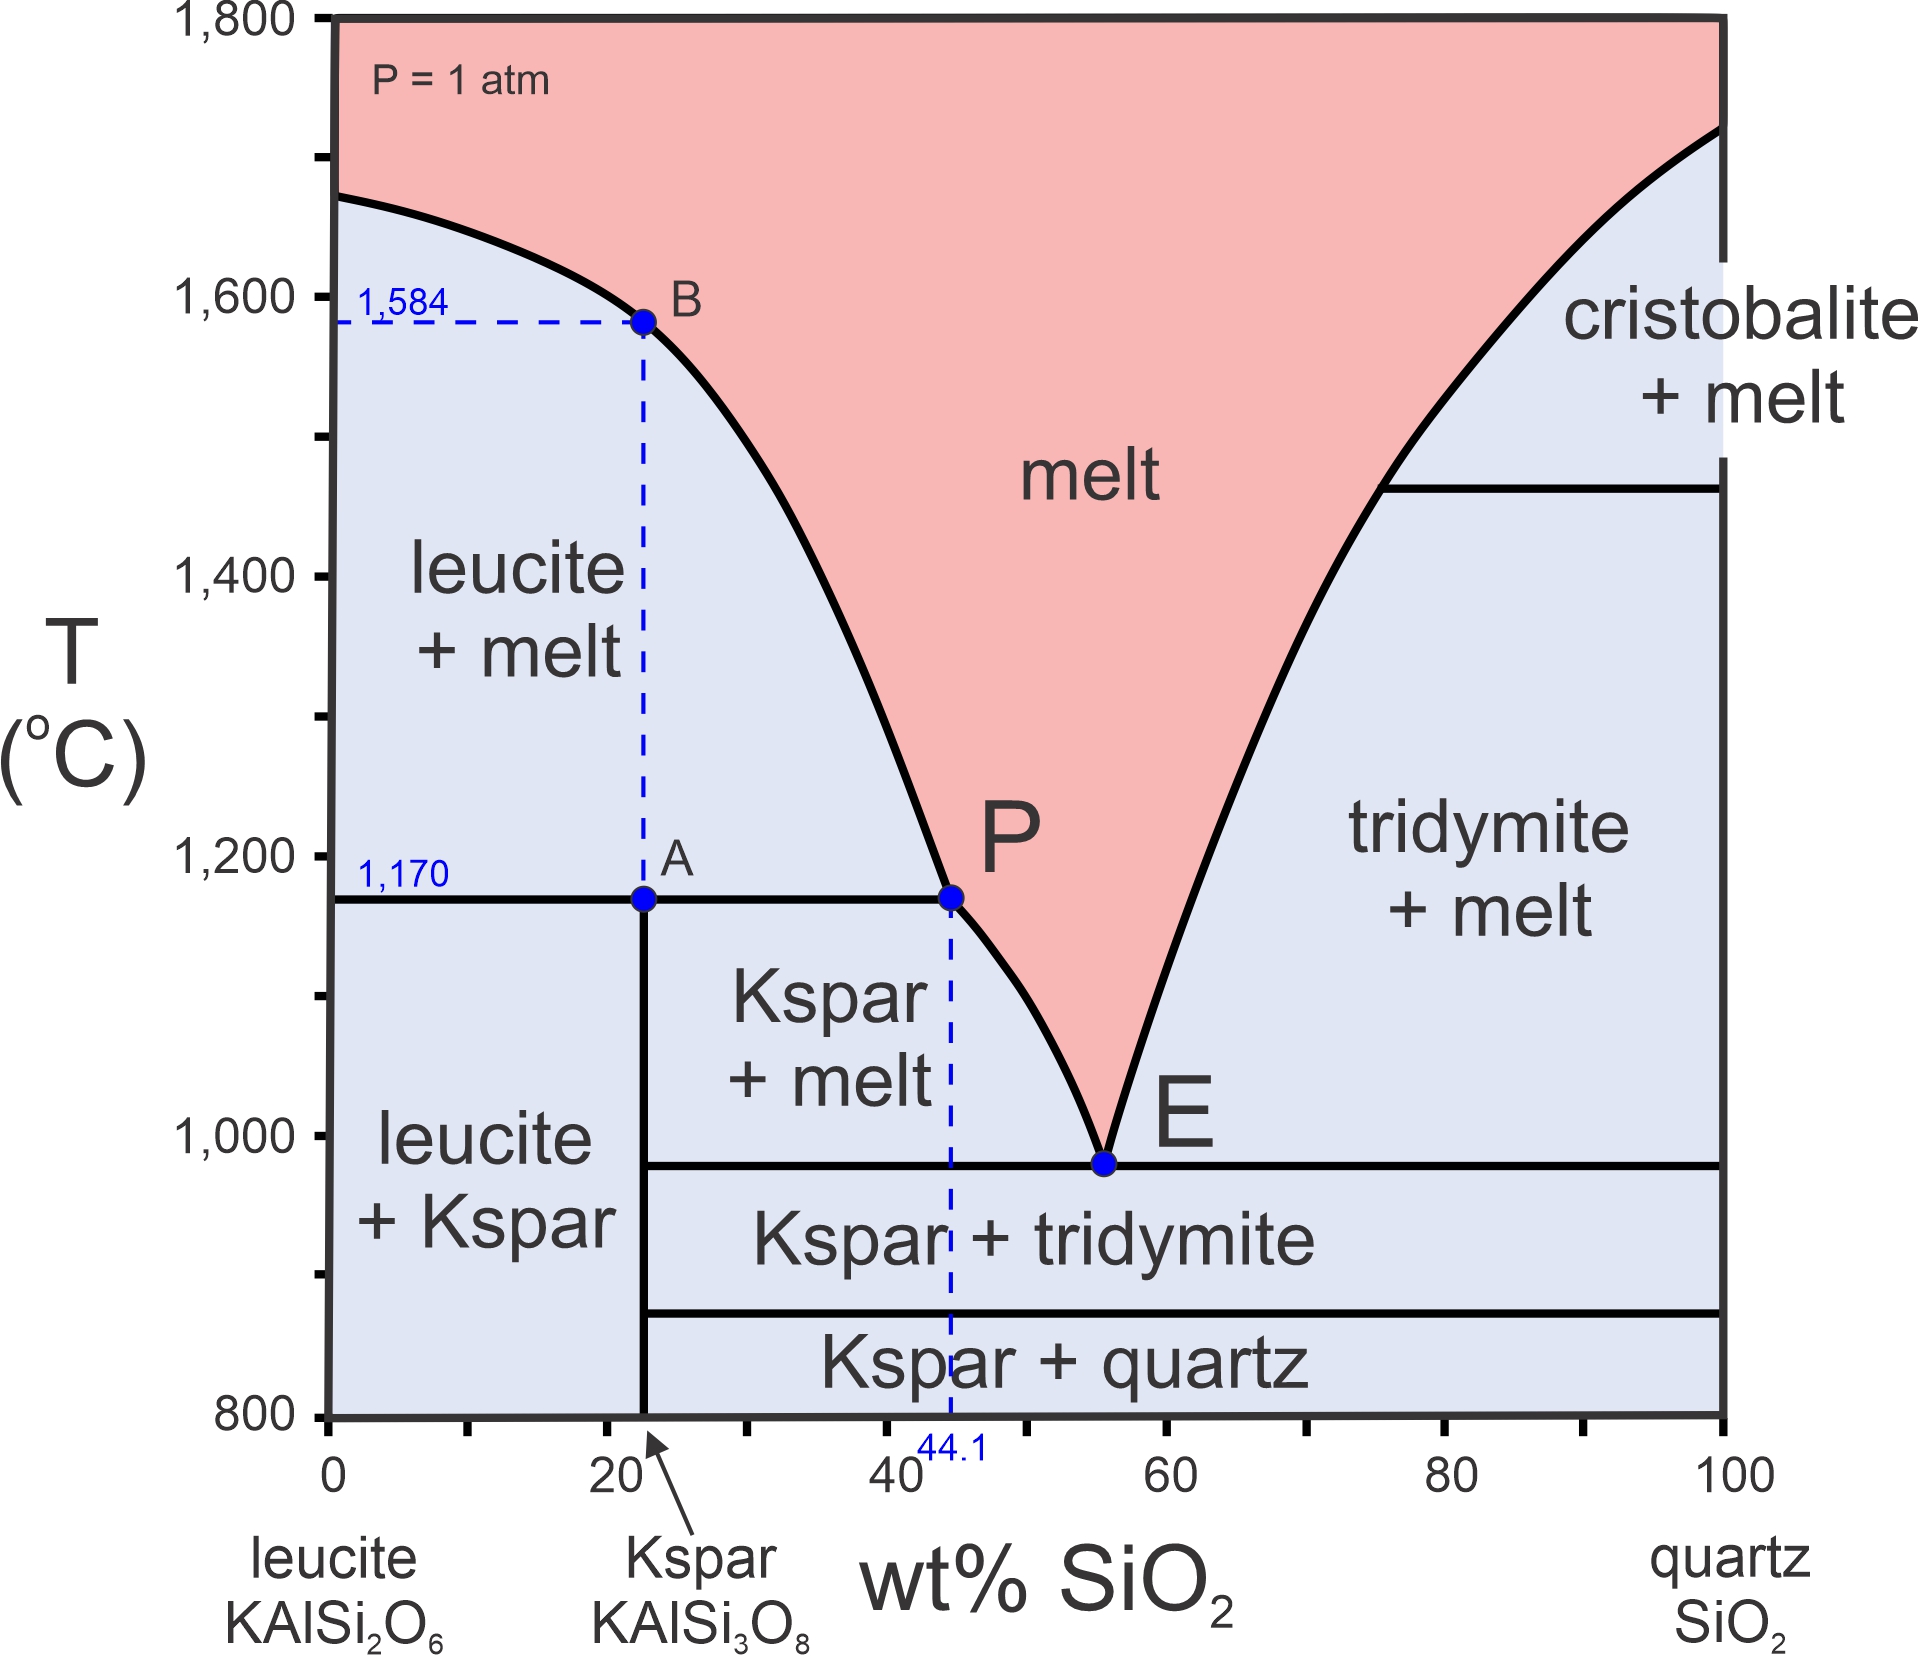
Figure 8.26 is a phase diagram for the KAlSi2O6-SiO2 system at 1 atmosphere. The liquidus curves, that make up the bottom of the red field, separate the region where all is melted, from fields of partial melt. This diagram contains a eutectic (point E) at just under 1,000 oC; no melt can exist below this eutectic temperature. Total crystallization is certain for all compositions at temperatures below the eutectic temperature. This diagram, however, has some added complications because it includes the incongruent melting of K-feldspar just described.
Follow a line up from the K-feldspar composition (78.4% KAlSi2O6 and 21.6% silica). Melting begins at 1,170 oC (point A) when K-feldspar melts to yield leucite and a melt that is about 44.1% silica (shown by point P). With further heating, leucite dissolves in the melt, and the melt composition migrates from point P (44.1% silica) to point B along the liquidus curve. At 1,584 oC (point B), all the leucite becomes part of the melt, and the melt has composition equivalent to K-feldspar, the starting composition. Point P, at 1,170 oC and composition 44.1% SiO2-55.9% KAlSi2O6, is called the peritectic. 1,170 oC is the peritectic temperature. Peritectics typify any phase diagram that involves incongruent melting. They always create a bump in the liquidus curve as seen in Figure 8.26 (at the peritectic point).
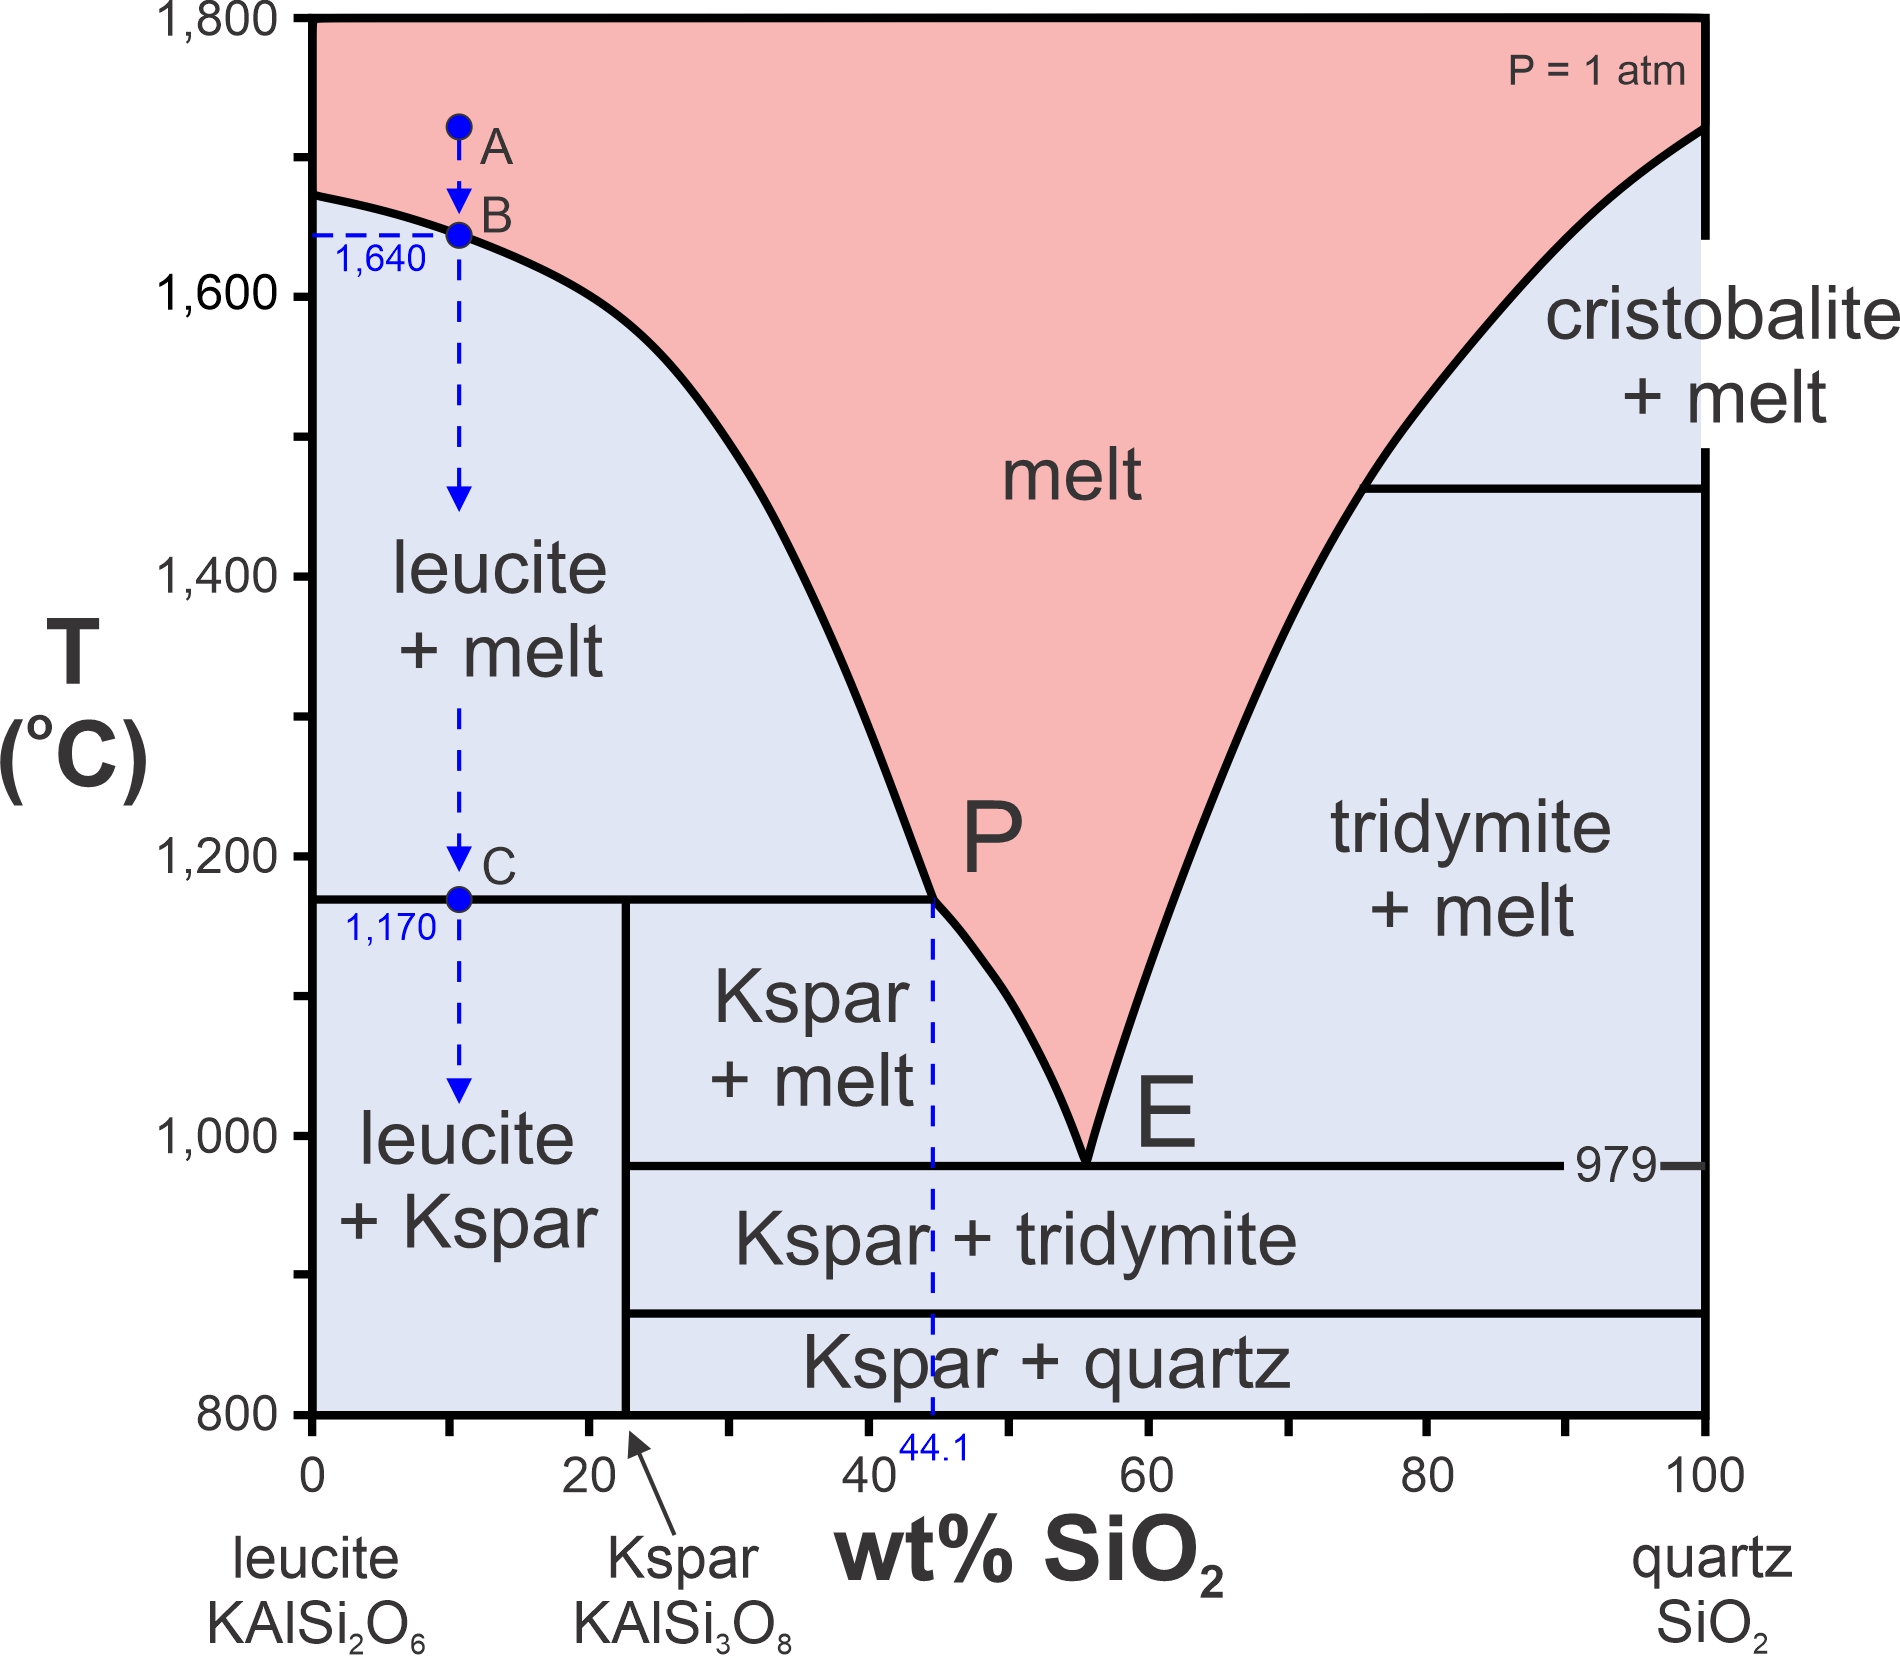
What about crystallization instead of melting? Consider a melt with composition equivalent to 89% leucite and 11% quartz at a temperature above the liquidus (point A in Figure 8.27). To see what happens during cooling, we drop a vertical arrow at this composition. Crystallization will begin when leucite crystals form at 1,640 oC (point B). More leucite will form as temperature drops to point C, the peritectic temperature, at 1,170 oC. As the melt disappears, its composition will follow the liquidus curve from point B to the peritectic (P). Below 1,170 oC, the melt-crystal mix enters the leucite + K-feldspar field. This means that all remaining melt will crystallize to form leucite and K-feldspar. Thus, no melt will remain below the peritectic temperature. Figure 8.27 contains a eutectic (point E at 979 oC), but for the composition just considered (89% leucite and 11% quartz), melt composition never gets to the eutectic.
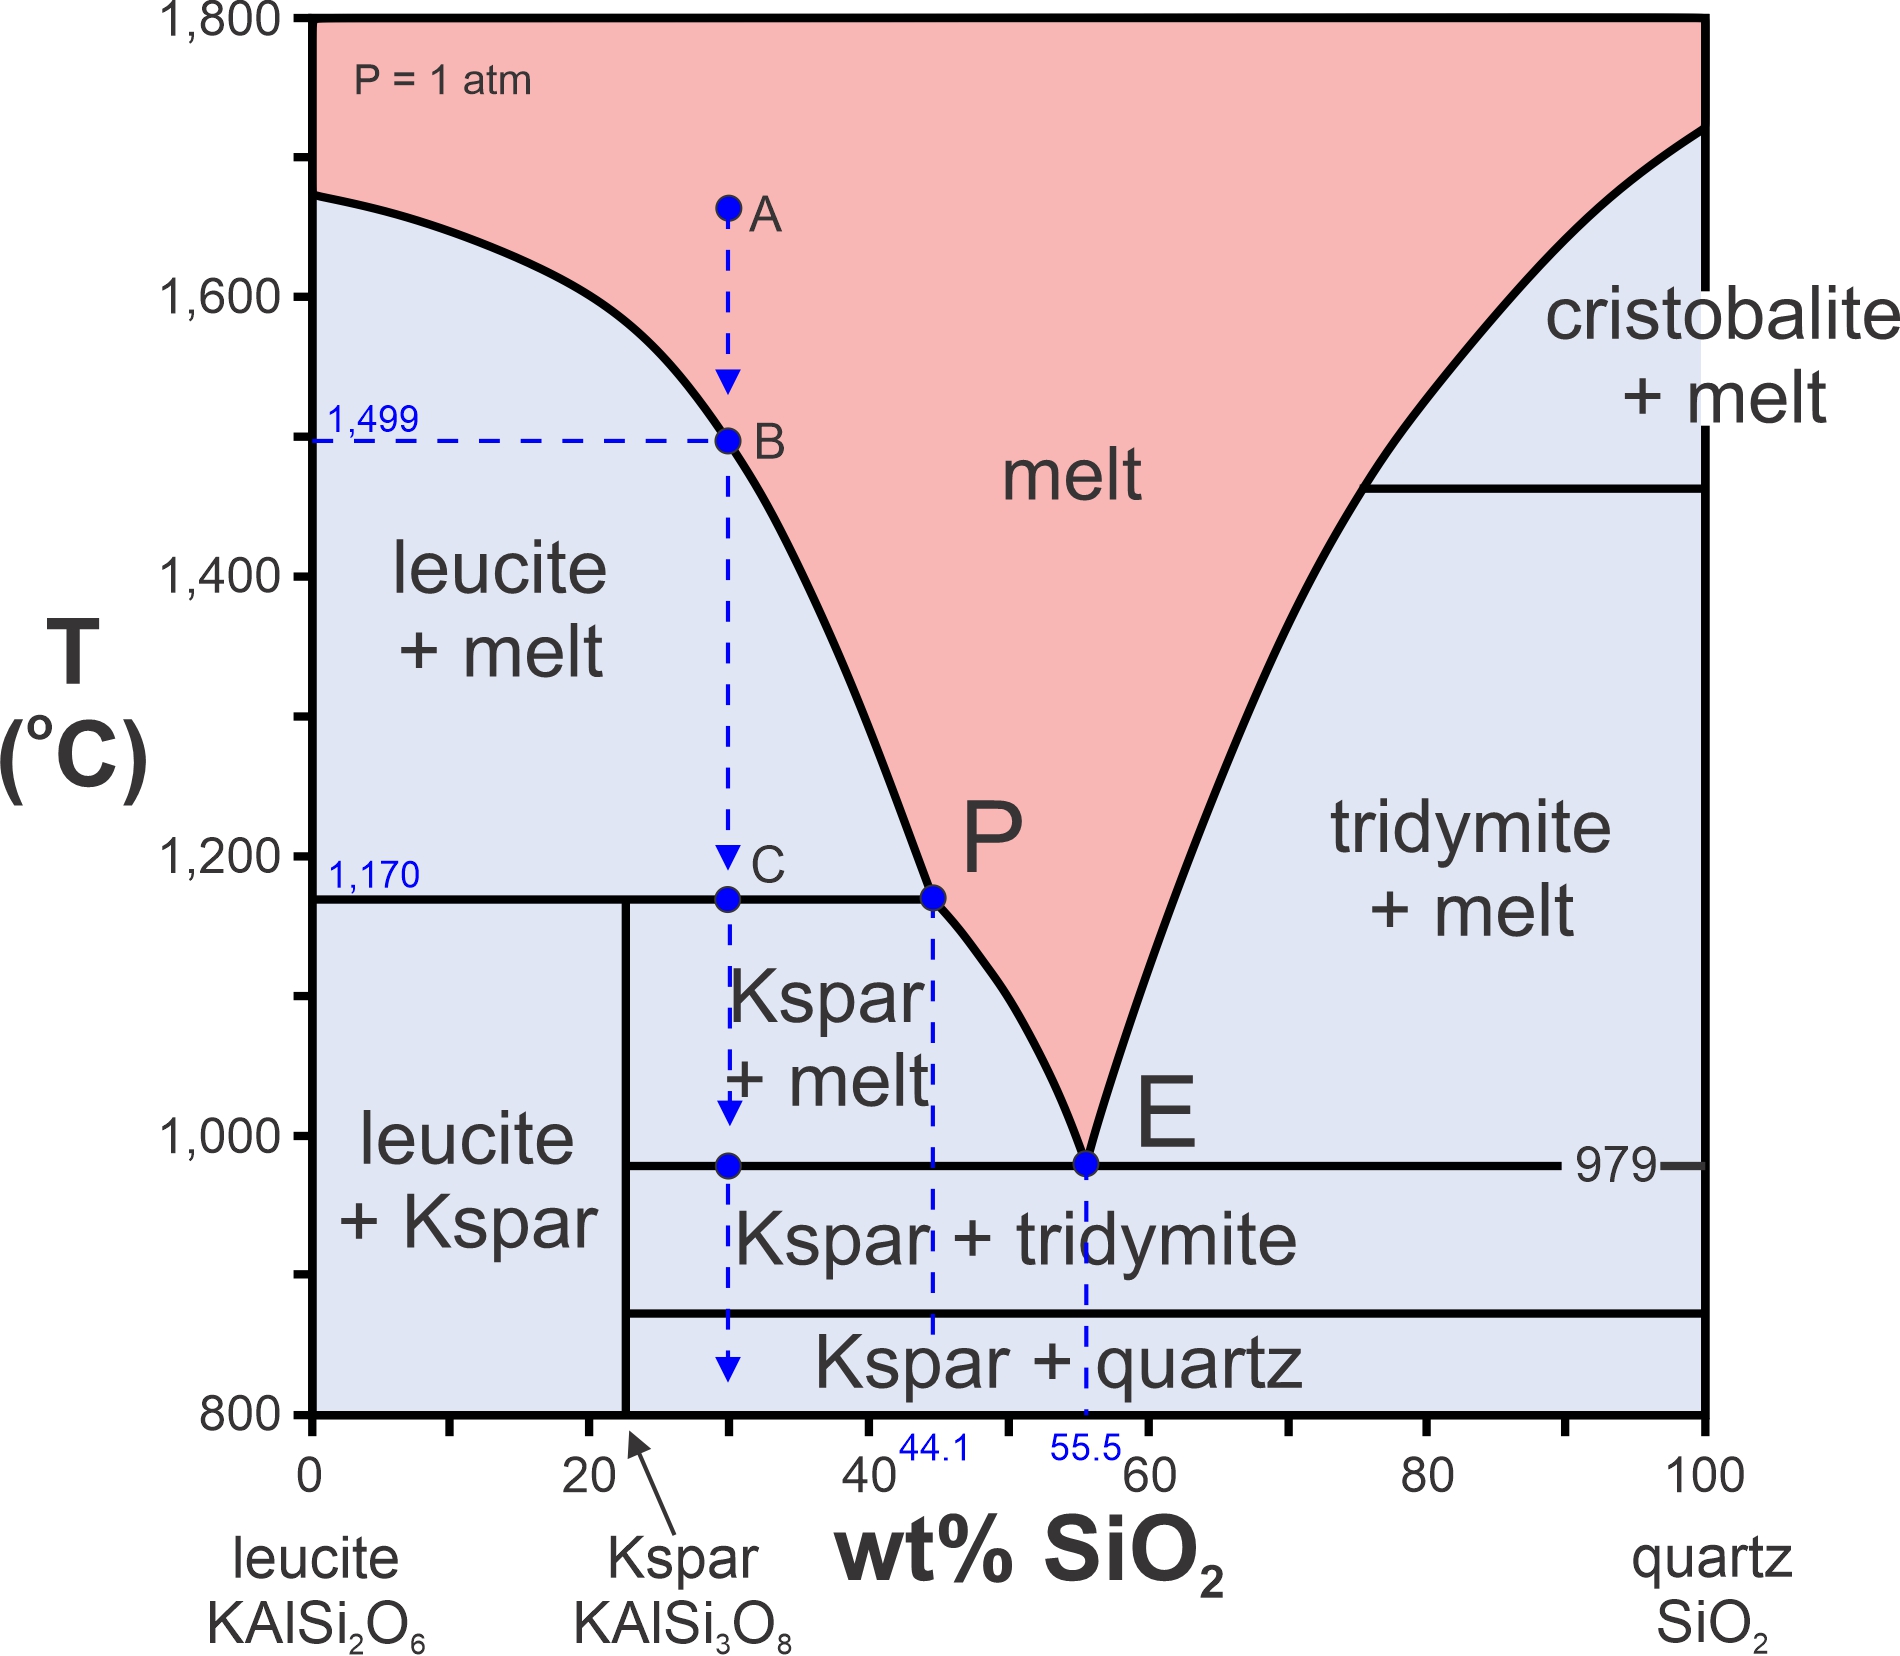
Now, let’s consider a melt containing more silica than the last one – a melt with composition equivalent to 30% silica and 70% leucite (Figure 8.28). If it cools from point A, crystallization will begin at 1,499 oC, point B. Cooling continues to the peritectic temperature at point C. Leucite continues to form. So, as before, melt composition follows the liquidus to the peritectic (P) at 1,170 oC. When it gets there, its composition is 44.1% silica.
But, at the peritectic, a curious thing happens. When temperature drops below the peritectic temperature, all the leucite crystals will dissolve back into the melt and be replaced by K-feldspar. We can see this because our vertical arrow enters the K-feldspar plus melt field. With more cooling, more K-feldspar will crystallize until temperature reaches 979 oC, which is the eutectic temperature. At that temperature, the very last drop of melt will have the eutectic composition, 55.5% silica. Before temperature drops below the eutectic, tridymite will crystallize along with K-feldspar until all melt is gone. Tridymite and K-feldspar will be present. With even more cooling, the tridymite will eventually turn into quartz.
8.3.3.2 The Forsterite-Quartz System
The phase diagram in Figure 8.29 is another example that contains both a peritectic and a eutectic. This diagram, for the Mg2SiO4-SiO2 system, includes the minerals forsterite and enstatite, and two different silica polymorphs, cristobalite and tridymite. If the temperature scale extended lower, quartz would be on the diagram too. (The horizontal axis in this figure only extends to 50% SiO2; there are complications for more silica-rich compositions that we will talk more about later.)
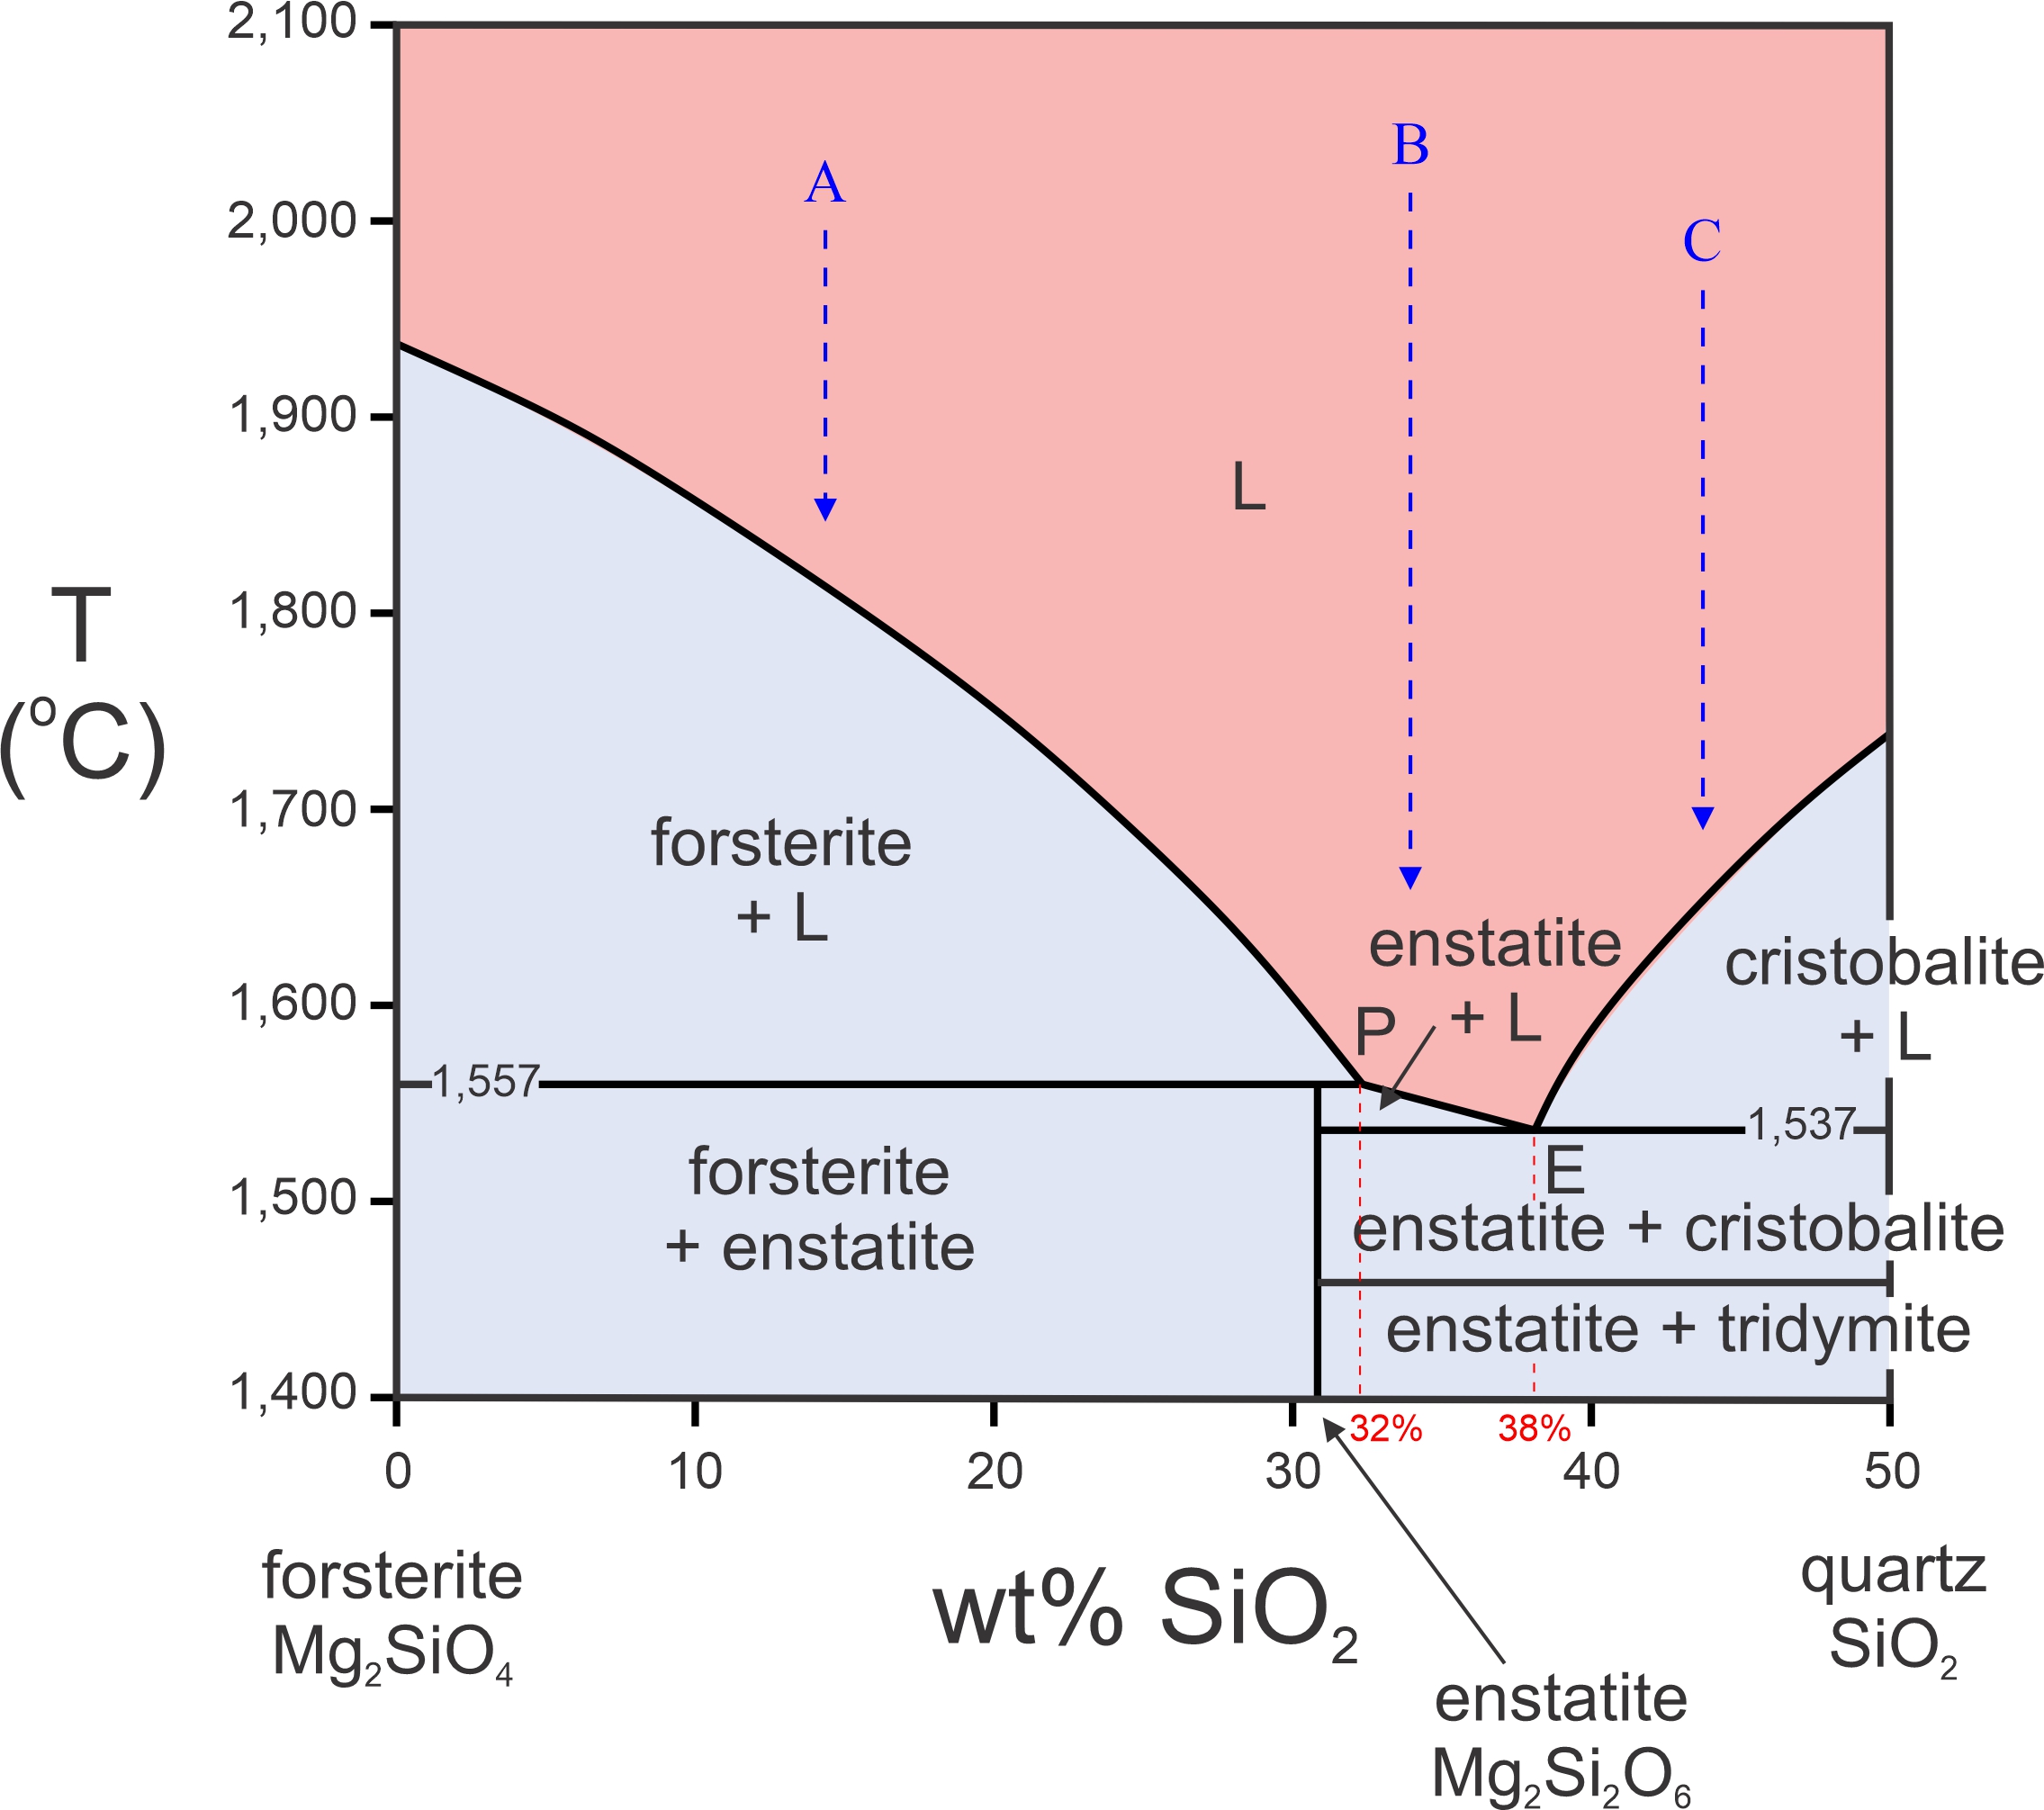
Figure 8.29 includes a peritectic because enstatite melts incongruently to forsterite plus a melt of different composition at 1,557 oC. The eutectic point (E) is close to the peritectic point (P), and at 20o lower temperature. The peritectic composition is 32% SiO2 and 68% Mg2SiO4 (Fo68Qz32). The eutectic composition is 38% SiO2 and 62% Mg2SiO4 (Fo68Qz32).
If an Mg2SiO4-rich melt cools, forsterite will crystallize first. Composition A is an example. Forsterite crystallization will begin around 1,800 oC for this composition. Below that temperature, composition A enters the forsterite + L field. So, forsterite will continue to crystallize until the temperature drops to 1,557 oC, the peritectic temperature. While this is happening, the melt will follow the liquidus curve until it reaches the peritectic composition, 32% SiO2. When temperature drops below the peritectic temperature, composition A enters the forsterite + enstatite field. So, all the remaining melt will crystallize, and enstatite crystals will join the forsterite. We will have a rock containing forsterite phenocrysts surrounded by anhedral enstatite crystals.
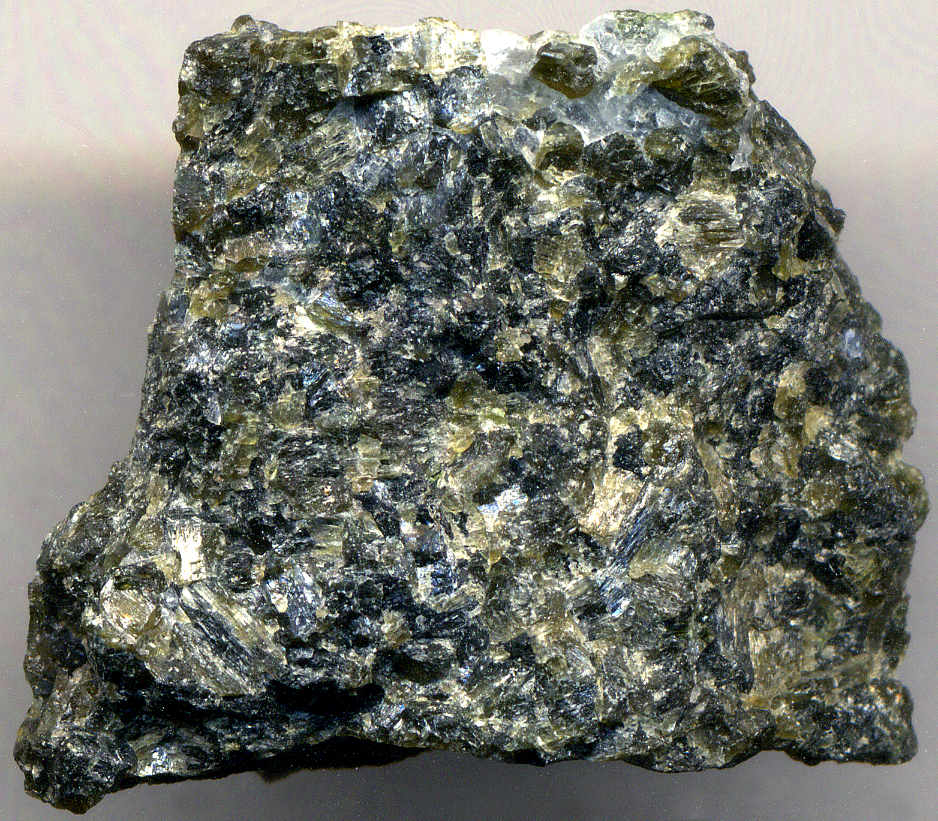
Figure 8.30 is a photo of a harzburgite, a rock that contains mostly olivine with lesser amounts of orthopyroxene. This is equivalent to the forsterite-enstatite rocks with composition A in Figure 8.29, except that the forsterite (olivine) and enstatite (orthopyroxene) contain some iron and other minor elements in natural rocks.
A melt with composition more silica-rich than the peritectic – such as composition B in Figure 8.29 – behaves differently. With cooling, melt B passes from the liquid field to the enstatite + liquid field, to the enstatite + cristobalite field, and then to the enstatite + tridymite field. So, for this composition, enstatite will crystallize first, starting when the temperature reaches the liquidus. With a bit more cooling, the temperature will reach the eutectic, 1,543 oC, and cristobalite will form. Below the eutectic, all melt will be gone and only enstatite + cristobalite will be present. With more cooling, the cristobalite will turn into tridymite at 1,470 oC. Although not shown on this diagram, with more cooling, quartz will replace tridymite.
Melts with compositions to the right of the eutectic will behave still differently. A melt of composition C (Figure 8.29) will begin crystallizing at 1,660 oC or so. Like composition B, it will also reach the eutectic temperature before it completely solidifies. But, for this composition, cristobalite will crystallize first followed by enstatite at the eutectic temperature, 1,543 oC.
8.3.3.3 Plagioclase Melting and Crystallization
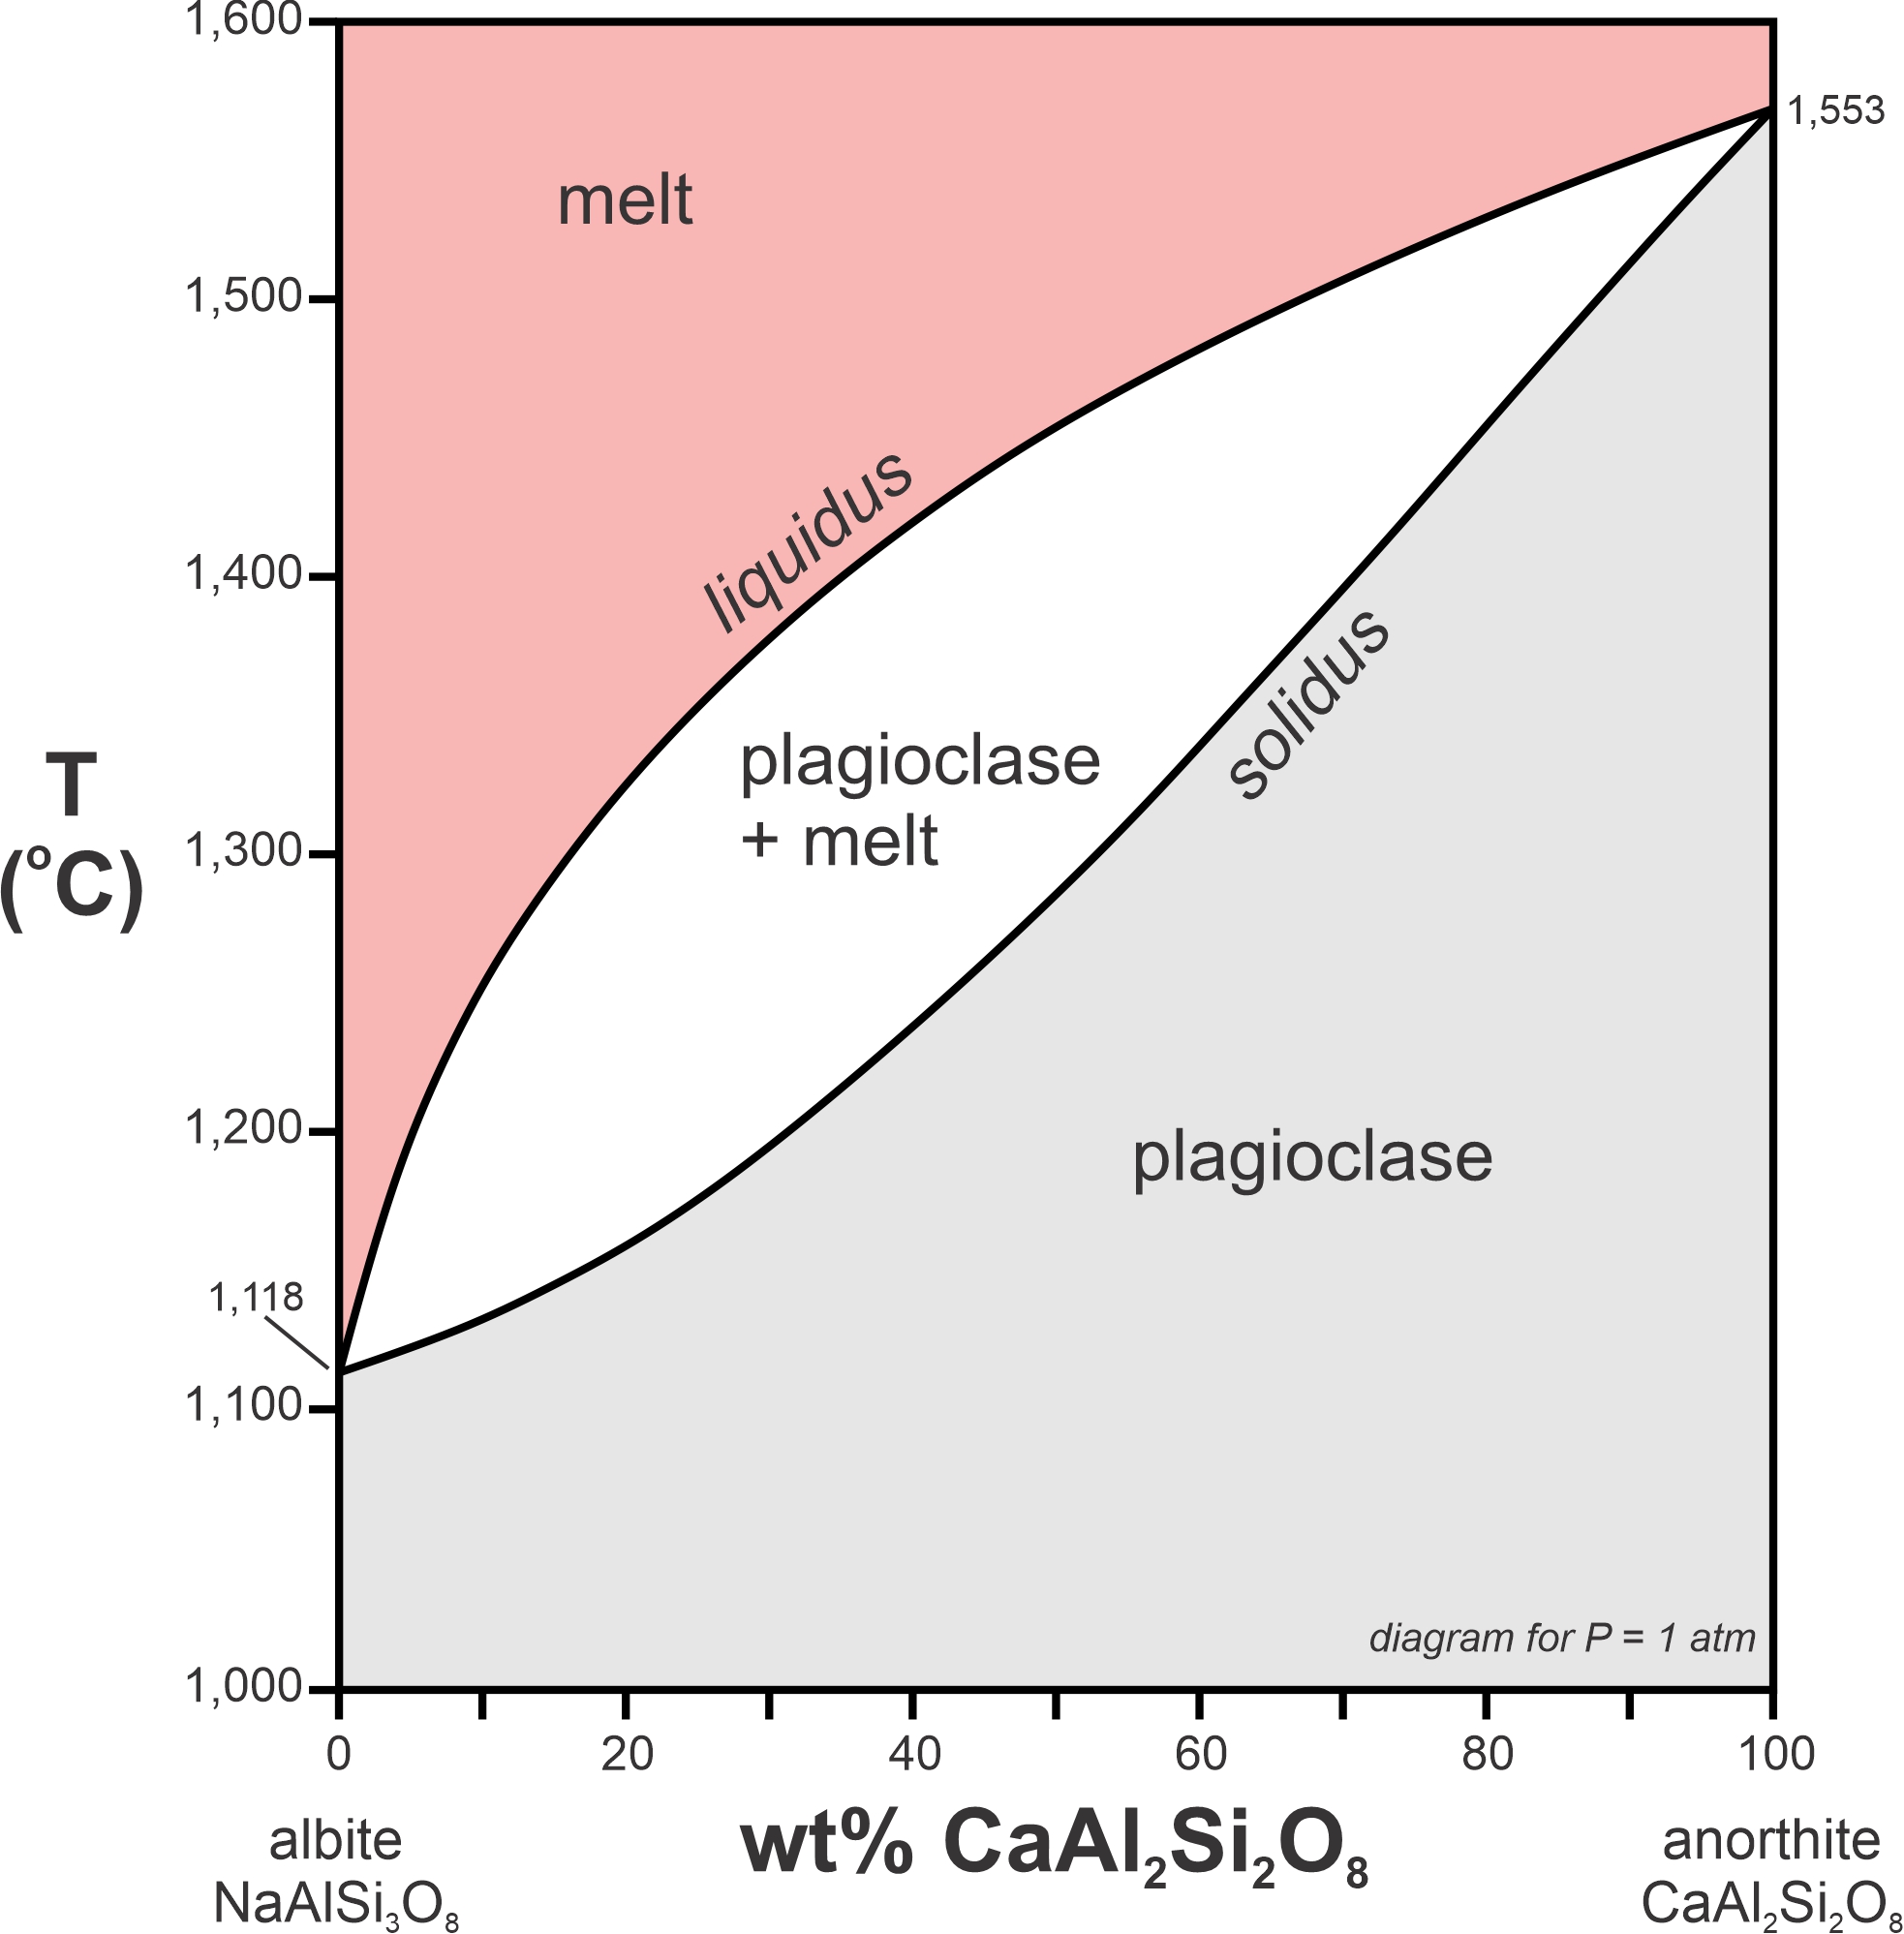
The phase diagram in Figure 8.31 depicts melting relationships for plagioclase at 1 atm pressure. This system displays another kind of incongruent melting. End-member albite (NaAlSi3O8) melts congruently at 1,118 oC. End-member anorthite (CaAl2Si2O8) melts congruently at 1,553 oC. But plagioclase compositions between albite and anorthite melt incongruently. The diagram includes both a liquidus and a solidus curve. Above the liquidus, all is melted. Below the solidus, all is crystalline plagioclase. Between the two, in a two-phase field, plagioclase and melt exist together.
Consider a plagioclase crystal that has composition An57Ab43 (Figure 8.32). Its solidus temperature is 1,321 oC and its liquidus temperature is 1,478 oC. Between 1,321 oC and 1,478 oC, a melt and plagioclase will exist together. So, partial melting takes place over this temperature range.
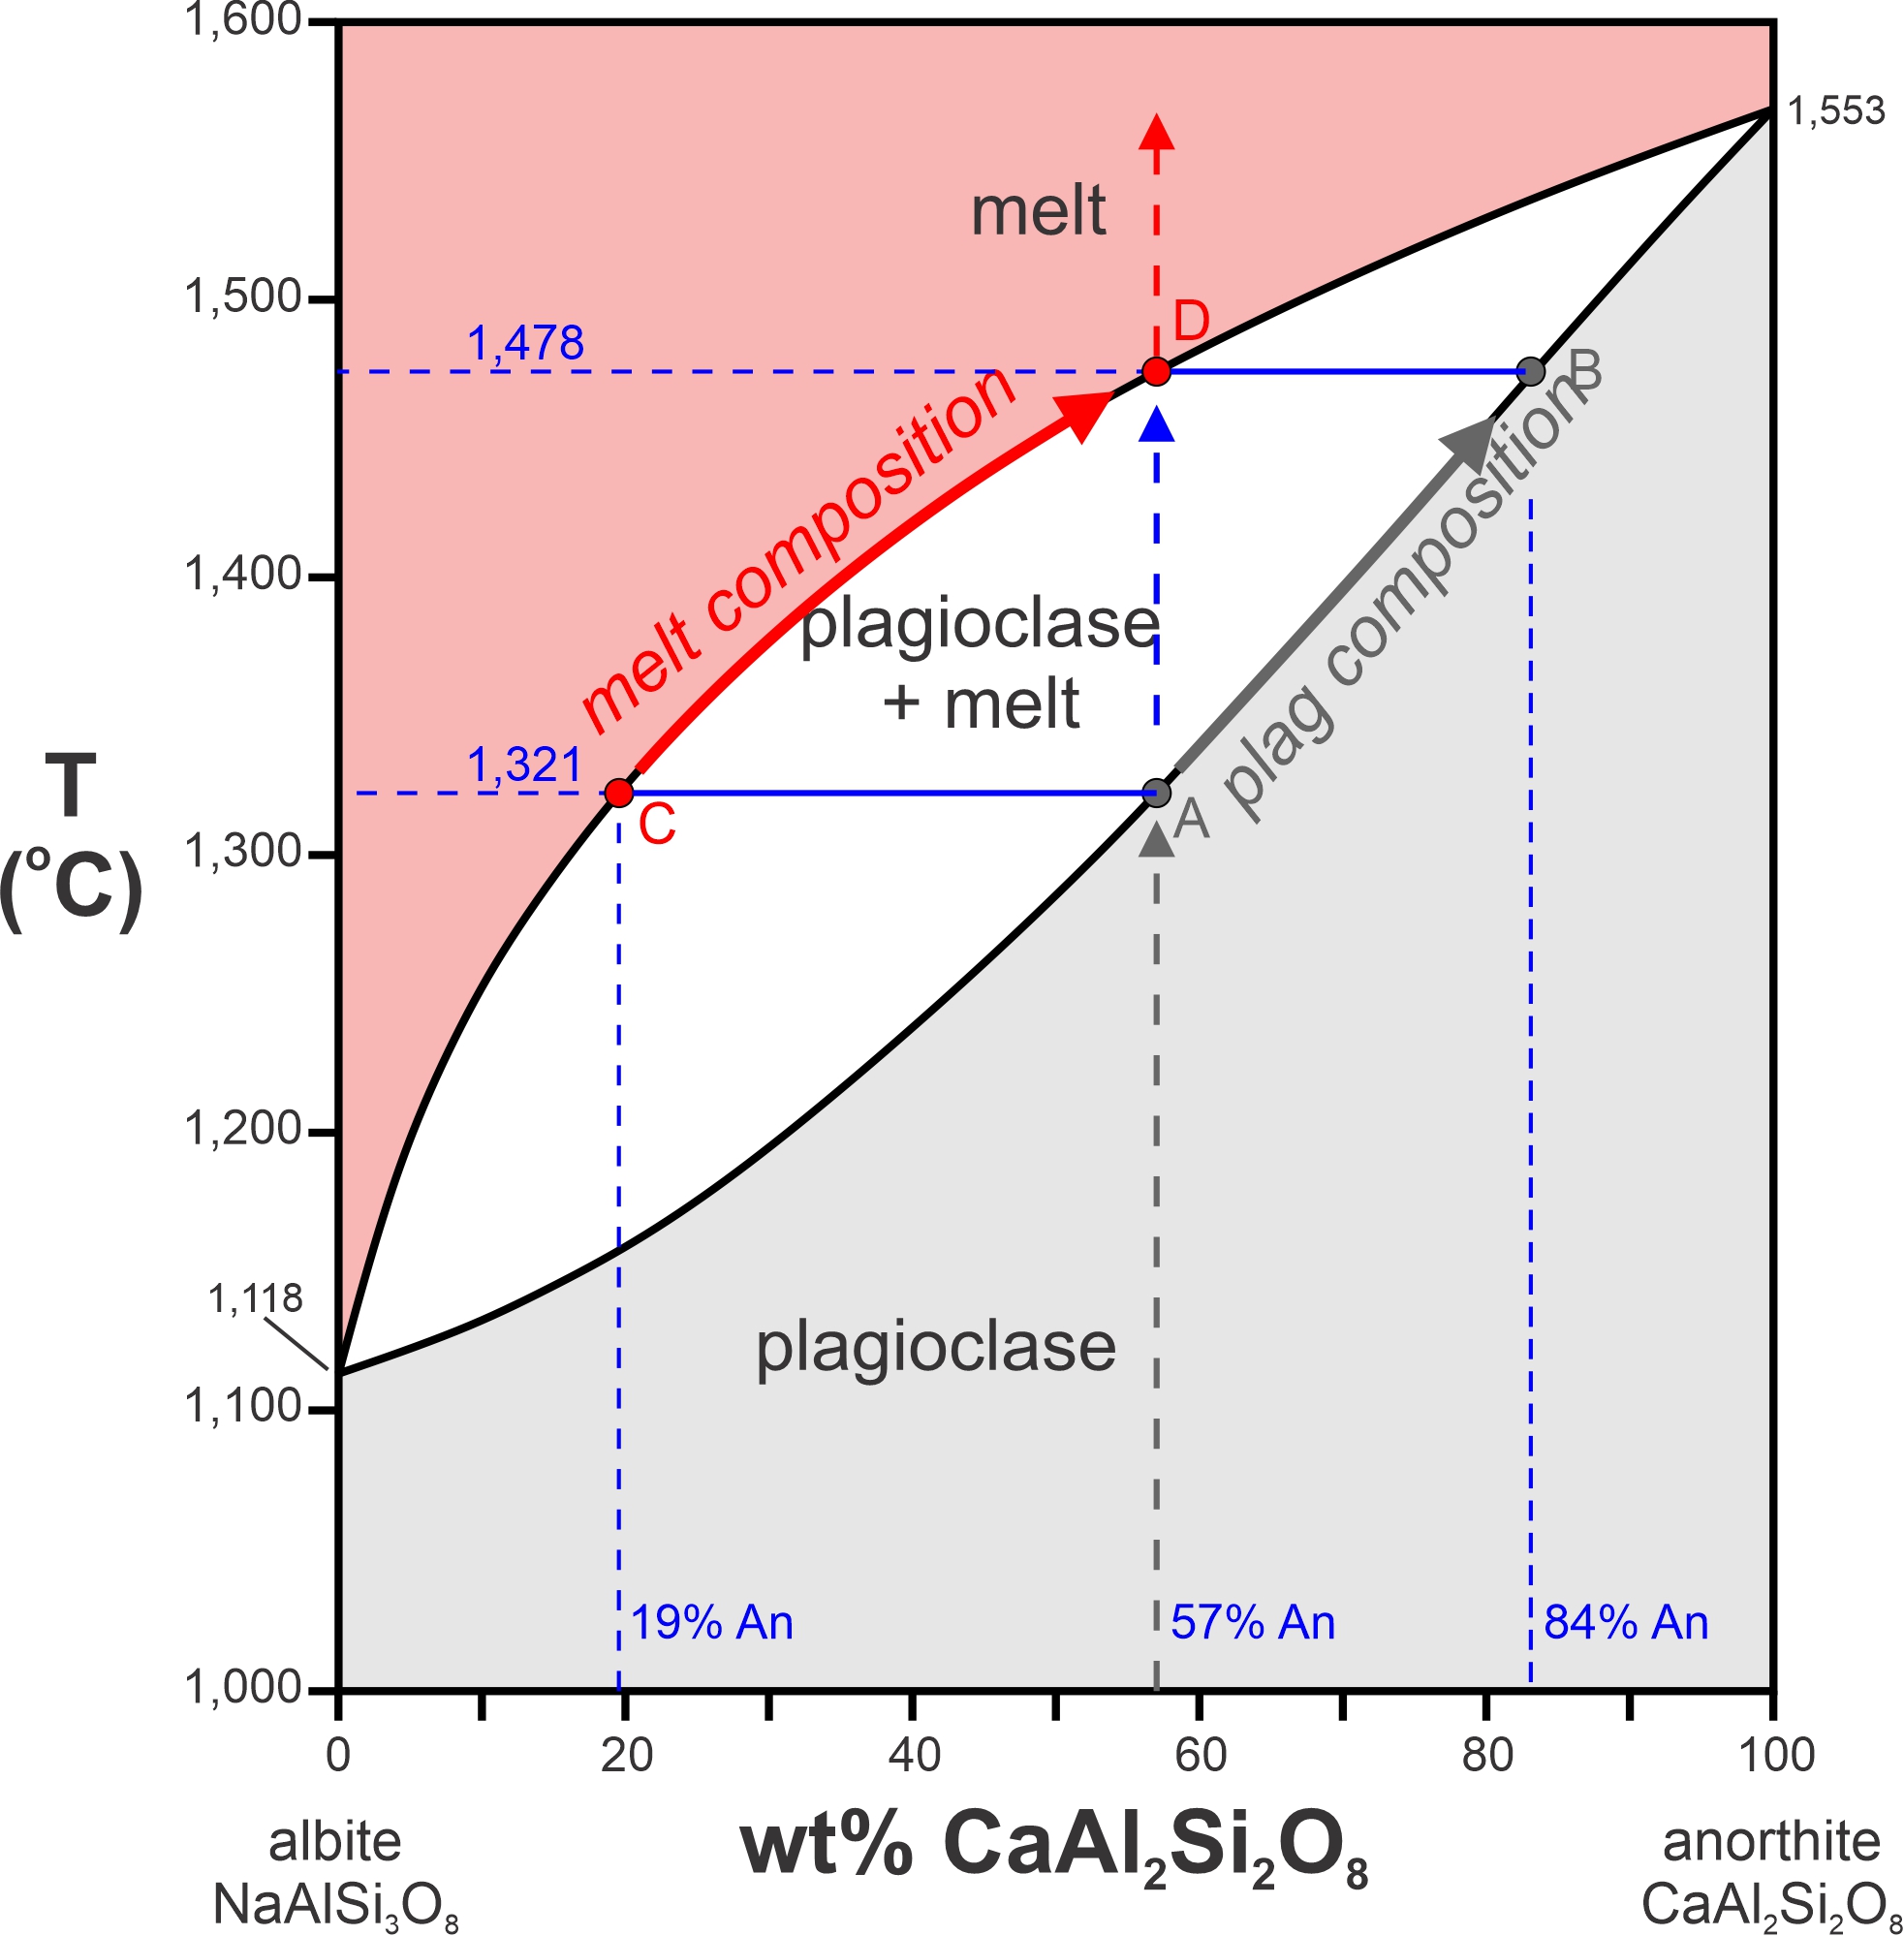
If we heat plagioclase that is 57% anorthite, it will begin to melt at point A (1,321 oC). A horizontal line at this temperature intersects the liquidus at 19% CaAl2Si2O8 (point C), which means that the first drop of melt will have this composition (19% An). Because an albite-rich melt leaves the plagioclase during melting, the crystal composition must become more anorthite-rich. With further heating, the melt composition follows the liquidus from point C to point D. Simultaneously, the crystal composition follows the solidus from point A to point B where the last speck of plagioclase is 84% anorthite. Above 1,478 oC, all is melted, and the melt has the same composition as the original crystal.
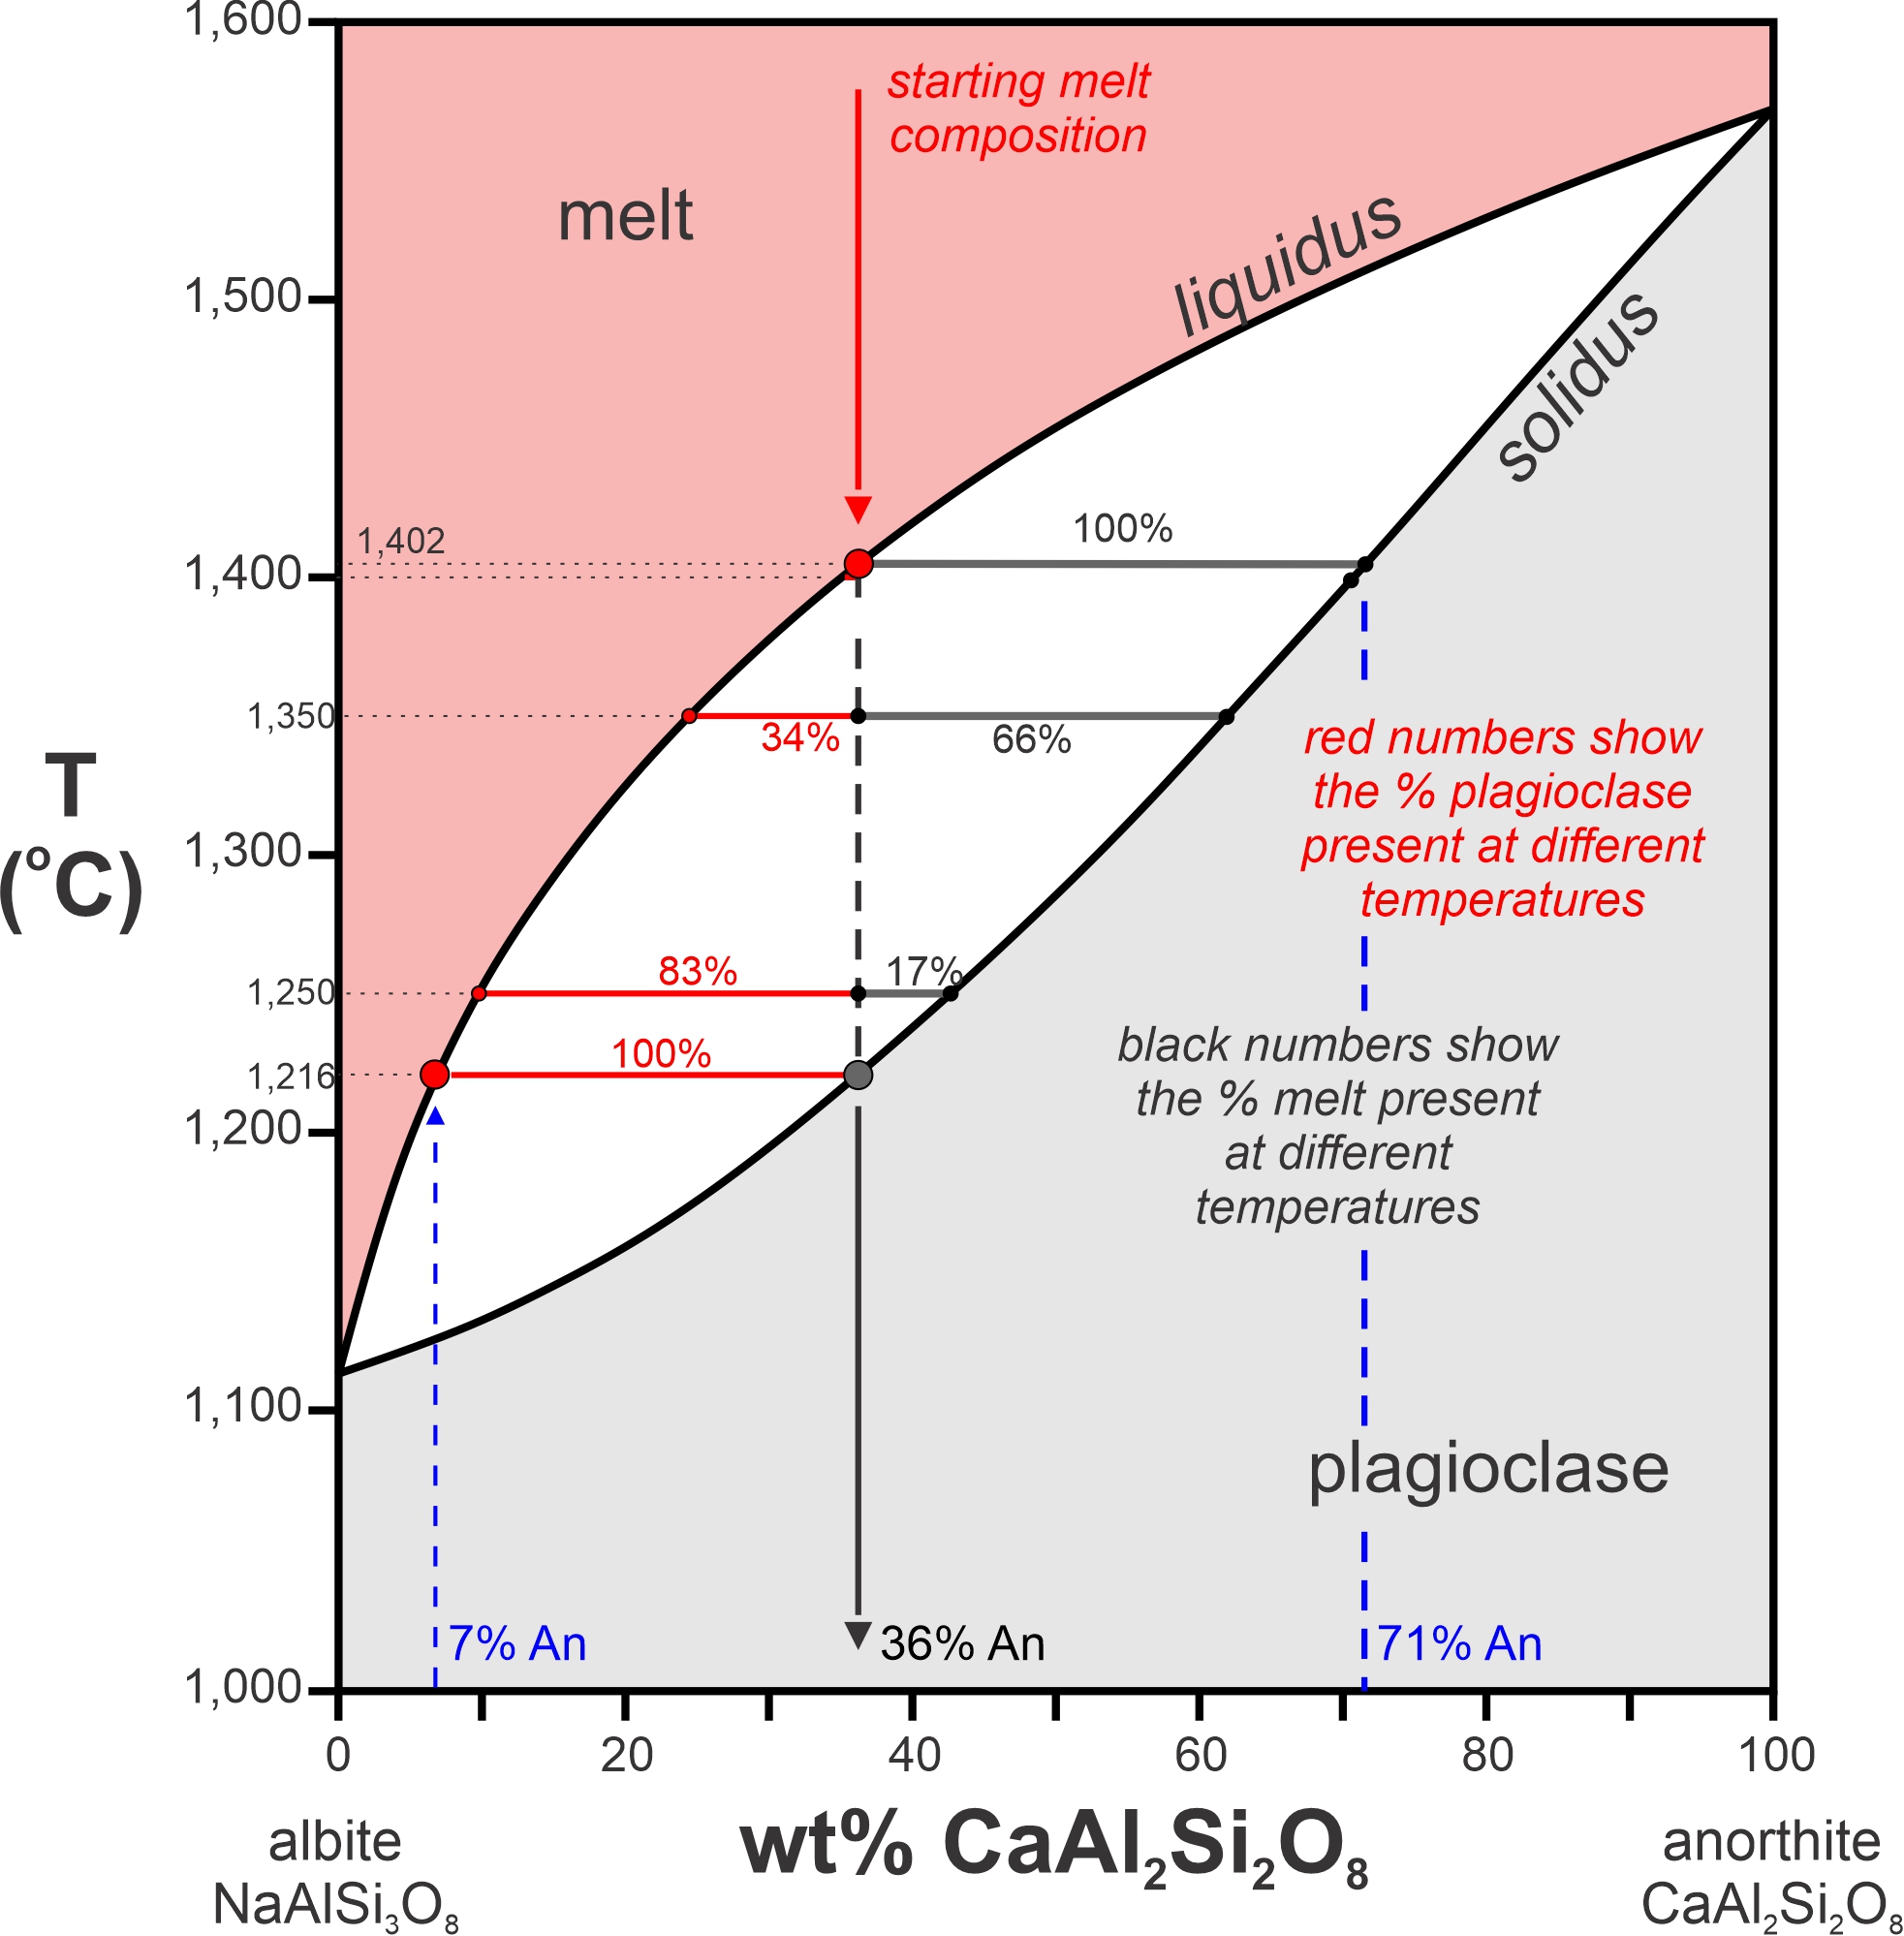
What about crystallization instead of melting? Consider a melt that has composition equivalent to 36% anorthite and 64% albite (Figure 8.33). If it cools, it will begin to crystallize at 1,402 oC. We can draw a horizontal line at this temperature and find that it intersects the solidus at An71Ab29. So, the first plagioclase crystals to form will have this composition. As more plagioclase crystallizes, the compositions of both the liquid and the plagioclase become enriched in albite until the temperature reaches 1,216 oC. Below that temperature, only plagioclase, with composition equivalent to the starting melt composition, will be present. The very last drop of melt will have composition 7% An – where a horizontal line at 1,216 oC intersects the liquidus.
We can apply the lever rule to melt and crystals in the two-phase field. At any temperature, the length of the line segment between the liquidus and the overall composition is proportional to the amount of plagioclase that has crystallized. The length of the line segment between the overall composition and the solidus is proportional to the amount of melt that is present. In Figure 8.33, the % plagioclase is labeled in red, the % melt is in black. For example, at 1,350 oC, 34% of the melt will be crystallized as plagioclase and 66% will remain liquid. And at 1,250 oC, crystals make up 83% of the mass and only 17% melt remains.
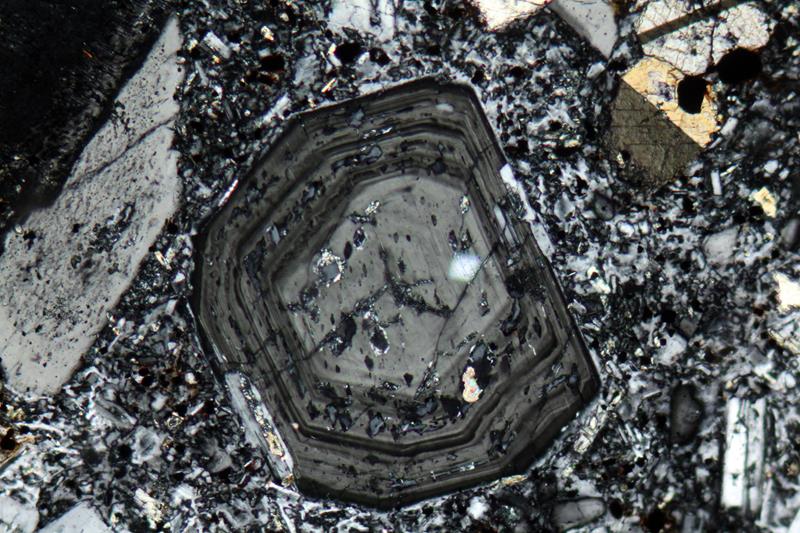
The preceding discussion tells us that if melt and crystals remain in equilibrium, plagioclase should change composition to become more albite-rich with cooling. This generally happens, but sometimes exchange of ions between crystal and melt cannot keep up with cooling. If so, crystals may exhibit chemical zoning, with high-temperature compositions in their centers and lower-temperature compositions concentric around them. Figure 8.34 is a thin-section view of a plagioclase crystal that exhibits this. The different composition rings around the core have different optical properties and so appear different shades of black and gray. The colors seen in this view are not real mineral colors – they are interference colors, but do show compositional variations well. Figure 3.28 shows scanning electron images of zoned plagioclase crystals. Figure 4.48 shows another example of zoned plagioclase, although the zoning is more difficult to see because the crystal displays pronounced twinning. The scanning electron microscope images in Figure 3.31 are colorful images of plagioclase that display calcium and sodium zoning. In these images, the purple parts of the crystals are more sodium-rich.
8.3.3.4 Olivine Melting and Crystallization
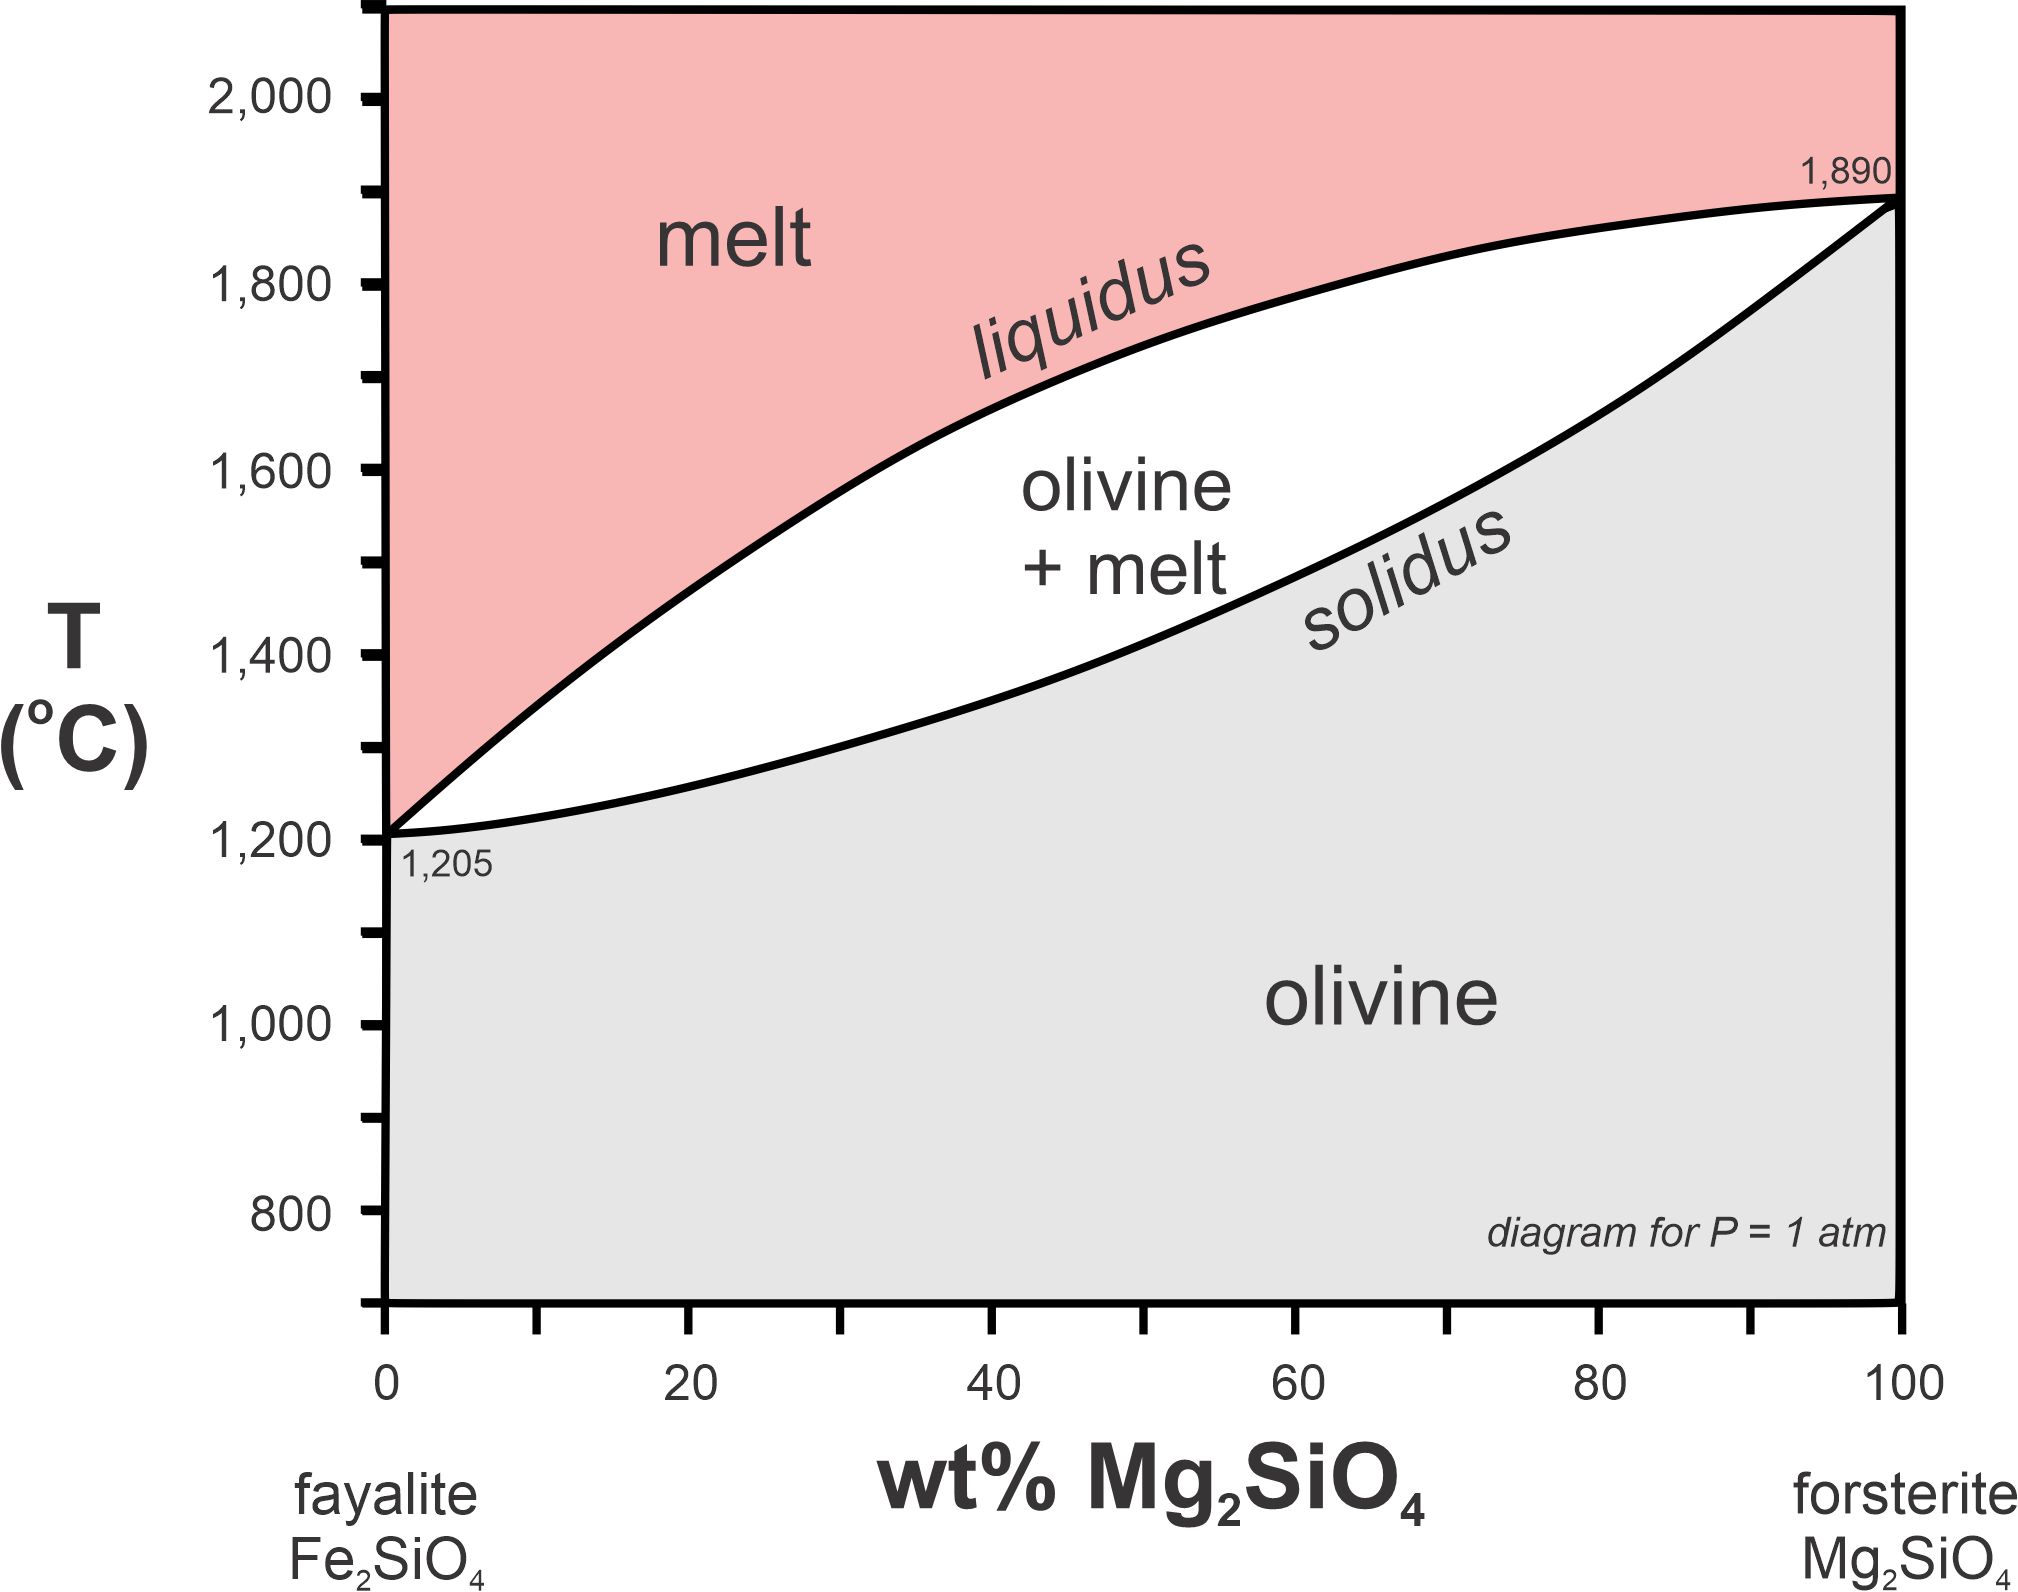
Olivine melts in the same manner as plagioclase, and the olivine phase diagram (Figure 8.35) looks similar. Fayalite, the iron olivine end-member, melts congruently at 1,205 oC. Forsterite, the magnesium end-member, melts congruently at 1,890 oC. Intermediate compositions melt incongruently. So, melt and crystals can have different compositions and olivine, too, may become compositionally zoned if melt and crystals do not remain in equilibrium. Other mineral systems, too, have melting relationships and phase diagrams similar to those of plagioclase and olivine. These other systems, however, mostly include relatively rare minerals.
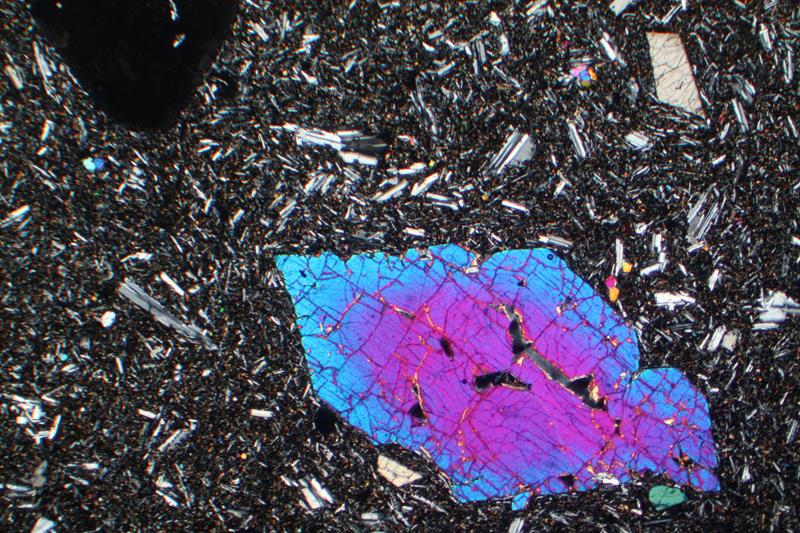
Figure 8.36 is a microscope photo of a zoned olivine phenocryst in an olivine basalt from the Azores Islands. The bright-colored olivine crystal in this view is about 6 mm in longest dimension. As with Figure 8.34, the colors seen in this photo are interference colors, not mineral colors. The core of this crystal, which formed at high-temperature is more forsterite-rich than the rim. The groundmass around the phenocryst is mostly glass and laths of plagioclase.
8.3.3.5 Why is Incongruent Melting Important?
Incongruent melting of any kind is important in Earth, and it is common. Complete melting of a rock is not generally possible – different minerals melt at different temperatures, and the melt would squirt away under pressure before all solid rock is gone. And incongruent melting means that when a rock is partially melted, or a magma is partially crystalized, the melt and the crystals do not have the same composition. So, if melt and crystals become separated, perhaps due to crystal settling in a magma chamber, the crystals may be left behind and the melt may move onward and upward. But, the melt has a different composition from what is left behind. In this way, Earth has become differentiated, with low-temperature melts moving upwards while high-temperature minerals are left at depth. So, for example, over Earth’s immense history, the crust has become increasingly enriched in silica while the mantle has become enriched in magnesium and iron.
8.3.4 Immiscibility and Solvi
● Box 8.3 Chicken SoupFrom practical experience, we all know that oil and vinegar in salad dressing do not mix. The oil and vinegar remain separated (which is why many restaurants serve the oil and vinegar in separate bottles). Chicken broth and chicken fat act the same way – they do not mix easily. Figure 8.37 is a photo of chicken soup that is cooling to room temperature. Globules of fat have separated from the soup because liquid fat and chicken broth are immiscible at all but the highest temperatures. The phase diagram in Figure 8.38 shows a system with the components chicken broth and fat. Broth containing dissolve fat is stable for compositions at temperatures that plot in the red field. The white area in the middle of the diagram is a two-phase field, commonly called a miscibility gap. We call the curve bordering the miscibility gap the solvus. 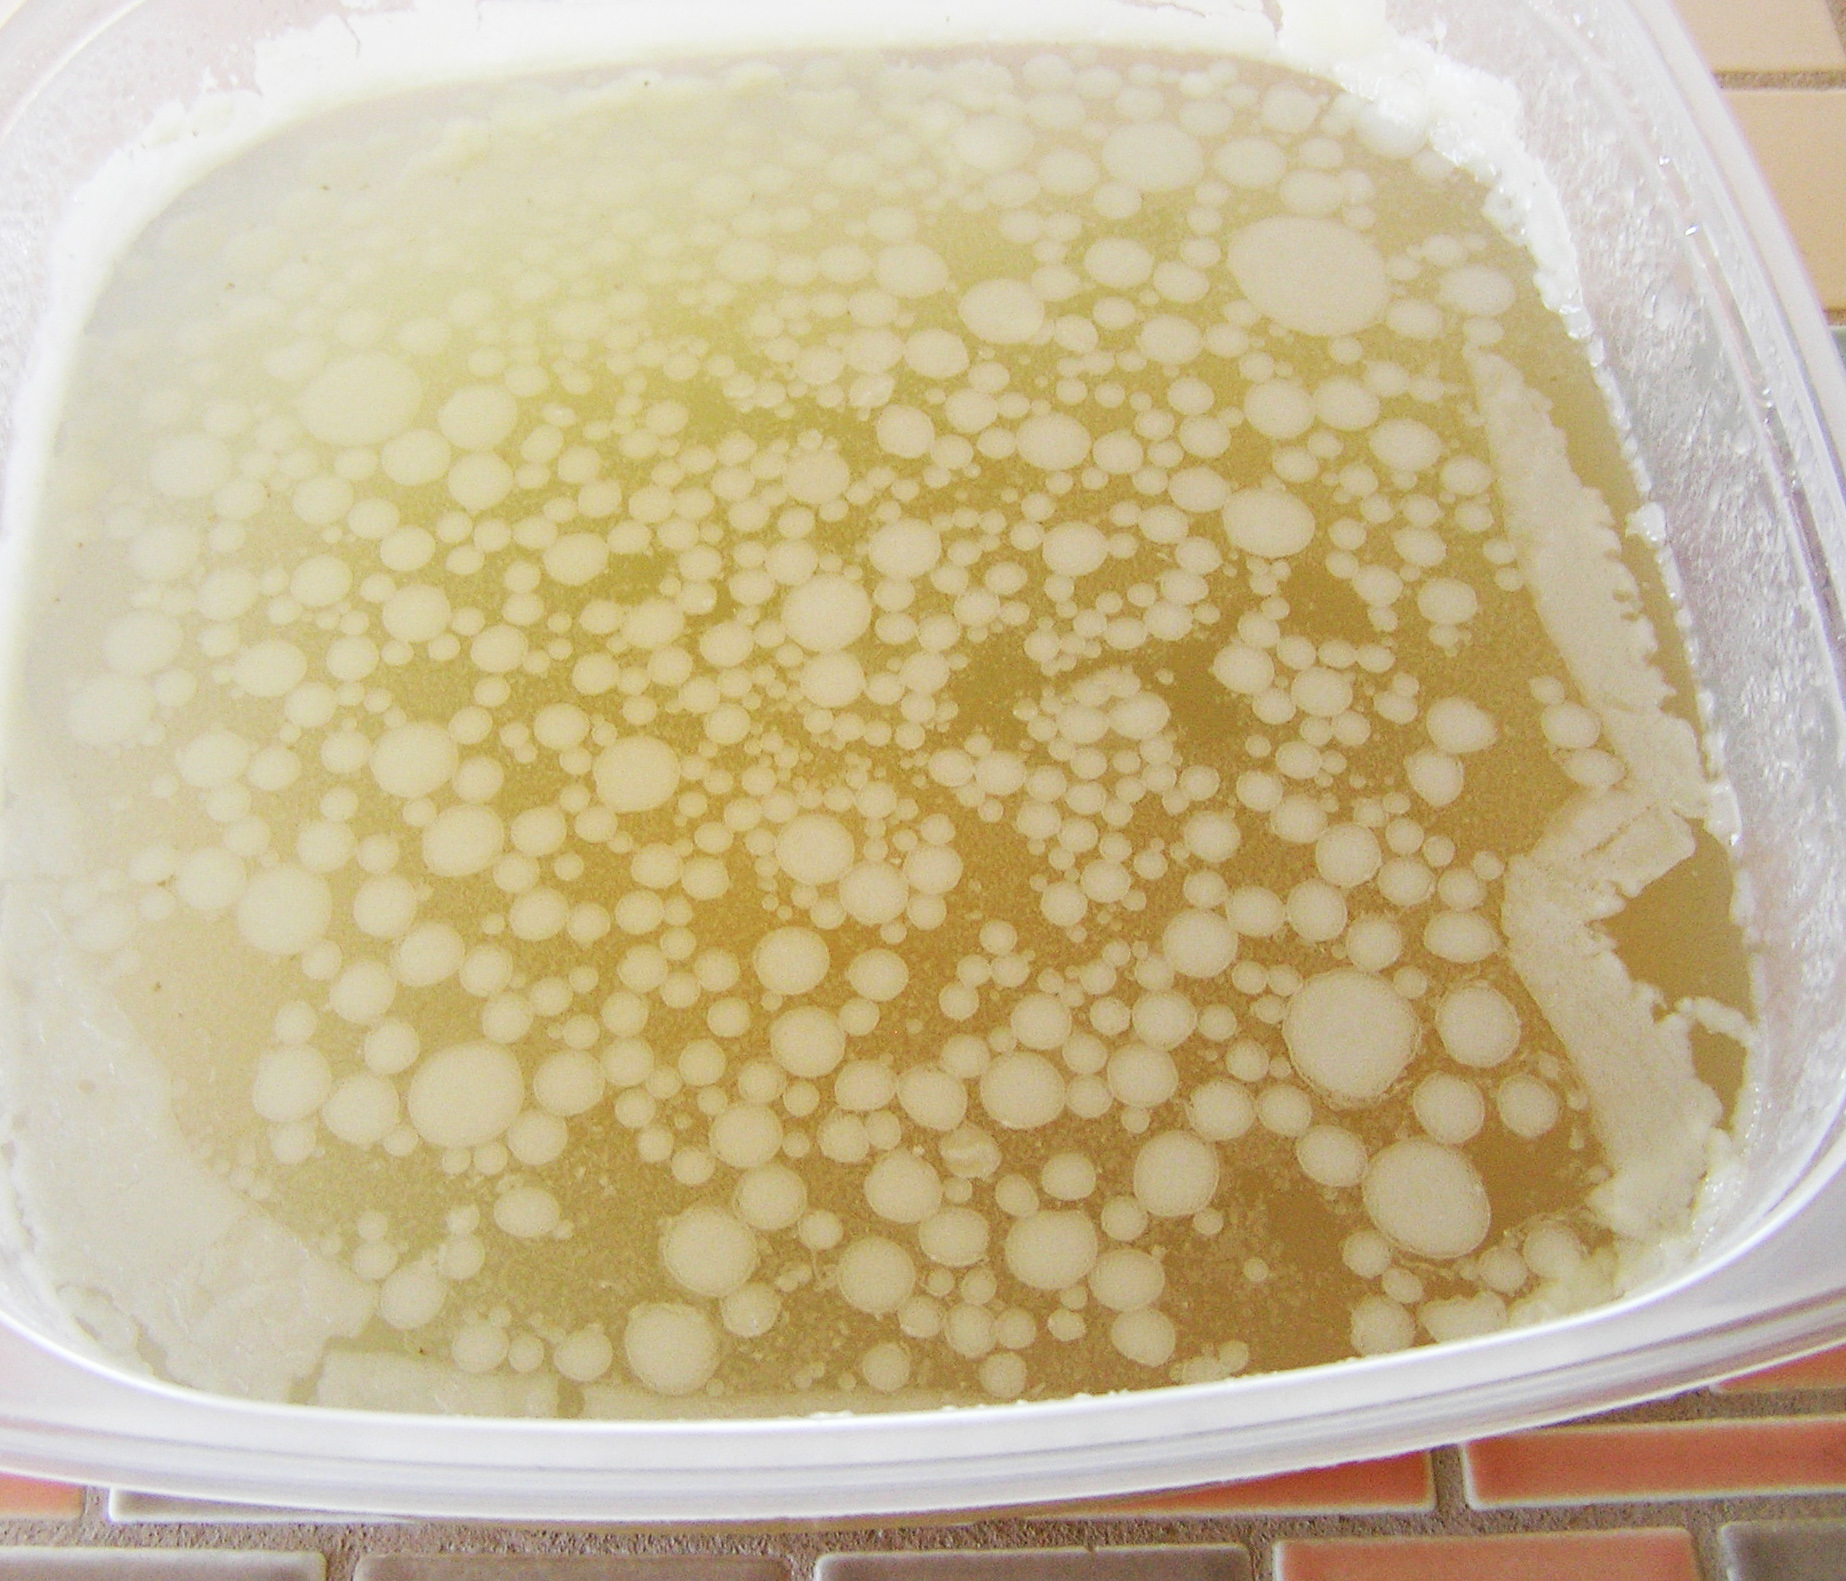 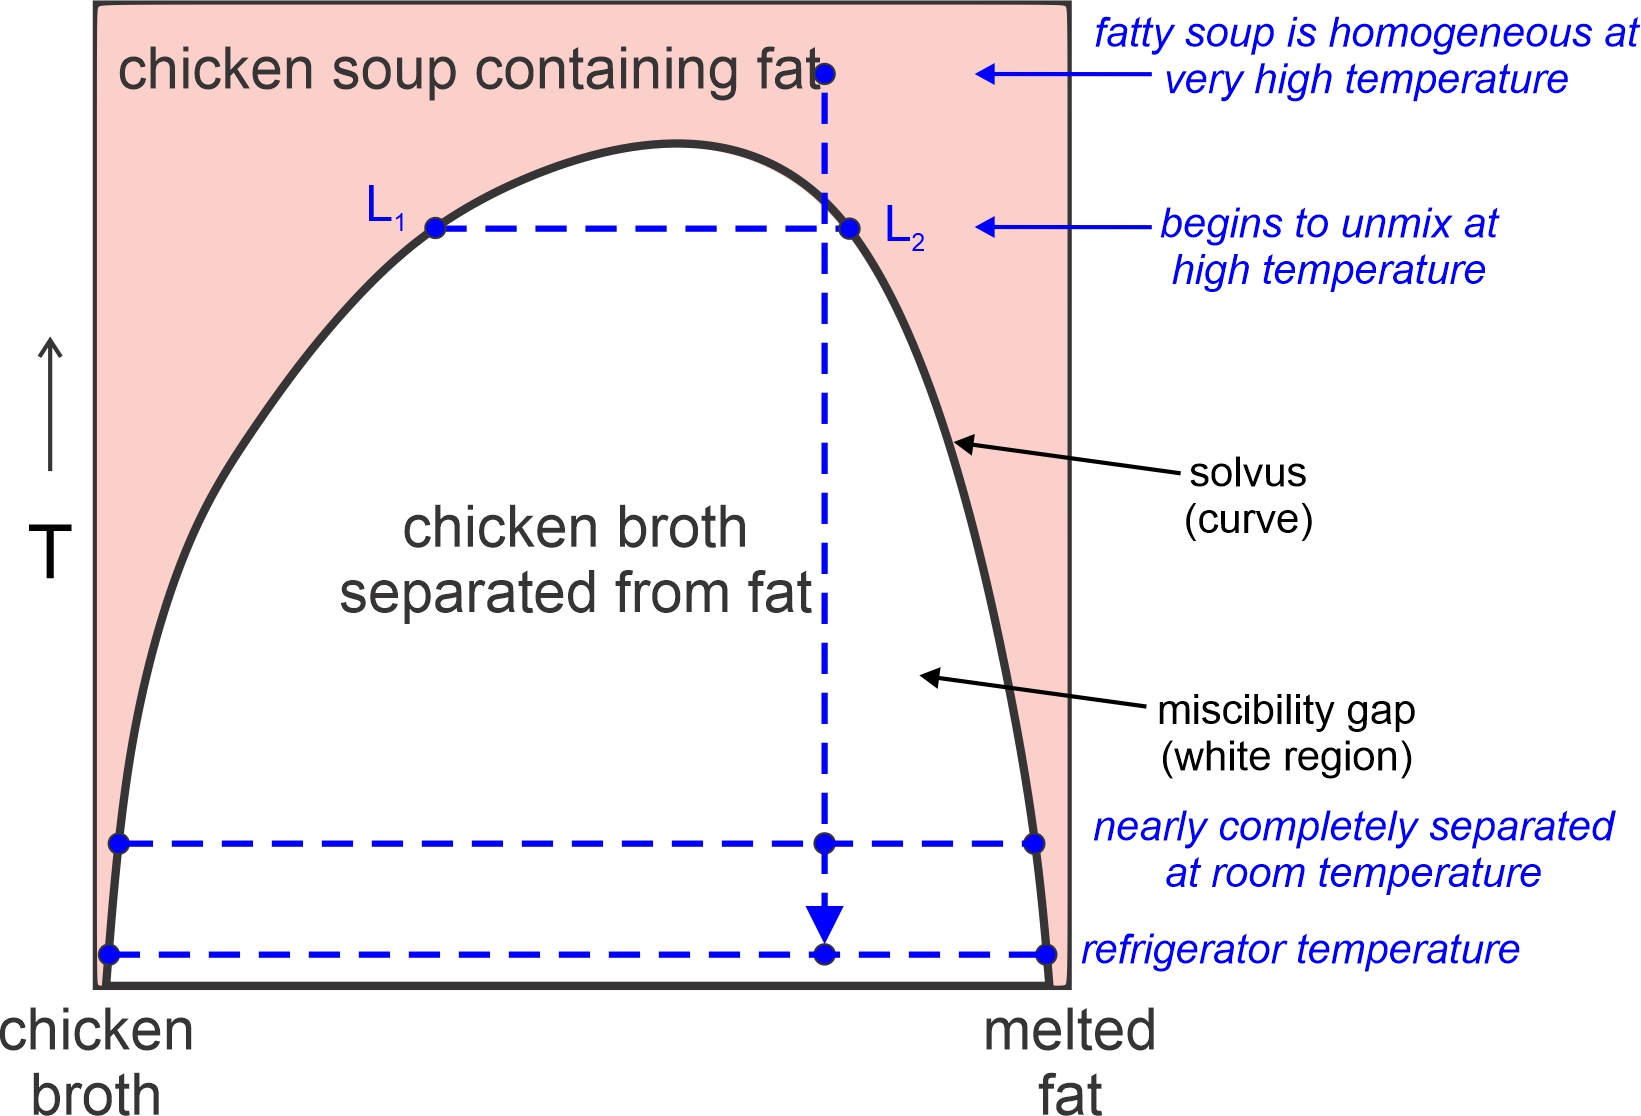
 Figure 8.38 is a typical solvus diagram. At the top of the diagram – at high temperatures – all combinations of broth and fat are stable. At low temperatures, only compositions near the two end-members are stable. With cooling, hot soup enters the miscibility gap, so the soup unmixes into two separate liquids, one broth-rich (L1) and one fat-rich (L2). As cooling proceeds, compositions of the two liquids separate further, eventually becoming nearly pure chicken broth and pure fat at room temperature. After a night in the refrigerator, they will be separated even more, with a thick layer of coagulated fat forming on top of the broth (Figure 8.39). |
8.3.4.1 Liquid Immiscibility Involving Mineral Melts
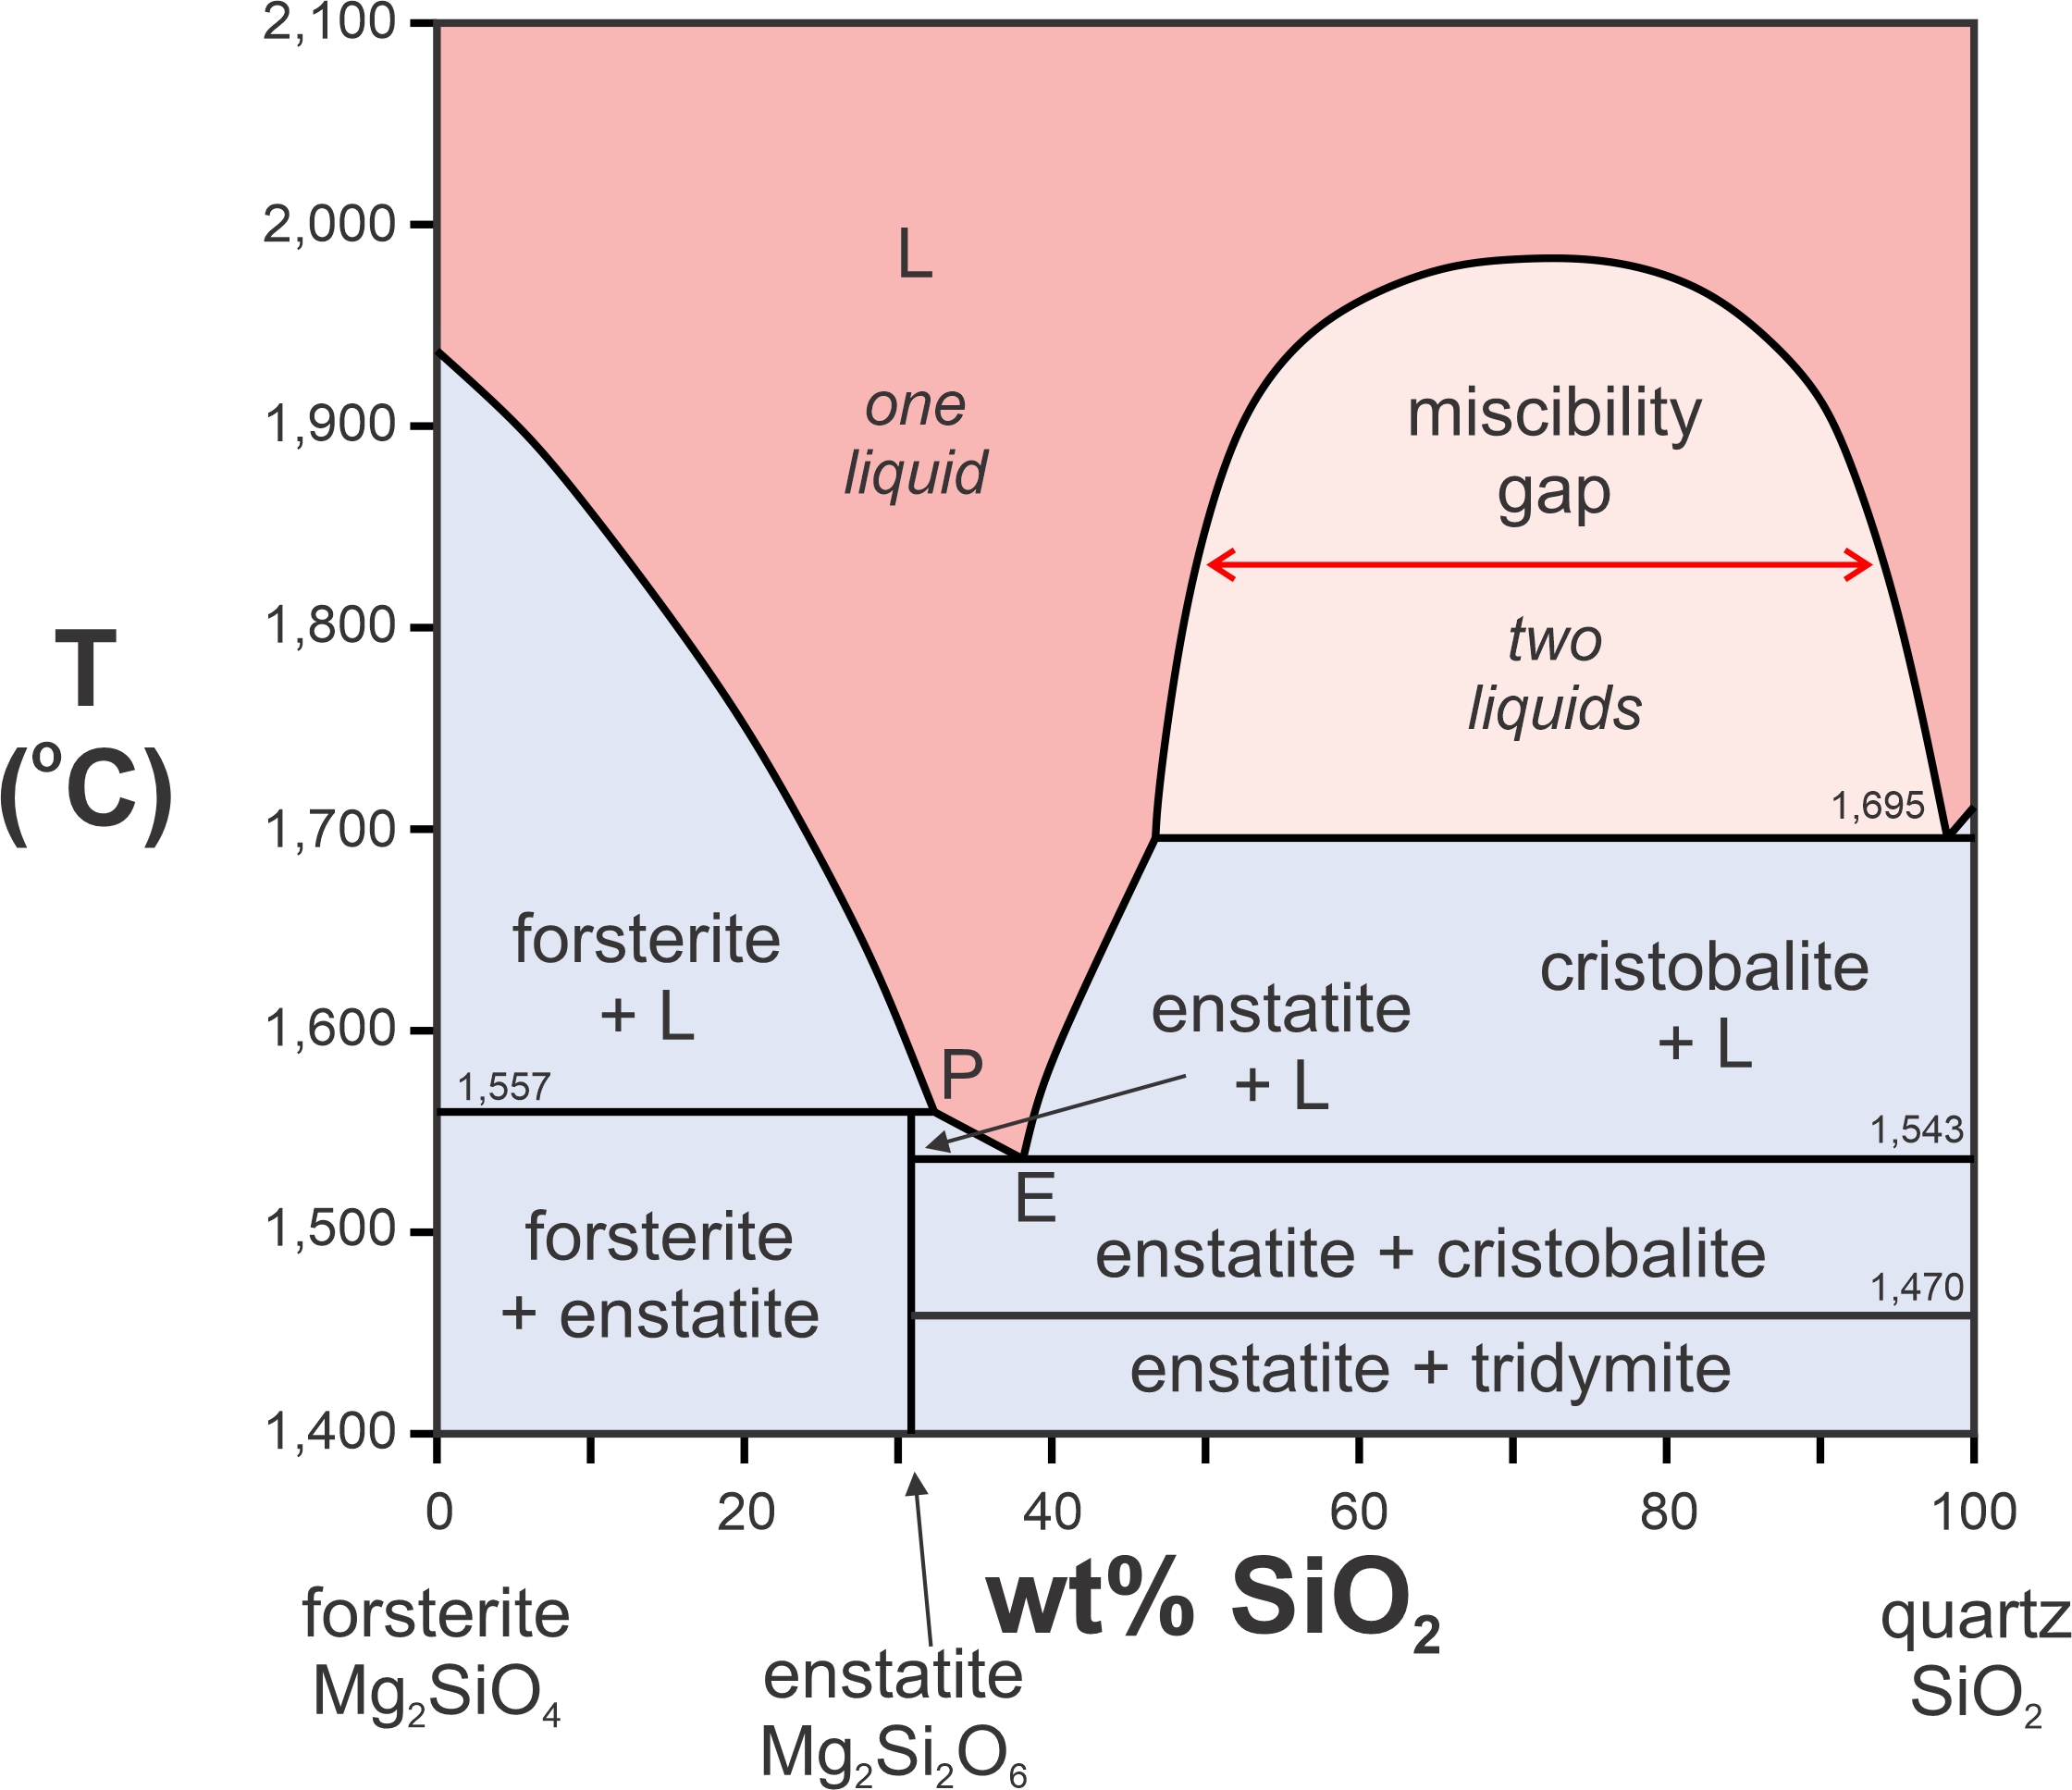
Figure 8.40 is a phase diagram for the two-component system Mg2SiO4-SiO2. We saw the left half of this diagram previously (Figure 8.29). Here we see the entire thing. The right side of this diagram contains a miscibility gap above 1,695 oC. A single melt will unmix to produce melts of two compositions – one extremely silica-rich and the other more intermediate in composition. This sort of unmixing is common in magmatic systems, but generally involves more than two components.
Many mineral compositions are stable at high temperatures but not at lower temperatures. So, if given enough time, a mineral may unmix into two compositions. We call this unmixing process – that involves crystals instead of liquids – exsolution.
Exsolution textures are important because they tell us that a mineral formed at high temperature and subsequently reequilibrated when it cooled. Due to slower cooling rates, exsolution is more common in plutonic rocks than in volcanic rocks. In contrast with plutonic rocks, typical volcanic rocks may contain homogeneous, but unstable (not in thermodynamic equilibrium), high-temperature mineral compositions after the rocks cool to Earth-surface temperatures. This is common because, when lavas cool, there is insufficient time for exsolution to occur before temperature is so low that all reactions stop. We saw some examples of exsolution in plutonic rocks in Chapter 7 (Section 7.7.3).
8.3.4.2 Exsolution of Alkali Feldspars

The most significant exsolution is a subsolidus phenomenon, which means it does not involve melt – only crystalline minerals. Alkali feldspars provide a great example. Figure 8.41 shows subsolidus T-X diagrams for feldspars ranging from albite (Ab, NaAlSi3O8) to orthoclase (Or, KAlSi3O8). A single homogeneous feldspar is stable for temperatures and compositions that plot in the blue field. But, for most compositions, cooling will intersect the solvus and exsolution will occur.
Consider, for example, an initial feldspar that contains 70% albite and 30% orthoclase (blue vertical arrow in Figure 8.41). As seen in the four diagrams, this composition is stable above 737 oC but at lower temperature will unmix into two separate feldspars. At 700 oC, these compositions are Ab84Or16 and Ab42Or58; at 650 oC, the compositions are Ab91Or09 and Ab31Or69; at 600 oC, the compositions are Ab93Or07 and Ab23Or77; and at 550 oC, the compositions are Ab94Or06 and Ab18Or82. So, with continued cooling the two feldspar compositions move toward end-member albite and orthoclase. Exsolution continues until, eventually, poor kinetics at low temperature causes unmixing to stop. The extent of unmixing depends, in large part, on cooling rate.
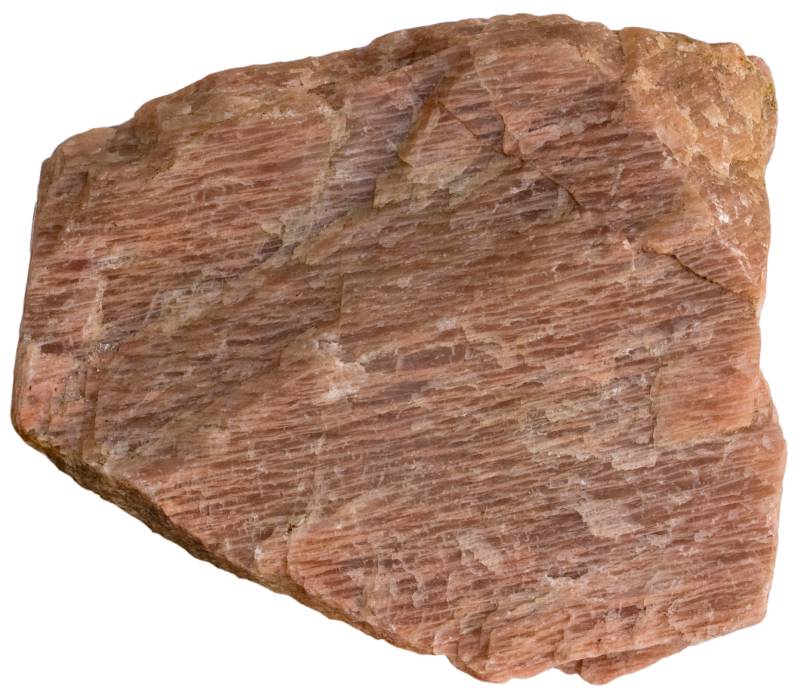
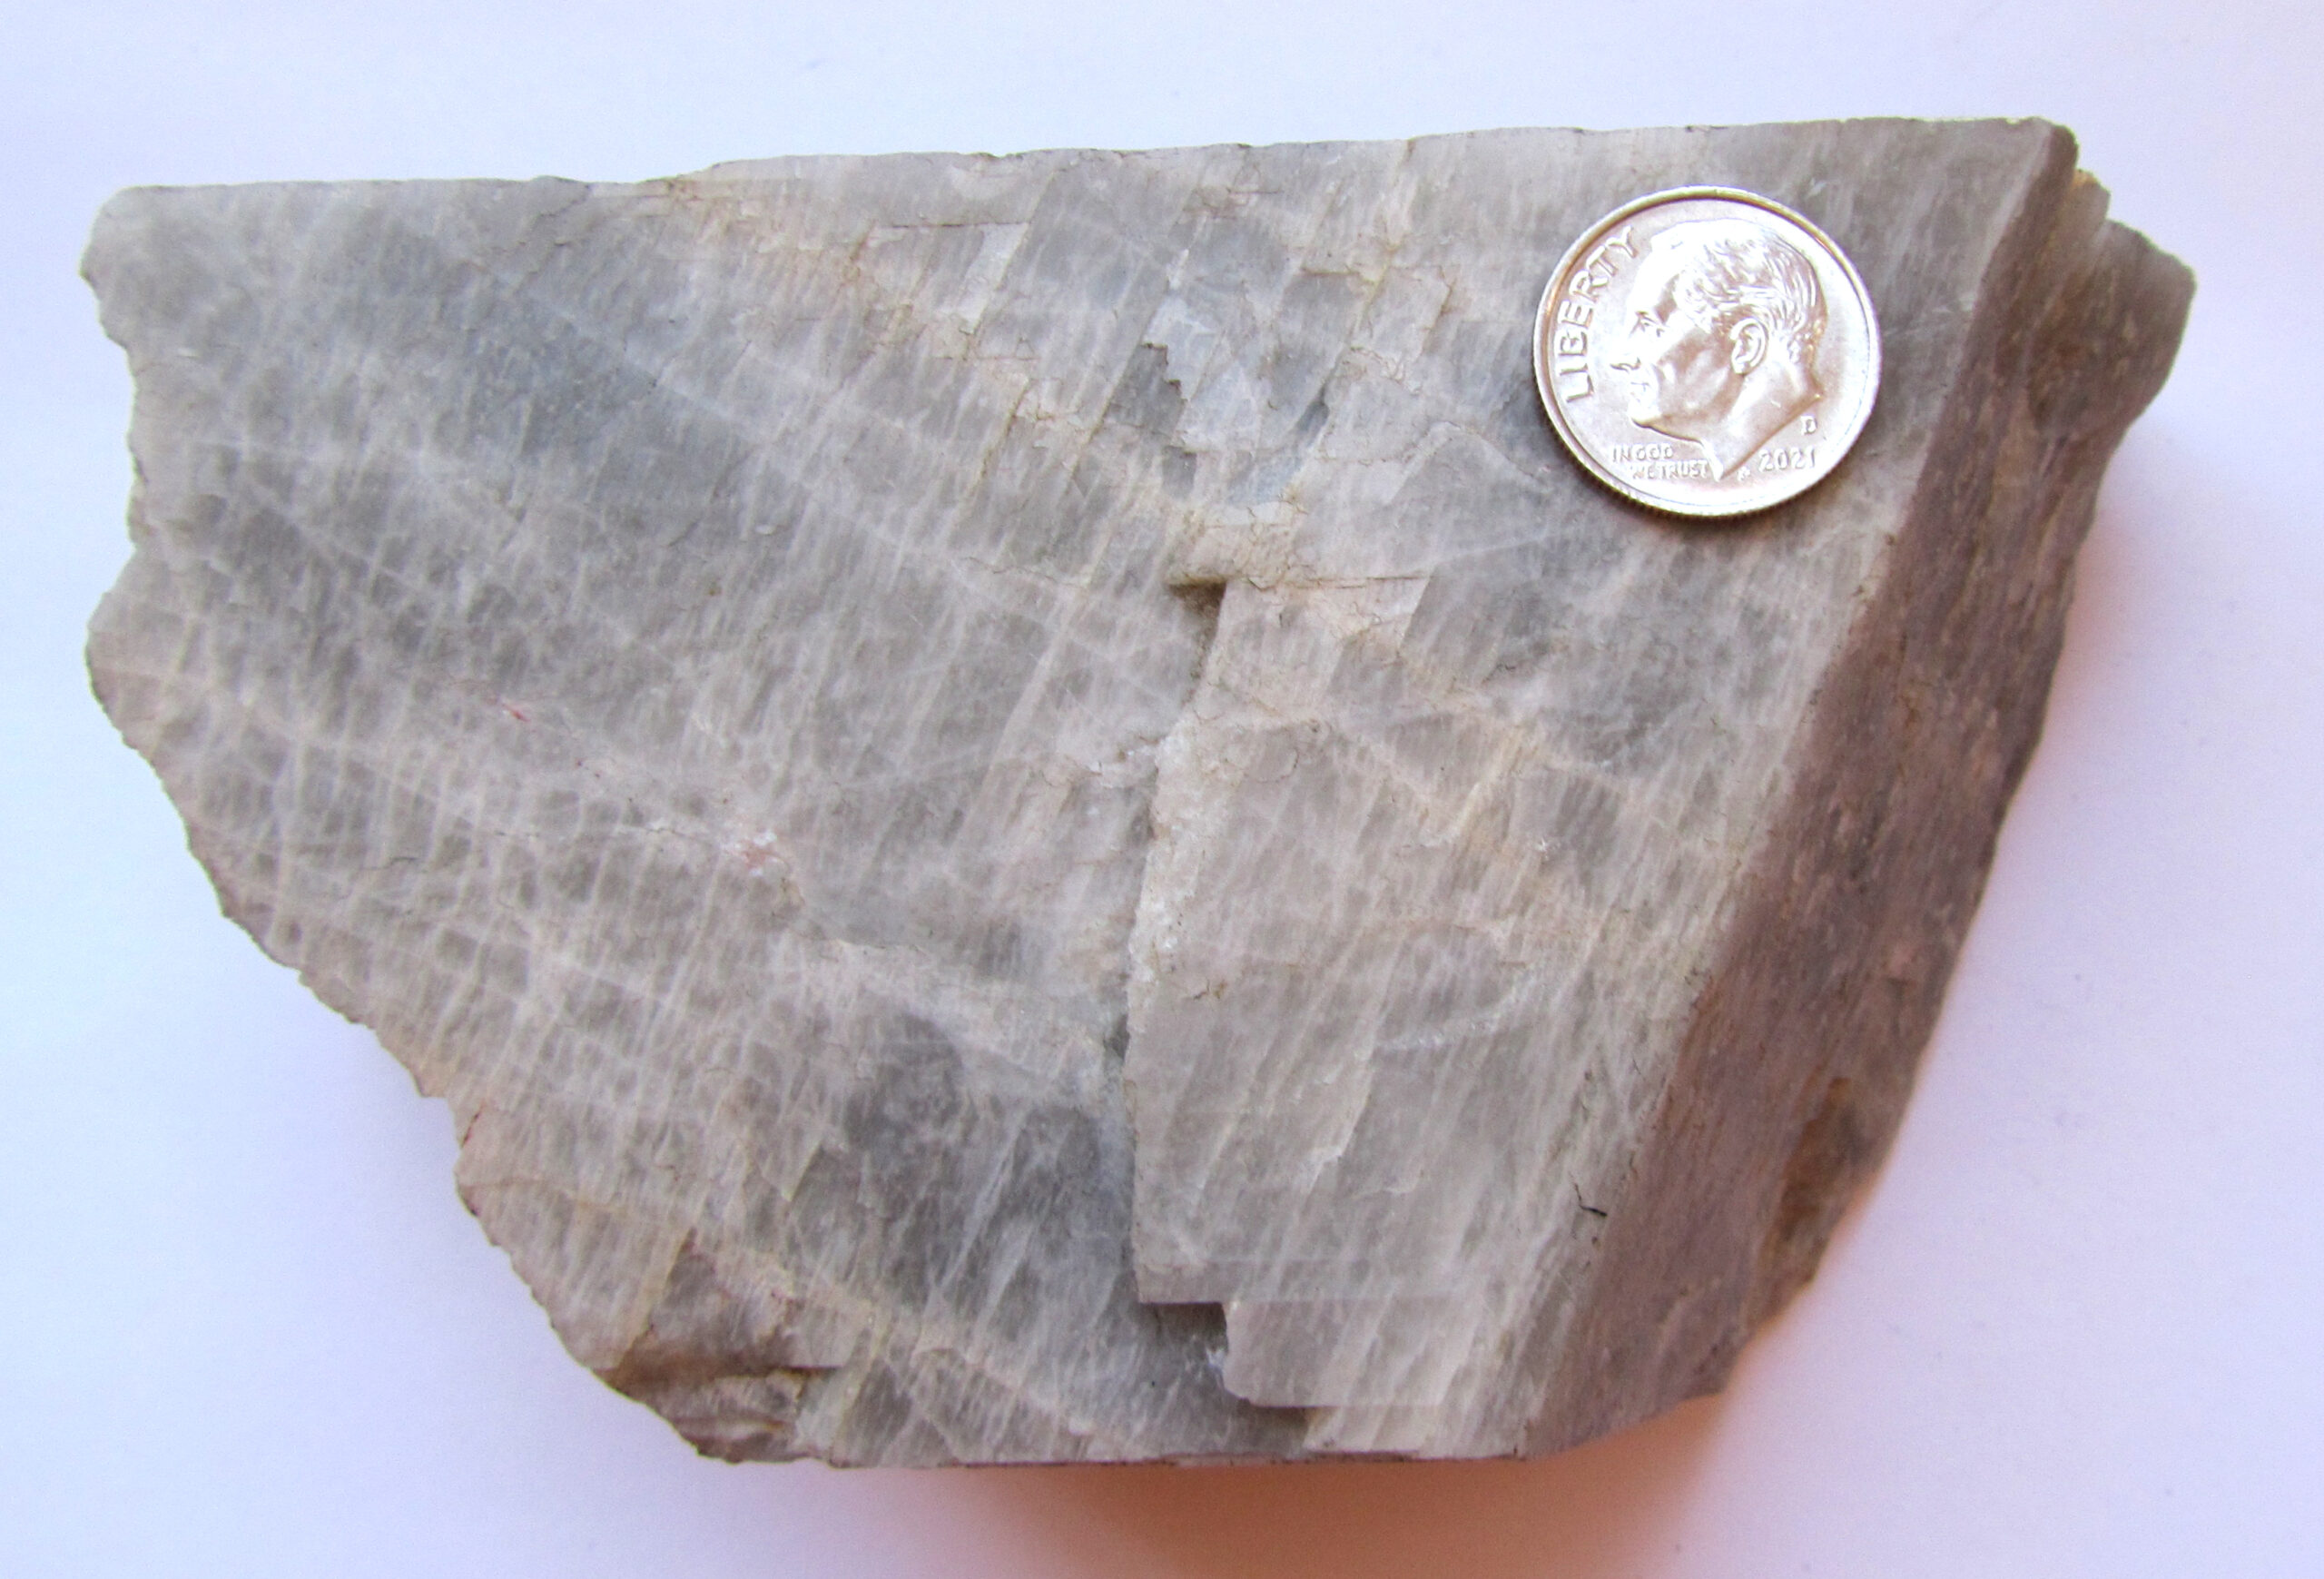
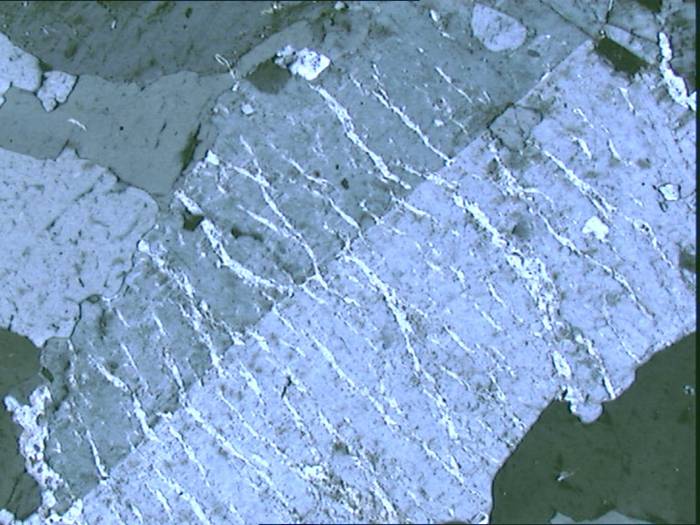
Figures 8.42 and 8.43 are photos of hand samples of perthite, the term used for exsolved alkali feldspar. Both contain light-colored stripes of albite-rich feldspar that unmixed from an originally homogeneous alkali feldspar crystal. We call the exsolution stripes exsolution lamellae. The two hand samples have about the same textures but differ in color. Lamellae, such as those in both these samples, are sometimes described as stringers.
|
|
|
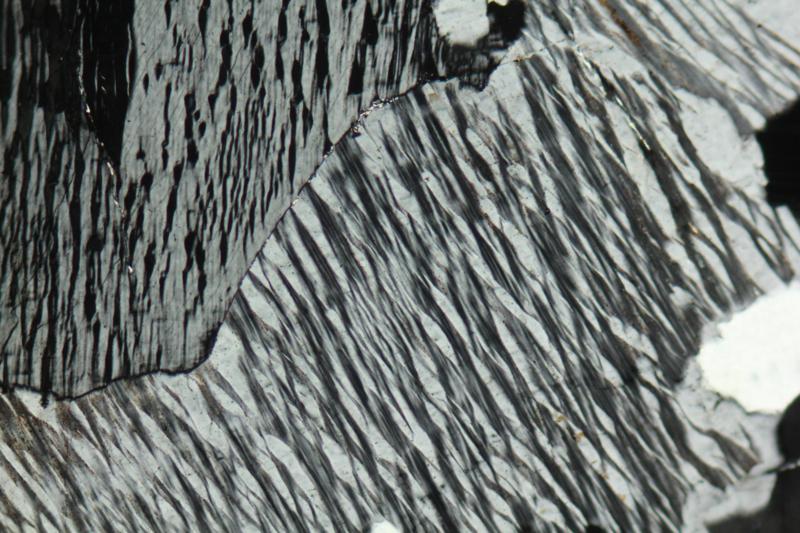
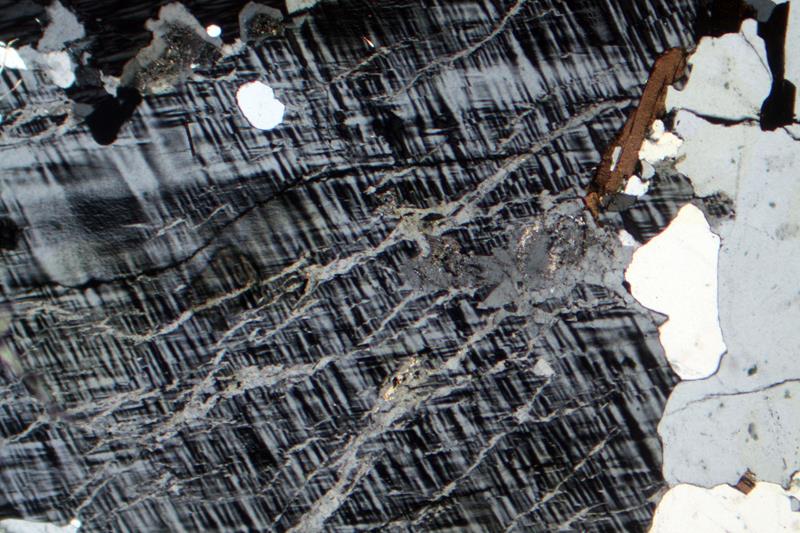
Figures 8.44, 8.45, and 8.46 show perthite in thin section. Because different feldspar compositions, they have different optical properties, so perthite can be seen under crossed polars. Most perthitic grains contain wavy or wormy stripes that display contrasting 1st-order interference colors. The photo in Figure 8.44 shows a good example. Other perthitic grains may contain blebs of exsolved fedspars, and some contain exsolution lamellae that appear similar to fracture filling, as in Figure 8.45. Besides being exsolved, the grain seen in Figure 8.45 is twinned. The exsolution lamellae, h0wever extend across the twin boundary. Figure 8.46 is a photo of K-feldspar exhibiting microcline twinning, but the feldspar is cut by exsolution lamellae that appear as veins.
|
|
|
|
Most alkali feldspars in plutonic rocks are exsolved but sometimes we cannot see the exsolution without magnification. If we can only see the exsolution with a microscope, it is microperthite. When present, easily seen or not, perthite or microperthite distinguish alkali feldspar from plagioclase feldspar. Strictly speaking the term perthite refers to exsolved feldspar with an overall composition that contains more orthoclase component than albite component. The term antiperthite refers to the opposite case – when the feldspar is more albite-rich than orthoclase-rich. This distinction, however, is often ignored and exsolved feldspars of any composition are commonly called perthite.
8.3.4.3 Exsolution Involving Carbonate Minerals
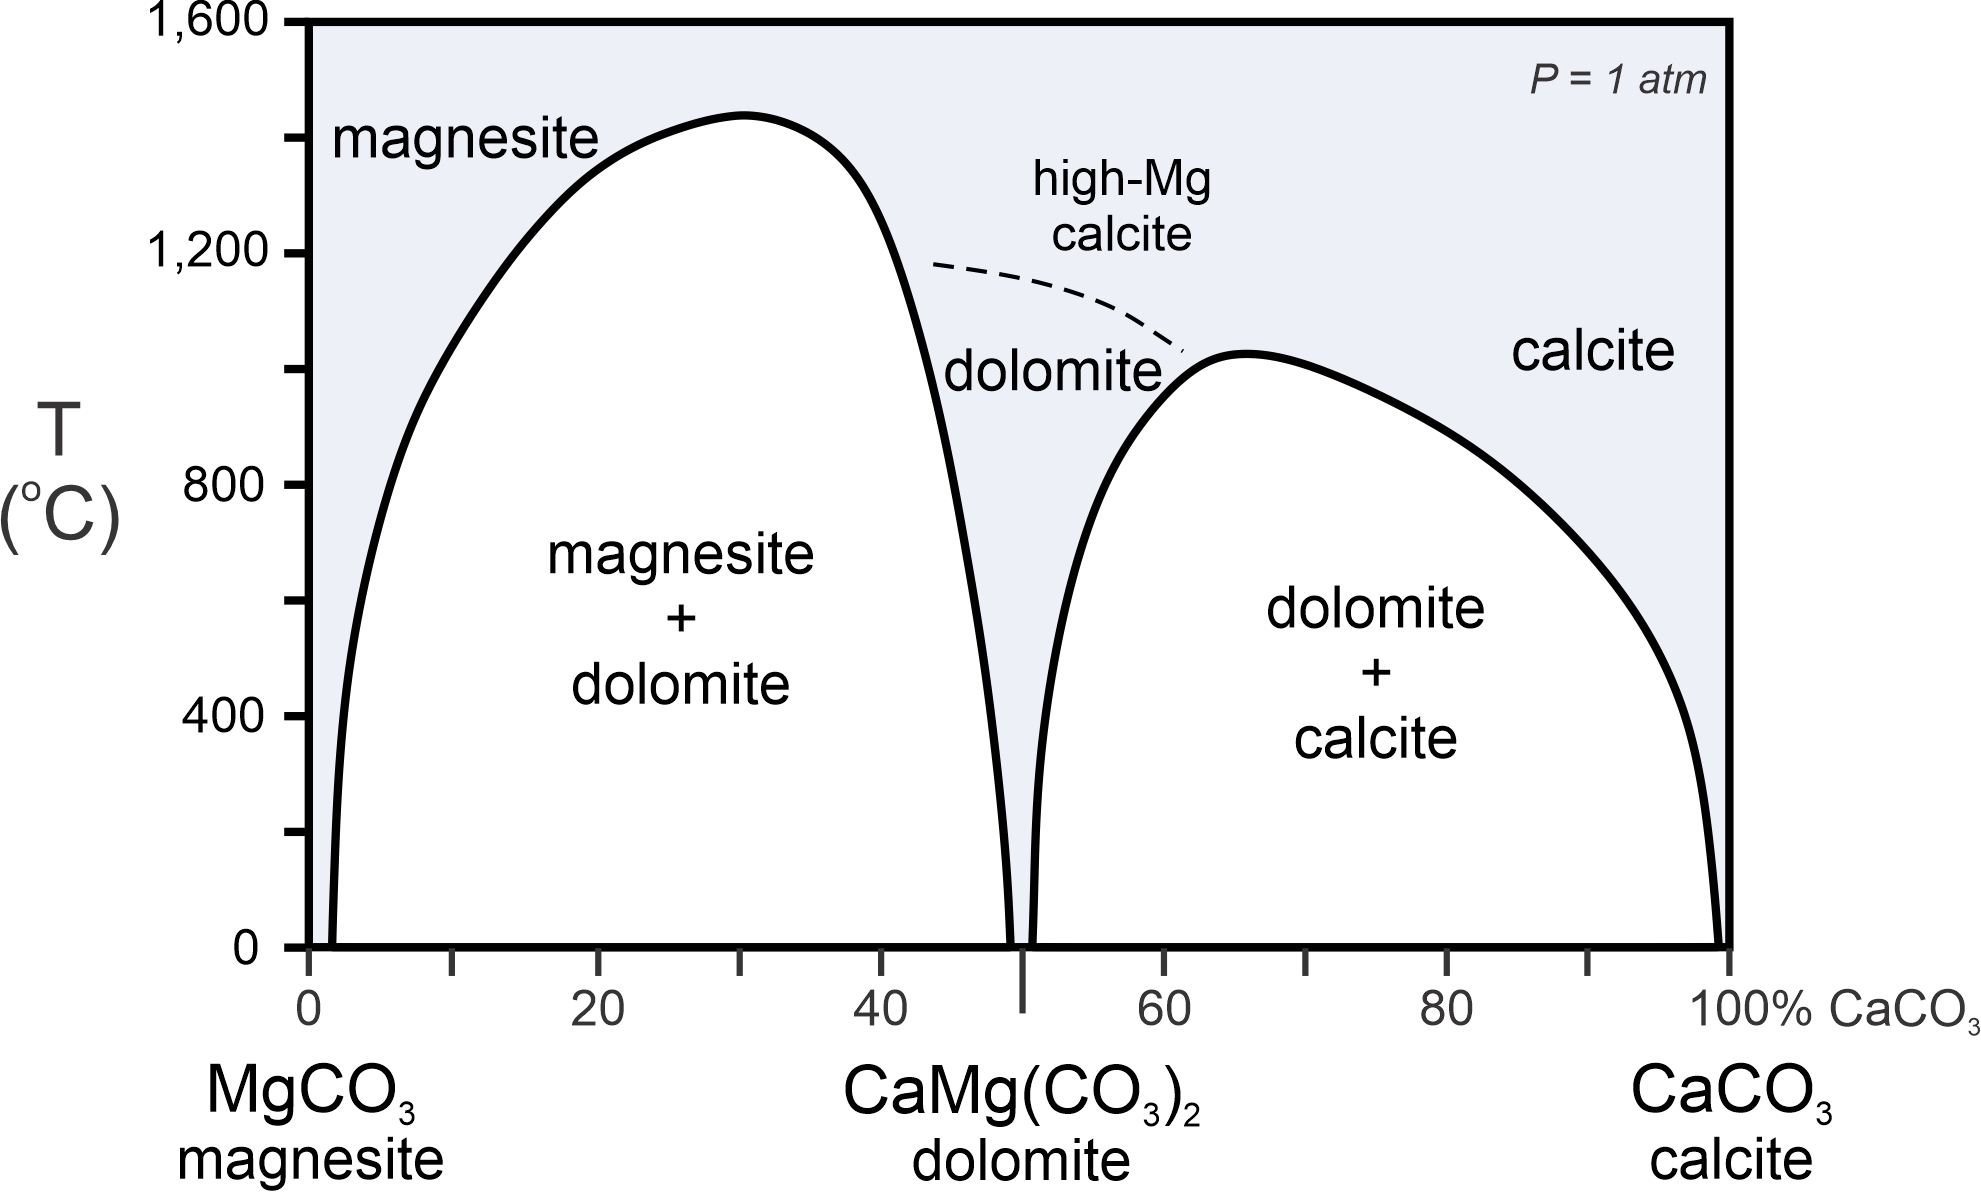
The phase diagram in Figure 8.47 shows another example of a subsolidus miscibility gap – actually, two examples involving magnesite, dolomite, and calcite. Magnesite is magnesium carbonate; calcite is calcium carbonate; and dolomite is in the middle – calcium-magnesium carbonate. Magnesite may contain some calcium, and so is generally not pure MgCO3. On the other side of the diagram, calcite often contains some magnesium, and so is not pure CaCO3. In the middle, dolomite, which has ideal formula CaMgCO3, may contain extra Mg or Ca.
The blue region in this diagram shows theoretically stable carbonate compositions. A large two-phase field (white) separates magnesite from dolomite, and another two-phase field separates dolomite from calcite. In nature, carbonate minerals never equilibrate at the high temperatures in the top part of this diagram. At lower temperatures, solid solutions are limited, and most magnesite, dolomite, and calcite are near to their stoichiometric compositions (meaning that they have compositions close to their ideal formulas). The atomic arrangements in dolomite and calcite are not quite the same, and, at temperature above 1,100 oC, dolomite may convert into a high-magnesium form of calcite.
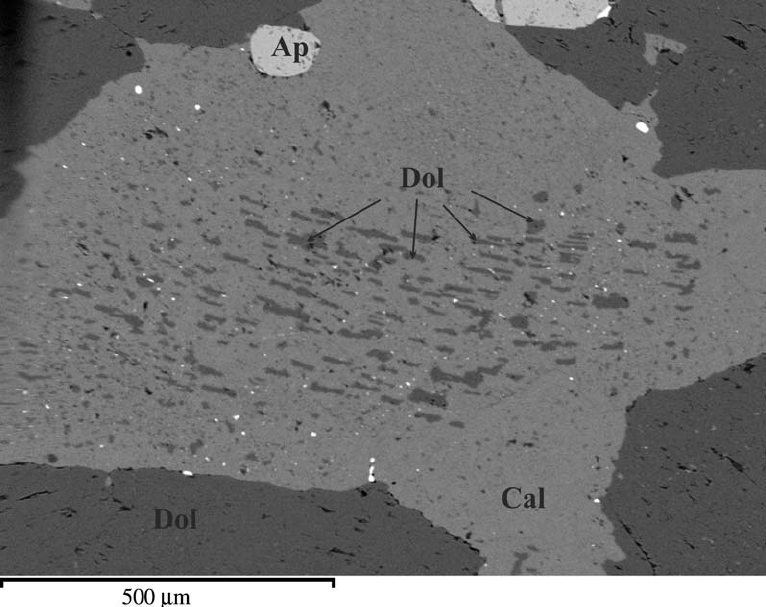
Figure 8.48 is an image obtained with a scanning electron microscope. The largest light-gray grain is calcite that contains dark-colored blebs of dolomite that have unmixed from the calcite. Note also the separate grains of dolomite (dark gray) around the calcite near the edges of this image. Some, mostly small, grains of white apatite (labeled Ap) are also in this view. At elevated temperature, before it exsolved, this grain had a composition that was nearly pure calcite with a small amount of dolomite in solution. So, its composition plotted close to the right side of Figure 8.47. During cooling, some of the dolomite component exsolved to produce the texture seen.
8.3.5 Combined Subsolidus and Supersolidus Diagrams
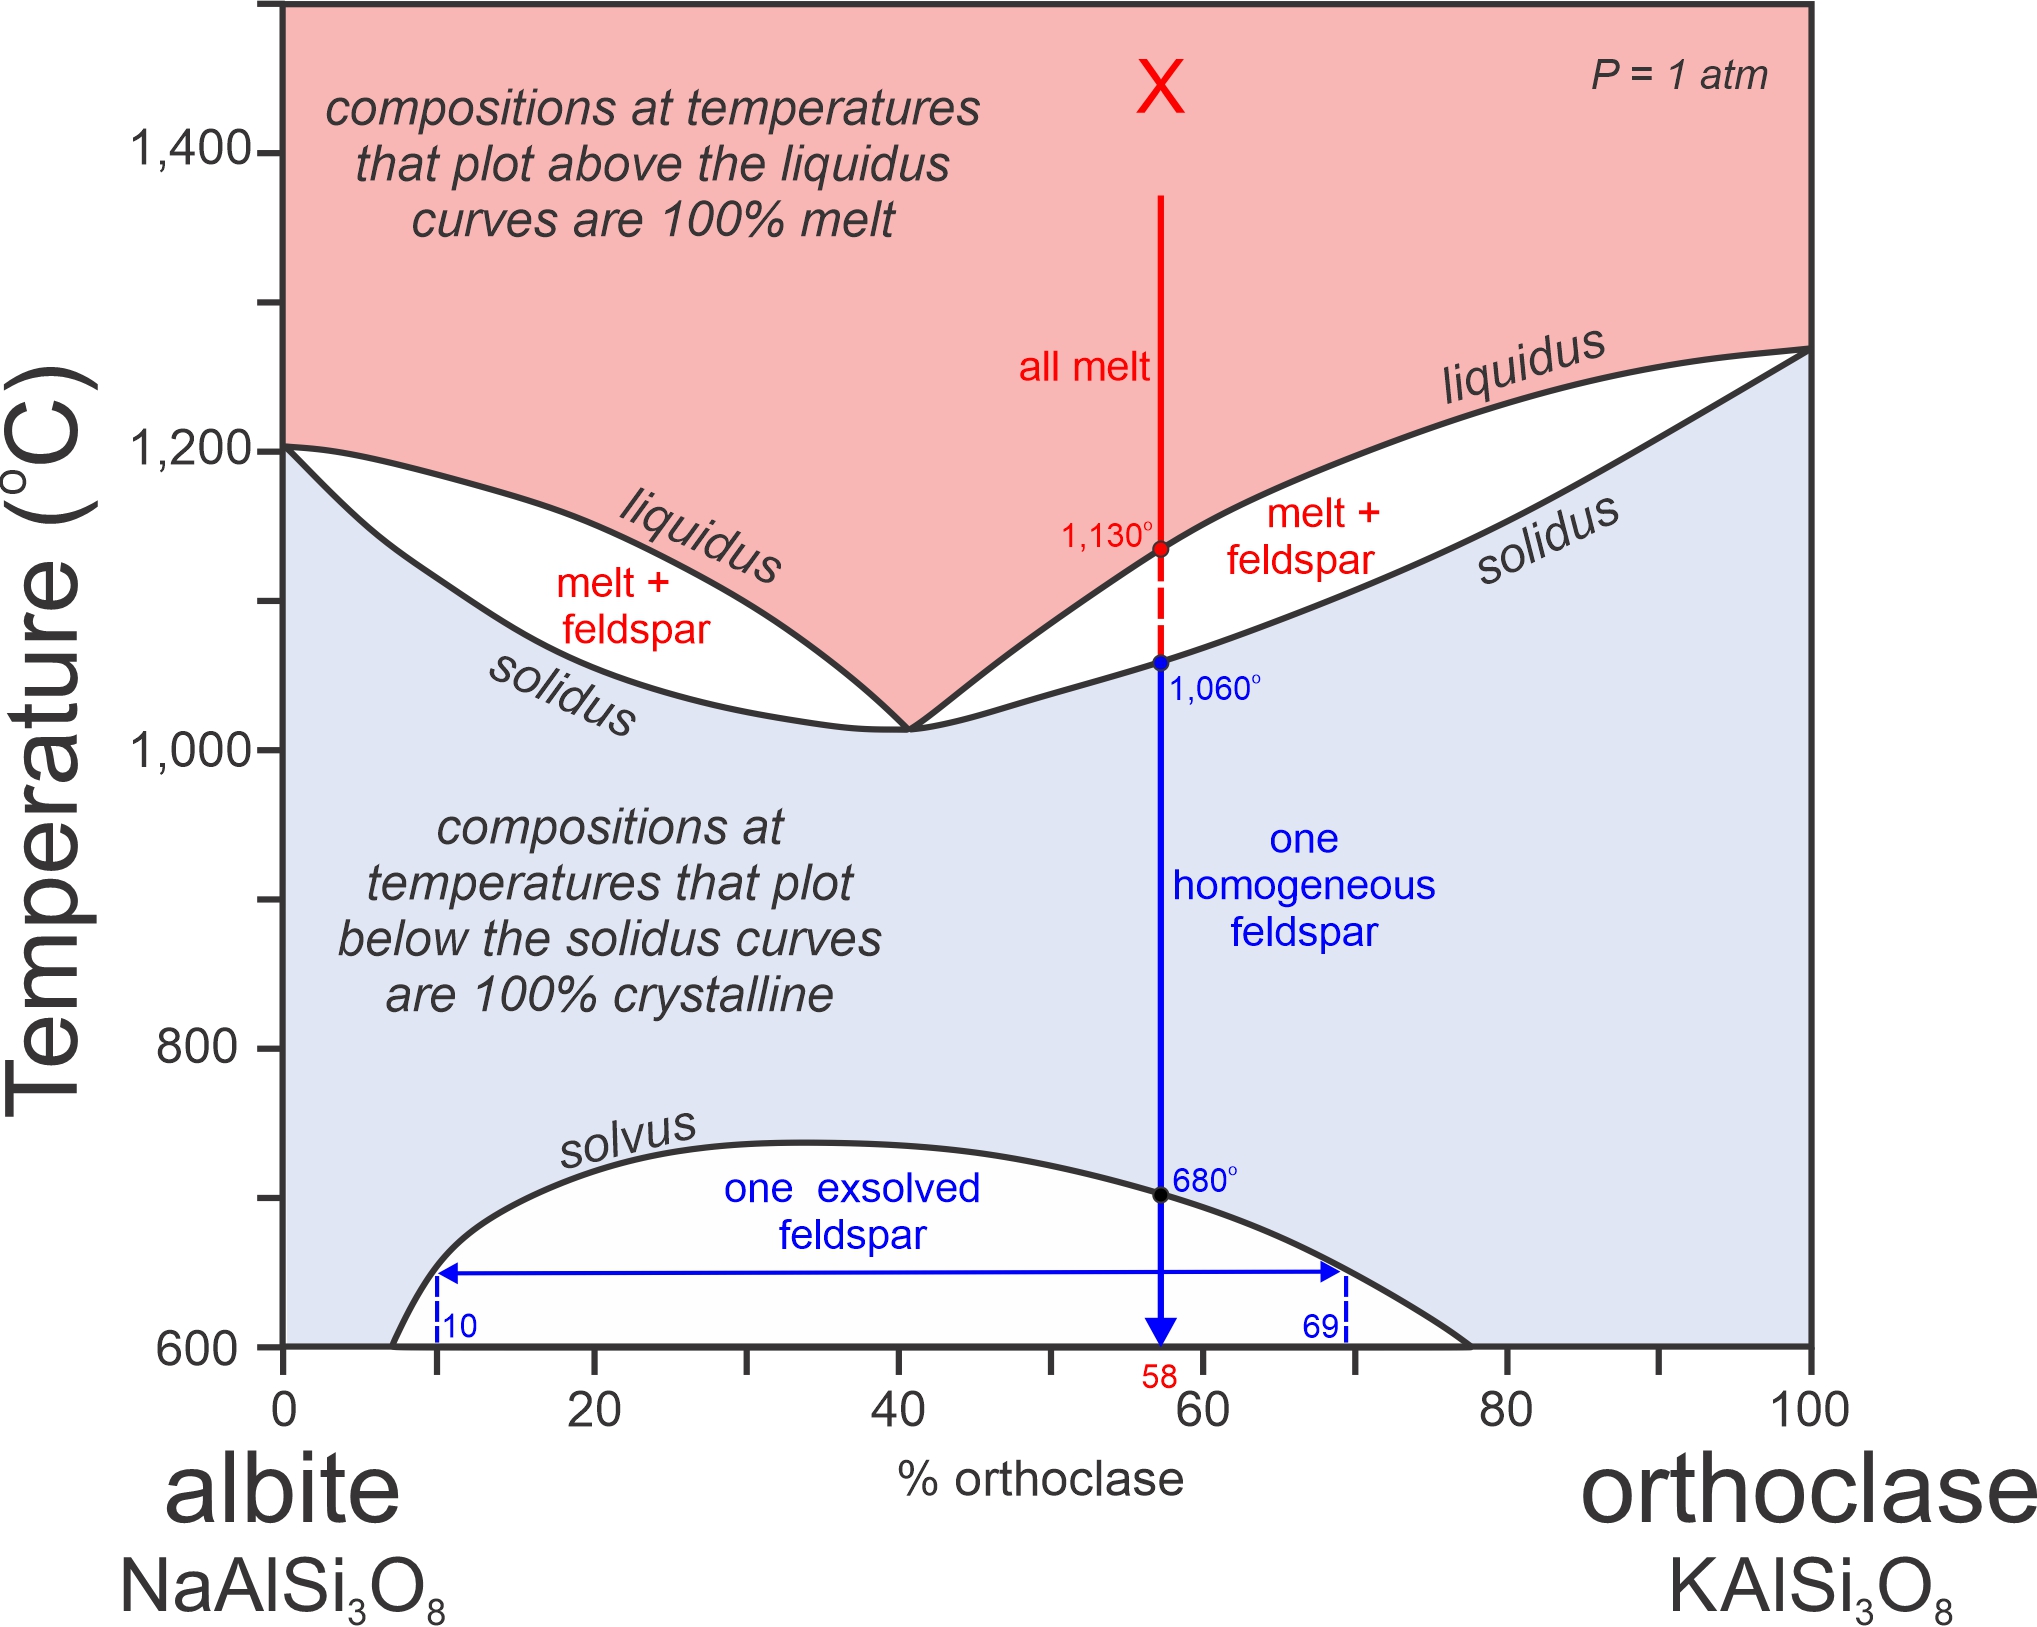
Figure 8.49 is another phase diagram for alkali feldspars. The bottom part of the diagram is the same as the subsolidus diagram in Figure 8.41, but this figure has a compressed temperature scale. Besides the solvus, this figure also depicts alkali feldspar liquidus and solidus relationships at 1,000-1,300 oC. So, this is a combined subsolidus and supersolidus diagram.
K-Na feldspar crystallization and melting involve two 2-phase fields (shown in white) at temperatures of 1,000 to 1,250 oC. They are sometimes described as looking like “rabbits ear’s” on a phase diagram. Each of the fields is similar to what we saw previously in the plagioclase (Figure 8.31) and olivine (Figure 8.35) systems. A vertical line for any composition will, in general, pass through one of the 2-phase fields.
Consider a melt with composition X (Ab42Or58). When it cools, it will begin to crystallize when temperature reaches the liquidus, at about 1,130 oC. The cooling path then enters a 2-phase field. Between the liquidus and solidus (1,130 to 1,060 oC), melt and feldspar – the two having different compositions – will coexist. We can read the compositions of the two from the diagram by drawing a horizontal line (in the appropriate white 2-phase field on the right side of the diagram) at any temperature of interest, and noting where it intersects the liquidus and solidus.
Below the solidus, a melt of any composition will become entirely crystalline. Composition X will crystallize as a single homogeneous feldspar with composition of Ab42Or58. Then with further cooling it will reach the solvus at 680 oC and the feldspar will unmix into two feldspars, one K-rich and one Na-rich, to produce perthite. With further cooling it will continue to unmix. At 650 oC, for example, the feldspar will contain exsolution lamellae with compositions Ab93Or07 and Ab23Or77 (compositions at the ends of the horizontal blue arrow at 650 oC in Figure 8.49). Unmixing, and the formation of perthite, occur for all melts except those that are very close to orthoclase or albite in composition – because those compositions will never get to the solvus.
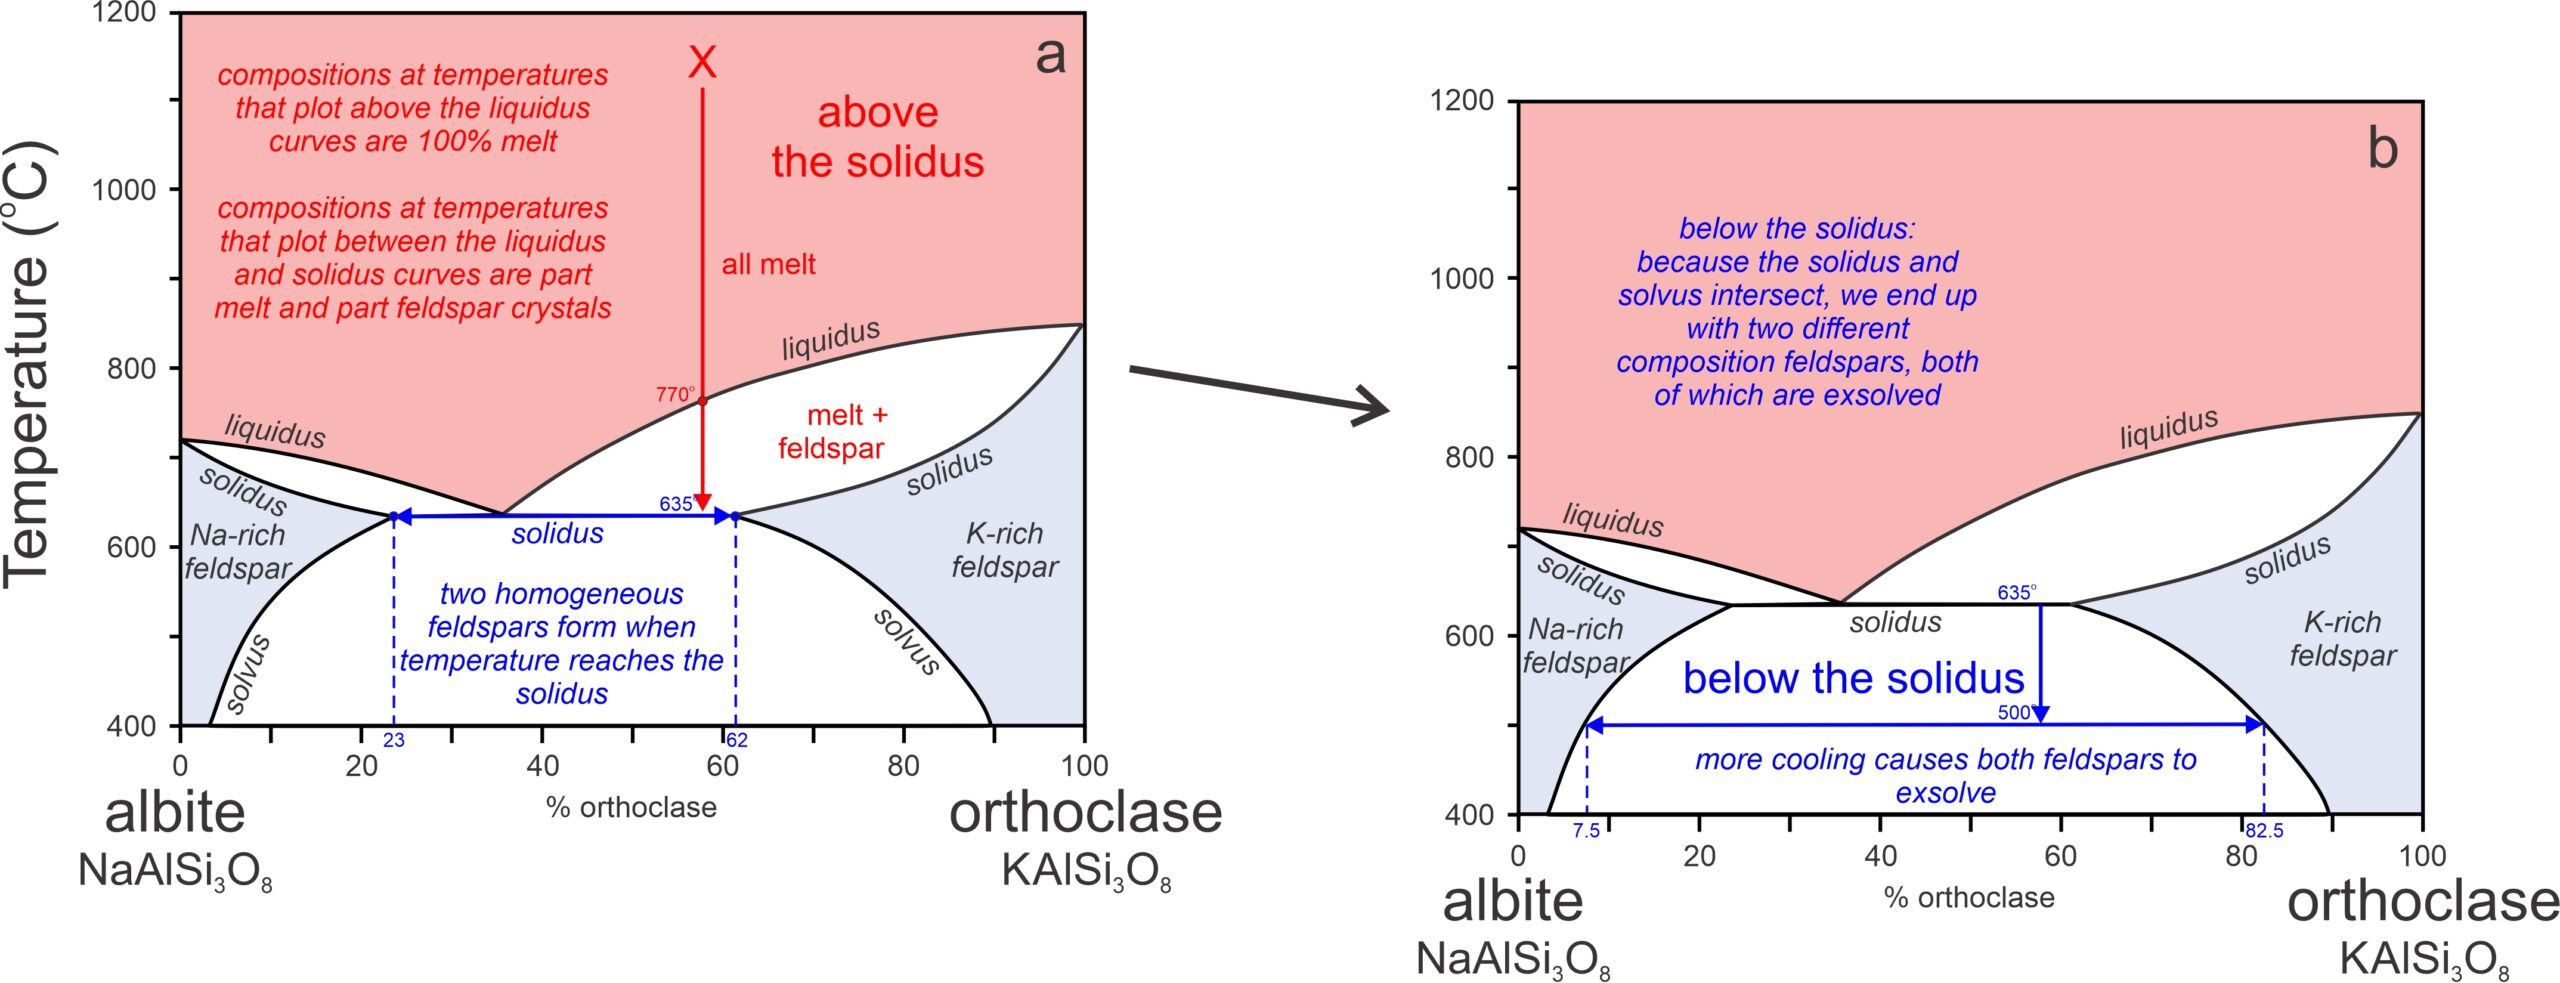
The phase diagram in Figure 8.49 was for 1 atmosphere pressure. At higher pressure, a curious thing occurs because the liquidus and solidus encroach on the solvus, as shown in Figure 8.50. A melt of intermediate composition will cool until it reaches the liquidus and enters a 2-phase field at 770oC (Figure 8.50a). Crystallization will continue with cooling and eventually the temperature will reach the solidus at 635oC. At the solidus temperature, the crystals and any remaining melt will react and all melt will disappear, leaving homogeneous crystals of two compositions: Ab77Or23 and Ab38Or62 (shown by blue vertical dashed lines in Figure 8.50a). With further cooling both compositions will exsolve to produce lamellae with compositions that follow the solvus to low temperature (Figure 8.50b). At 500 oC, for example, the lamellae will have compositions Ab92.5Or07.5 and Ab17.5Or82.5 (shown by the blue vertical dashed lines in Figure 8.50b). So, we will have K-rich perthite and Na-rich perthite (antiperthite). Thus, when we find two different composition perthitic feldspars in a rock, it tells us that a magma crystallized at relatively high pressure.
8.4 Ternary Systems
Previously in this chapter we looked at phase diagrams for 1- and 2-component systems. Suppose we wish to consider a 3-component system? To do this we use triangular diagrams called ternary composition diagrams, or simply ternary diagrams. Because they contain an extra component, ternary diagrams are often better models for real rocks than binary diagrams.
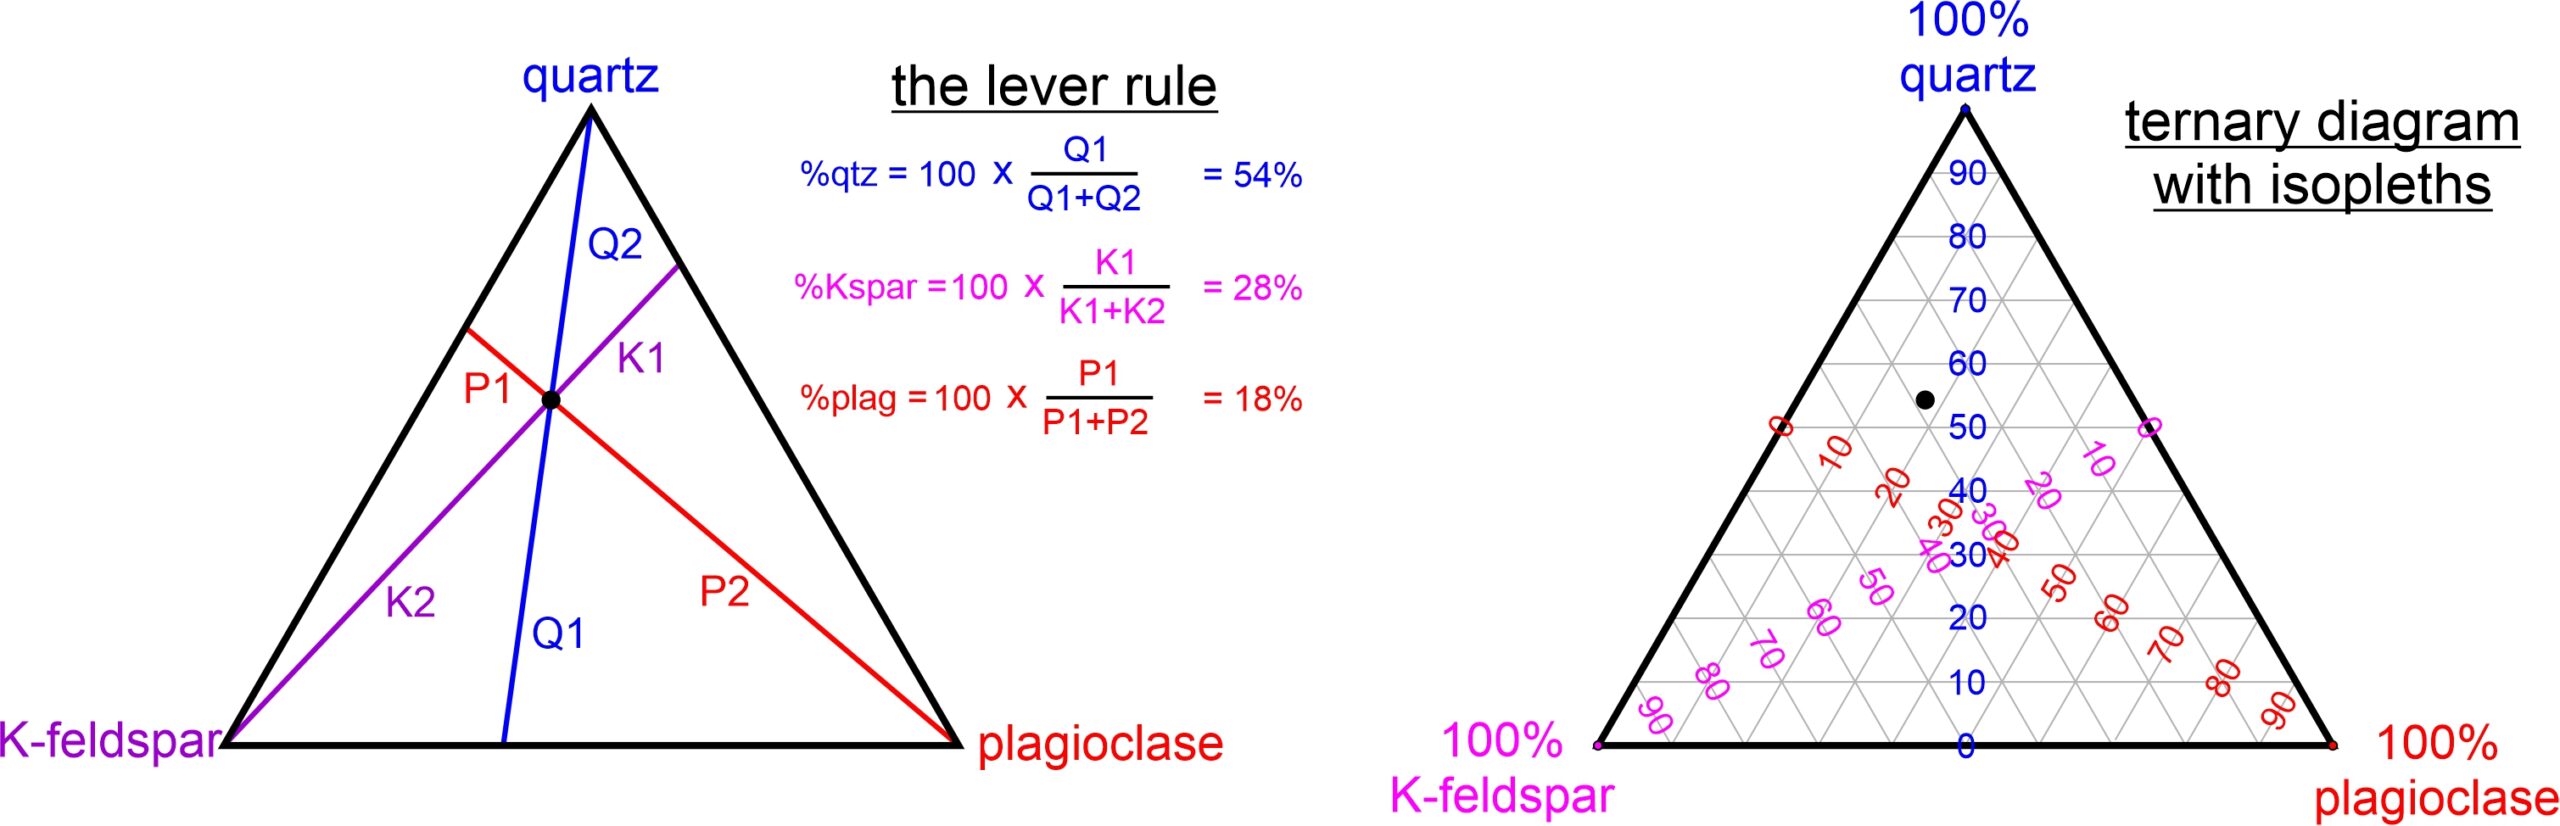
Figure 8.51 demonstrates how we plot compositions on ternary diagrams. The three components in both diagrams are quartz, K-feldspar, and plagioclase, and the black dot within each triangle represents a rock containing those minerals. To figure out how much of each mineral is in the rock, we can apply the lever rule. To do this, we use the lengths of the six labeled line segments in the left-hand drawing. The arithmetic, shown next to the diagram, tells us that the rock contains 54% quartz, 28% K-feldspar, and 18% plagioclase.
To simplify things, many ternary diagrams contain isopleths (lines of constant composition) for each component. The right-hand drawing in Figure 8.51 is an example. In ternary diagrams, rocks containing 0% quartz plot on the edge joining K-feldspar and plagioclase – on the bottom side of the triangle. 100% quartz plots at the top apex. Thus, the gray horizontal lines are lines of increasing quartz content from the bottom to the top of the triangle. Similar, but sloping, isopleths show K-feldspar and plagioclase contents. K-feldspar is 0% on the right side of the triangle and 100% at the bottom left corner. Plagioclase content is 0% on the left side of the triangle and 100% at the bottom right corner. We can read the composition at the black dot from the diagram using the isopleths (and interpolation) without having to do numerical calculations: 54% quartz, 28% K-feldspar, and 18% plagioclase.
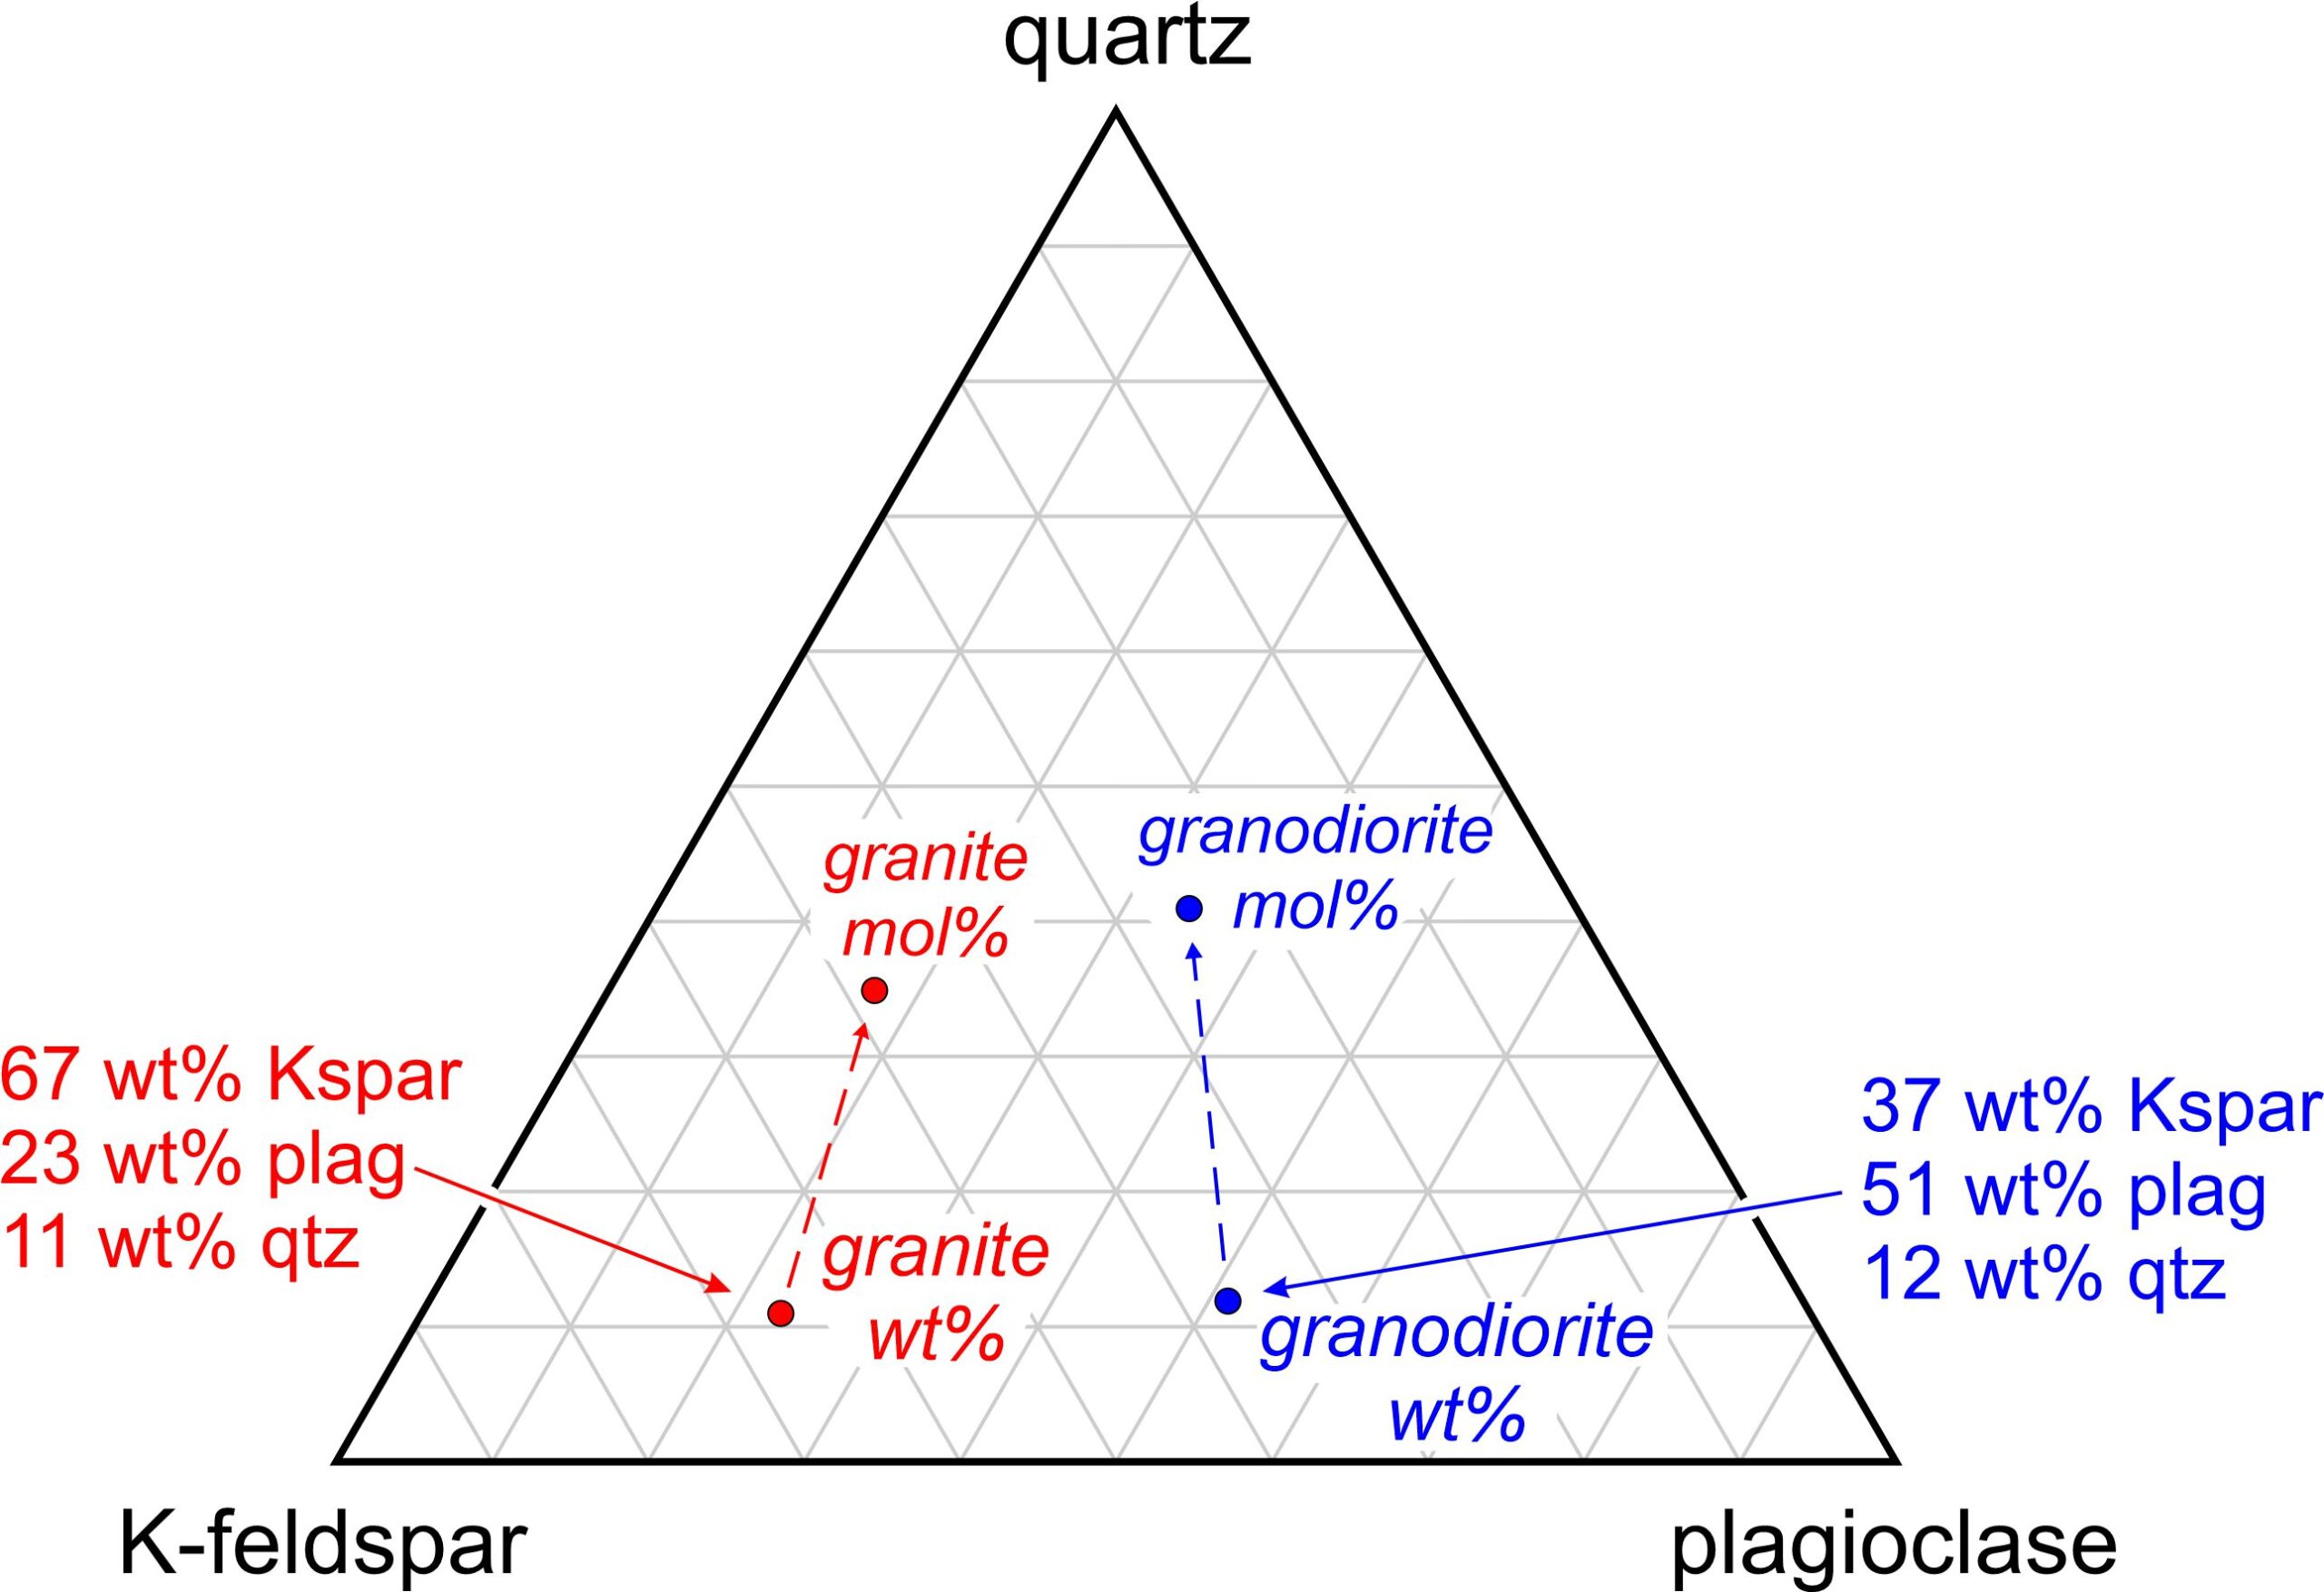
The components in Figure 8.52 are the same as the previous figure – quartz, K-feldspar, and plagioclase. These minerals dominate granites and granodiorites. The red and blue dots show typical mineralogies for each rock type.
But this is a good time to emphasize that weight % and mole % are not the same, and we could plot the rock compositions using either. When plotting rock (and magma) compositions on triangular diagrams we generally use weight % values. Note, however, that as seen in Figure 8.52, if we used mole % numbers, the dots for granite and granodiorite would shift toward the top of the diagram (because a mole of quartz weighs much less than a mole of K-feldspar or plagioclase). Their relative positions, however, would remain the same. Both rocks contain similar amounts of quartz, but the granodiorite has more plagioclase than the granite.
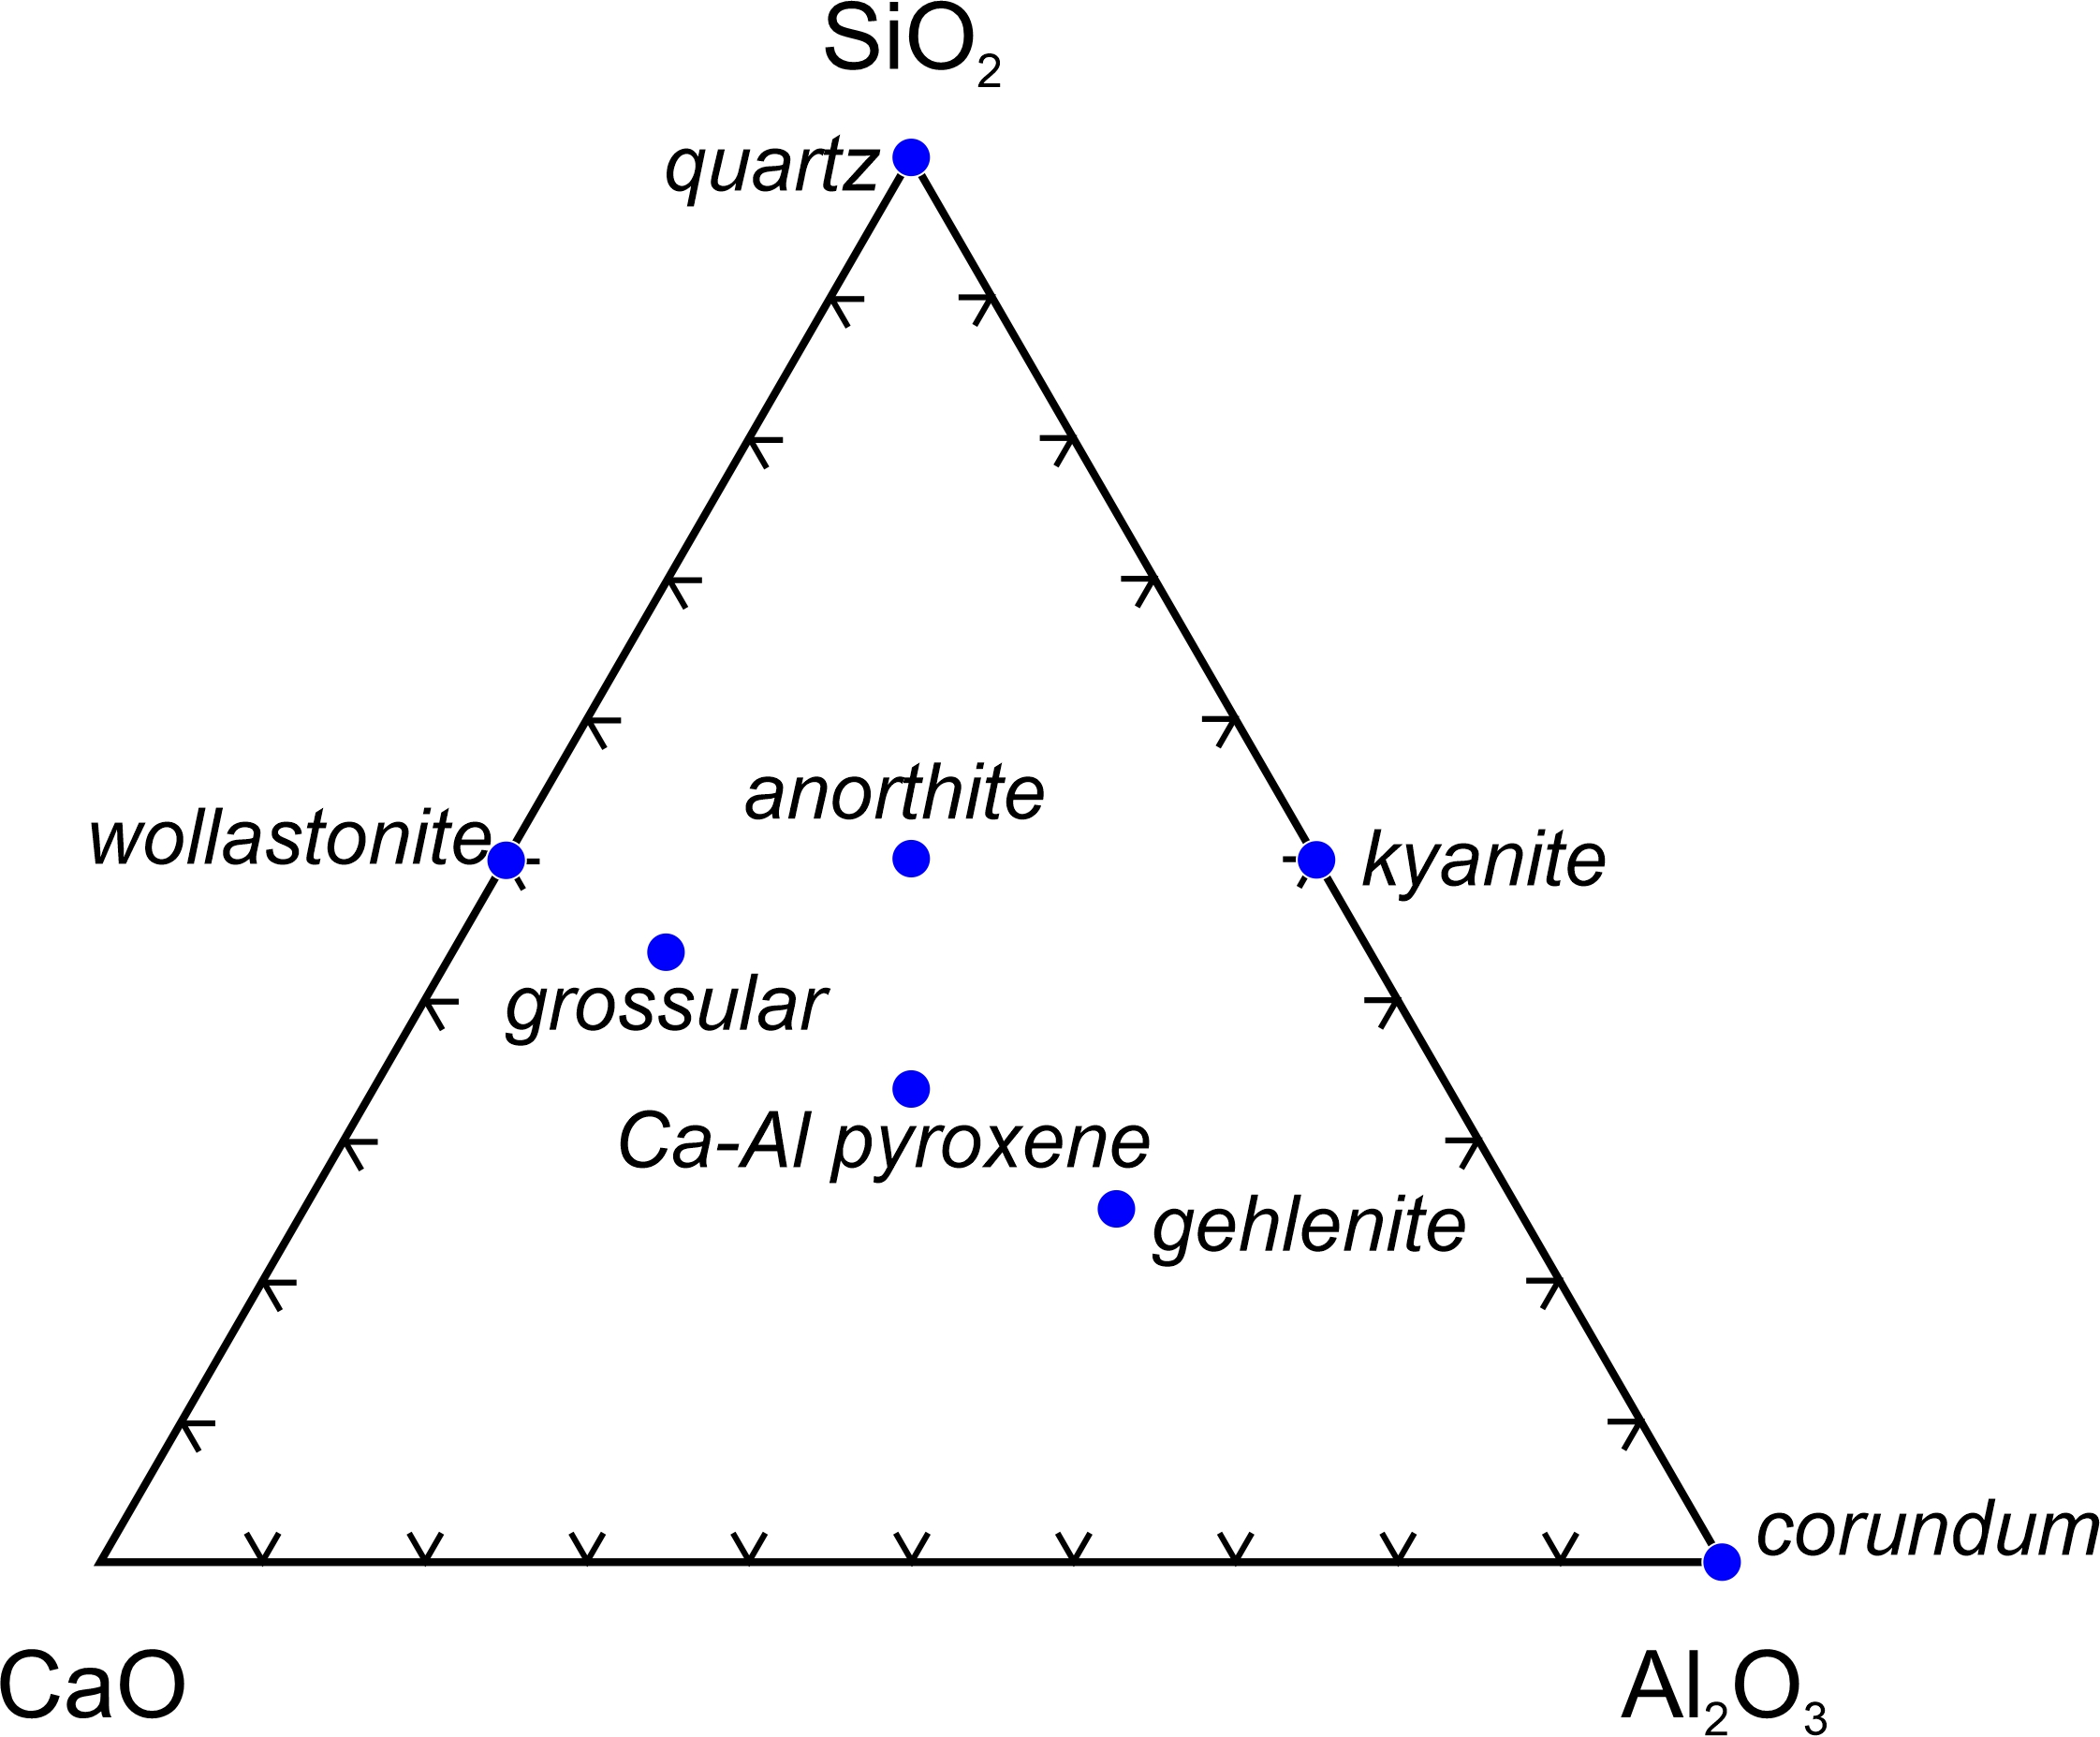
The triangular diagram in Figure 8.53 shows another way we use ternary diagrams – to compare mineral compositions. The figure, which compares the compositions of eight minerals, has oxide components at the corners. For plotting mineral compositions, we use mole % values, not weight %. We do this because minerals are compounds, which means that they contain integer numbers of oxides (and of elements) in their formulas. Thus, a mole of a mineral contains integer numbers of moles of oxides (and of elements) and using mole values makes sense. (This is not true for rock or magma compositions – they never contain integer numbers of moles of components, no matter the components we use.) Note that Figure 8.53 contains tick marks on the sides of the triangle instead of isopleths. This is common and reduces clutter in the triangle interior. The tick marks help estimate component % values when needed.
(For the rest of this chapter we will mostly be using weight % diagrams but will return to mole % in later chapters when we discuss minerals in metamorphic rocks.)
8.4.1 Ternary Phase Diagrams
We can use ternary phase diagrams to show crystallization temperatures for magmas containing three components. Figure 8.54 depicts a hypothetical liquidus surface for a system involving components A, B, and C. The drawing on the left is an oblique view (three dimensions) and the height above the triangle base is proportional to liquidus temperature for different compositions.
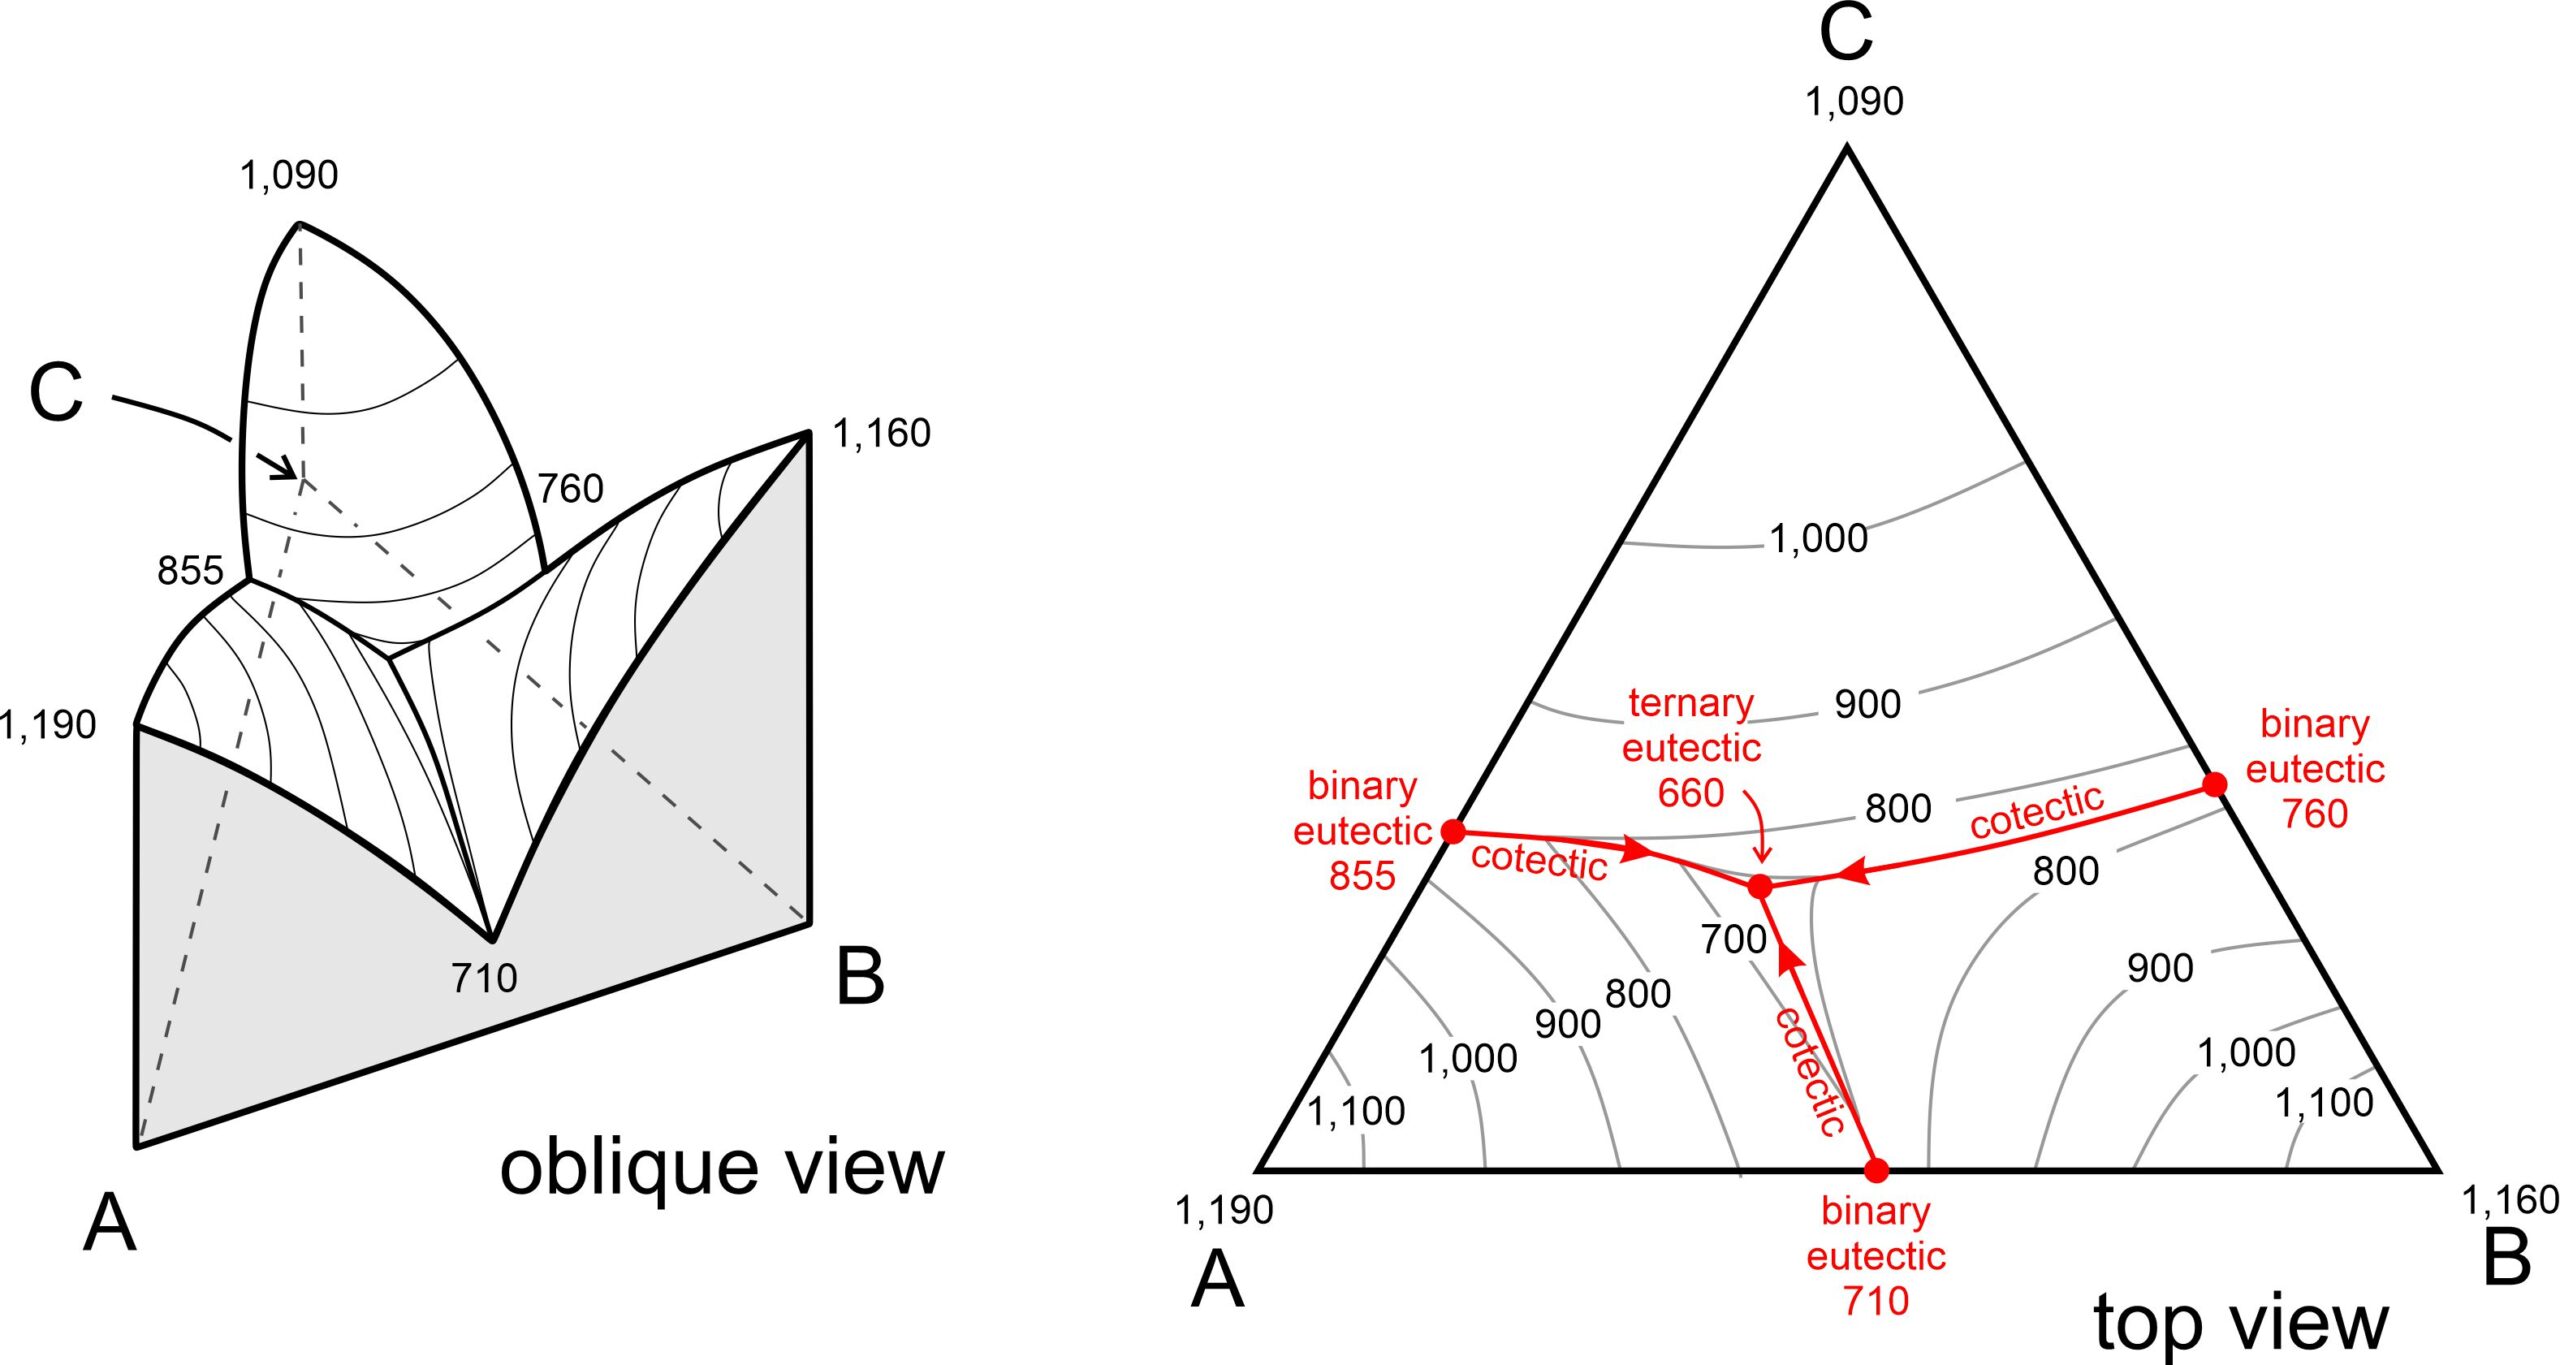
Figure 8.54 shows that magmas that are 100% A, B, and C crystallize at 1,190, 1,160, and 1,090 oC, respectively. Temperature decreases from the corners to binary eutectics on each side of the diagram (at 710, 760, and 855 oC). The lowest temperature in the diagram is at the ternary eutectic, near the center, where lines from each of the binary eutectics intersect. We call the lines that connect the binary eutectics to the ternary eutectic, cotectics. Overall, the temperature surface is like topography with three mountains (at the corners) and river valleys between them. The rivers flow downhill and meet at the lowest point in the diagram.
Because three-dimensional drawings are sometimes hard to see, and because they vary with perspective, we typically draft two-dimensional phase diagrams with temperature contours – like the drawing on the right side of Figure 8.54. The temperatures are the same as in the oblique view – they are the liquidus temperatures. Note the binary eutectics on the three sides at 710, 760, and 855 oC. The ternary eutectic is at 660 oC, a lower temperature. Temperature always decreases along cotectics from any binary eutectic to the ternary eutectic because melting and crystallization temperatures are lower when a third component is added to a two-component system. Sometimes, ternary phase diagrams are more complicated than the one shown. And sometimes we omit temperature contours. To help make things clear we often put arrowheads pointing down-temperature on cotectic curves (as we have in the right-hand drawing of Figure 8.54).
Just as we saw for two-component systems, the (ternary) eutectic temperature is the lowest temperature that a magma containing components A, B, and C can reach without beginning to crystallize. And the ternary eutectic composition is the composition of the last possible drop of melt when a magma containing A, B, and C crystallizes. Conversely, if we heat a rock containing components A, B, and C, it will begin melting at the eutectic temperature and the first drop of melt will have the eutectic composition.
8.4.1.1 The Anorthite – Diopside – Forsterite System
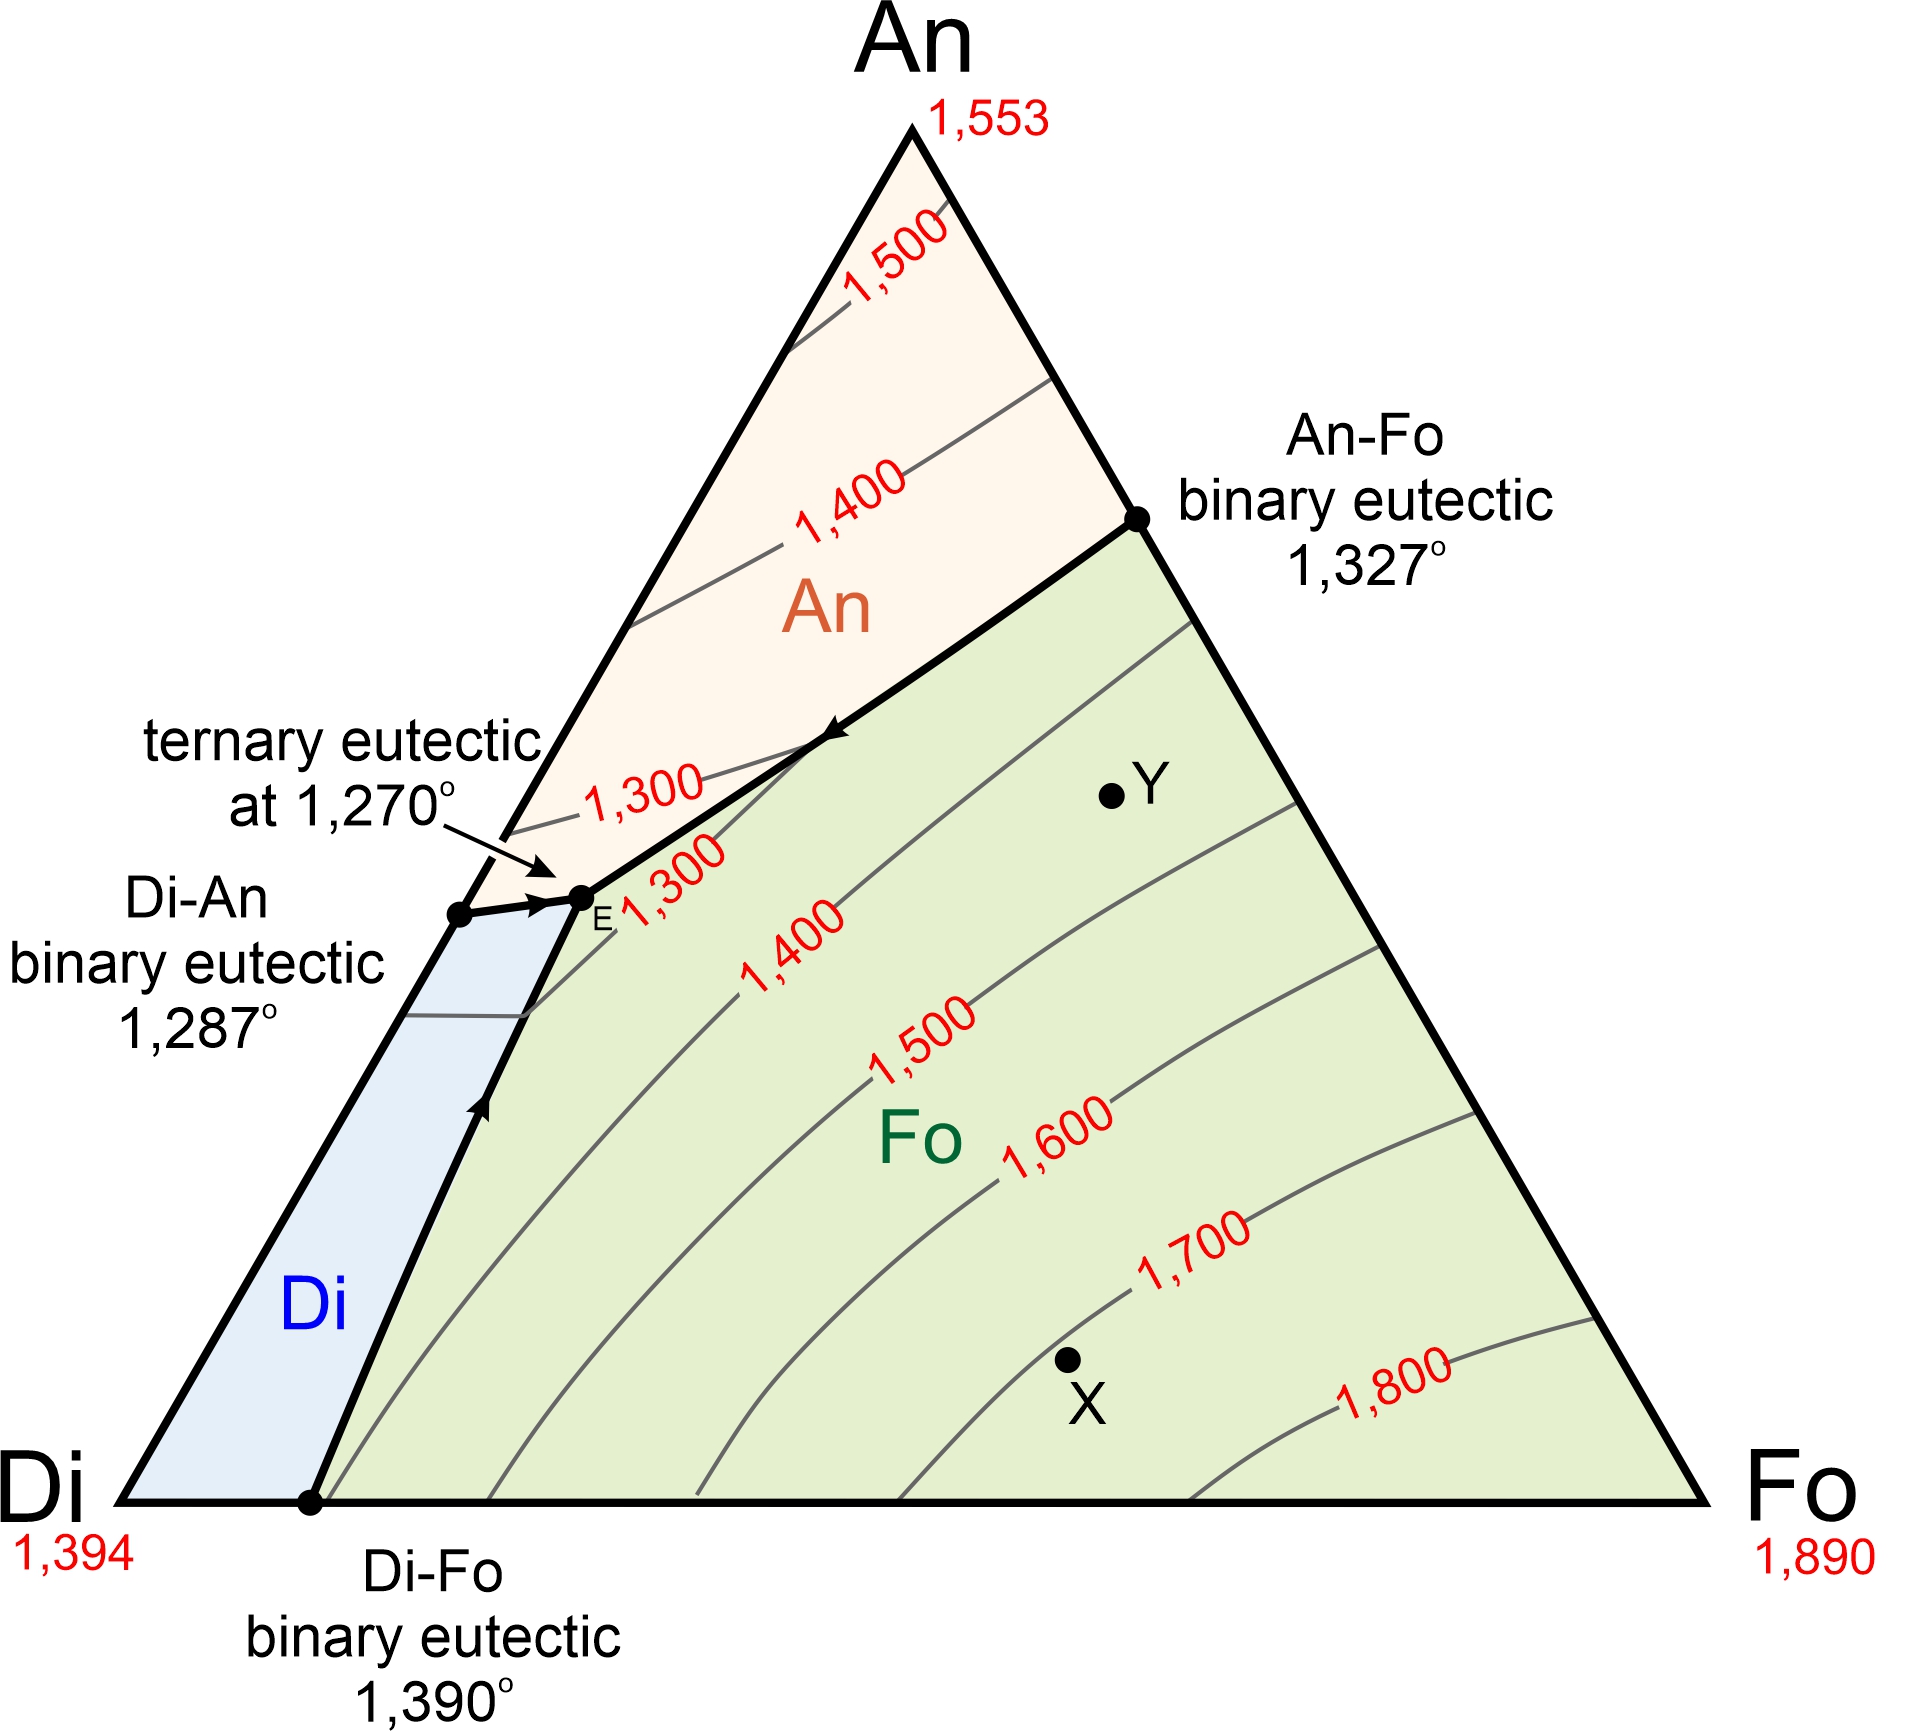
Figure 8.55 is a simplified diagram showing the temperatures at which crystallization begins (liquidus temperatures) for magmas with compositions equivalent to combinations of anorthite (CaAl2Si2O8), diopside (CaMgSi2O6), and forsterite (Mg2SiO4). The anorthite-diopside-forsterite system is a good model for crystallization of basaltic magma. That is one reason we use ternary diagrams – because they better approximate what takes place when magmas crystallize than do binary diagrams.
We often use mineral names, and abbreviations, for the components, even when we are talking about a melt and no minerals are present. In part, we do this because if a rock stays in equilibrium during cooling, the rock that ultimately forms will contain the minerals. So, the ternary eutectic melt composition, shown by the black dot at 1,270 oC in Figure 8.55 is 82% diopside, 44% anorthite, and 7% forsterite (Di48An44Fo07).
Figure 8.55, like all the ternary diagrams we are seeing in this chapter, is for 1 atmosphere pressure. The diagram tells us that, at 1 atmosphere, the composition labeled X (in Figure 8.55) will start to crystallize at 1,710 oC, and the composition labeled Y at 1,451 oC. Both compositions will crystallize until temperature reaches the eutectic at 1,270 oC. The last drop of melt will have the eutectic composition Di48An44Fo07. Liquidus and solidus temperatures for other pressures will be different, generally increasing with increasing pressure. Eutectic compositions will be different too.
When we considered binary phase diagrams earlier in this chapter, we found that minerals crystallize in a predictable order that may be different for different composition magmas. One mineral forms at the liquidus temperature and a second one may form when the temperature reaches a peritectic or a eutectic. The eutectic temperature on a binary diagram is the only temperature where two minerals can crystallize simultaneously.
Ternary systems are similar to binary systems but more minerals can crystallize simultaneously. A single mineral will form at the liquidus temperature. With further cooling it may be joined by a second mineral if melt composition reaches a cotectic, and the two will crystallize together. Eventually, when temperature reaches a ternary peritectic or a ternary eutectic, a third mineral may form. At the eutectic temperature three minerals can crystallize together. As with binary diagrams, the order in which minerals crystallize depends on magma composition.

In Figure 8.56, cotectics divide the ternary diagram into three fields, labeled with mineral abbreviations (Di, An, and Fo) and having different colors. If a melt has composition that plots in the forsterite (Fo) field, for example compositions X and Y in Figure 8.56, forsterite will be the first mineral to crystallize. If a melt has composition that plots in the diopside field, diopside will crystallize first. And if the melt has composition that plots in the anorthite field, anorthite will crystallize first.
Figure 8.56 depicts two sample paths that a magma may follow as it cools and crystallizes. Consider, for example, a magma with composition X. As seen in Figure 8.56, it will begin to crystallize forsterite at 1,710 oC (point 1). For clarity, temperature contours have been omitted from this diagram but you can read the temperatures from Figure 8.55, if you wish.
As crystallization removes forsterite from the melt, melt composition must move away from the Fo corner of the diagram. The composition will follow the red arrow, eventually reaching the cotectic between the Fo and Di fields at point 2 at 1,355 oC (point 2). With further cooling, diopside and forsterite will crystallize together. The melt composition will move down the cotectic to the eutectic at point 3 and 1,270 oC. At the eutectic, anorthite will begin to form along with the other two minerals. The remaining melt will crystallize before temperature can drop lower. Cooling of composition Y will be similar, except that the order of crystallization will be forsterite, followed by anorthite, followed by diopside at the eutectic. A red arrow in Figure 8.56 shows the path that melt composition follows.
Although Figure 8.56 contains no examples, if a magma has composition that plots in the Di field, the order of crystallization will be diopside-anorthite-forsterite or diopside-forsterite-anorthite. If a magma has composition that plots in the An field, the order of crystallization will be anorthite-forsterite-diopside or anorthite-diopside-forsterite. No matter the melt composition, final crystallization of three minerals will occur at the eutectic.
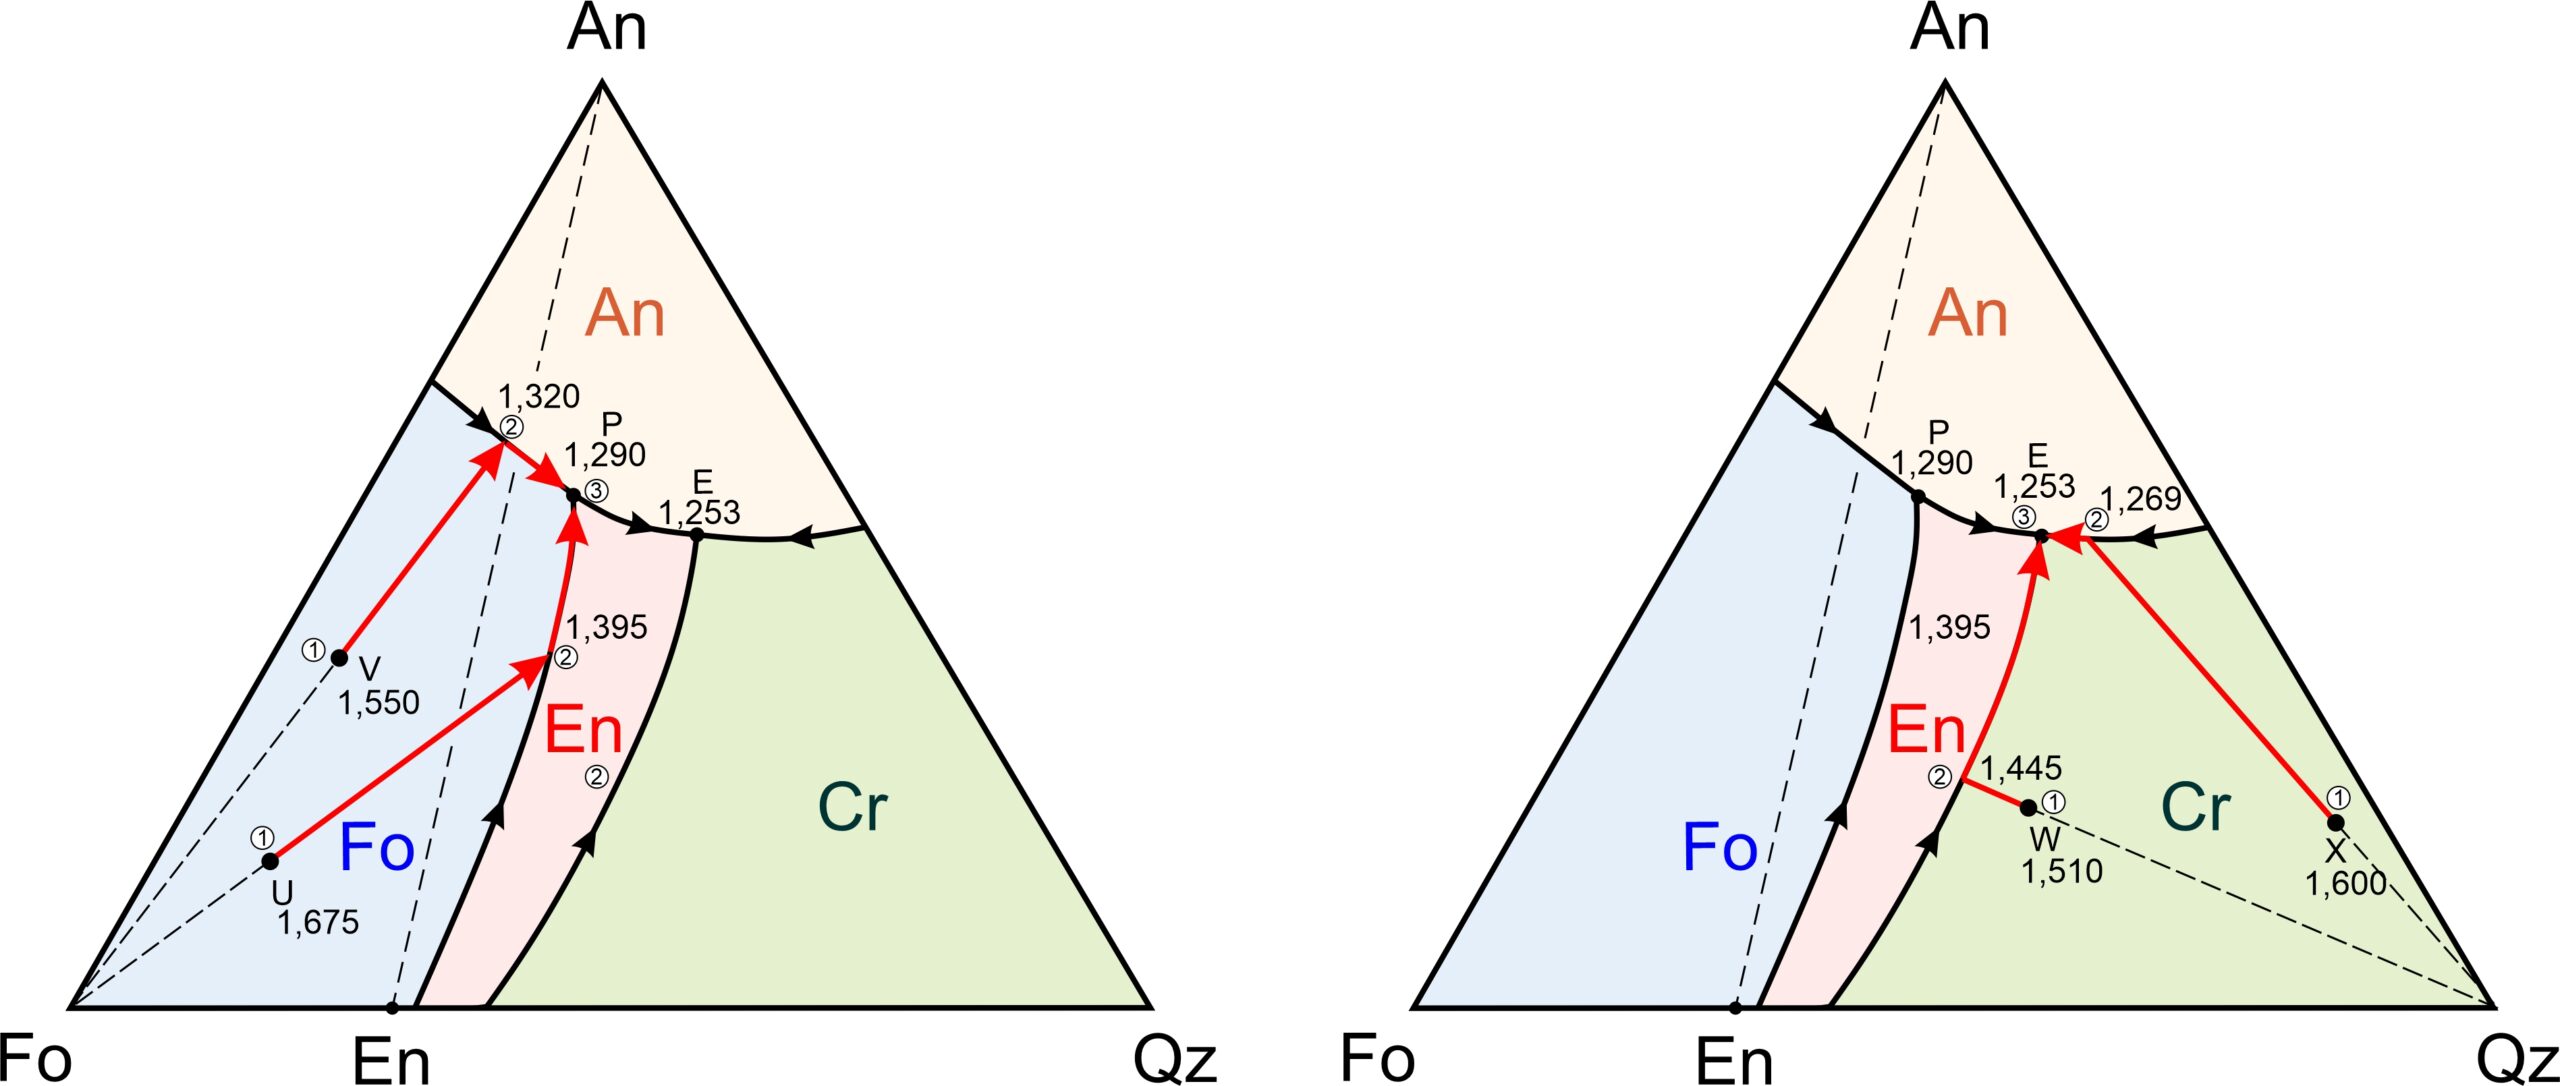
8.4.1.2 The Forsterite – Anorthite – Quartz System
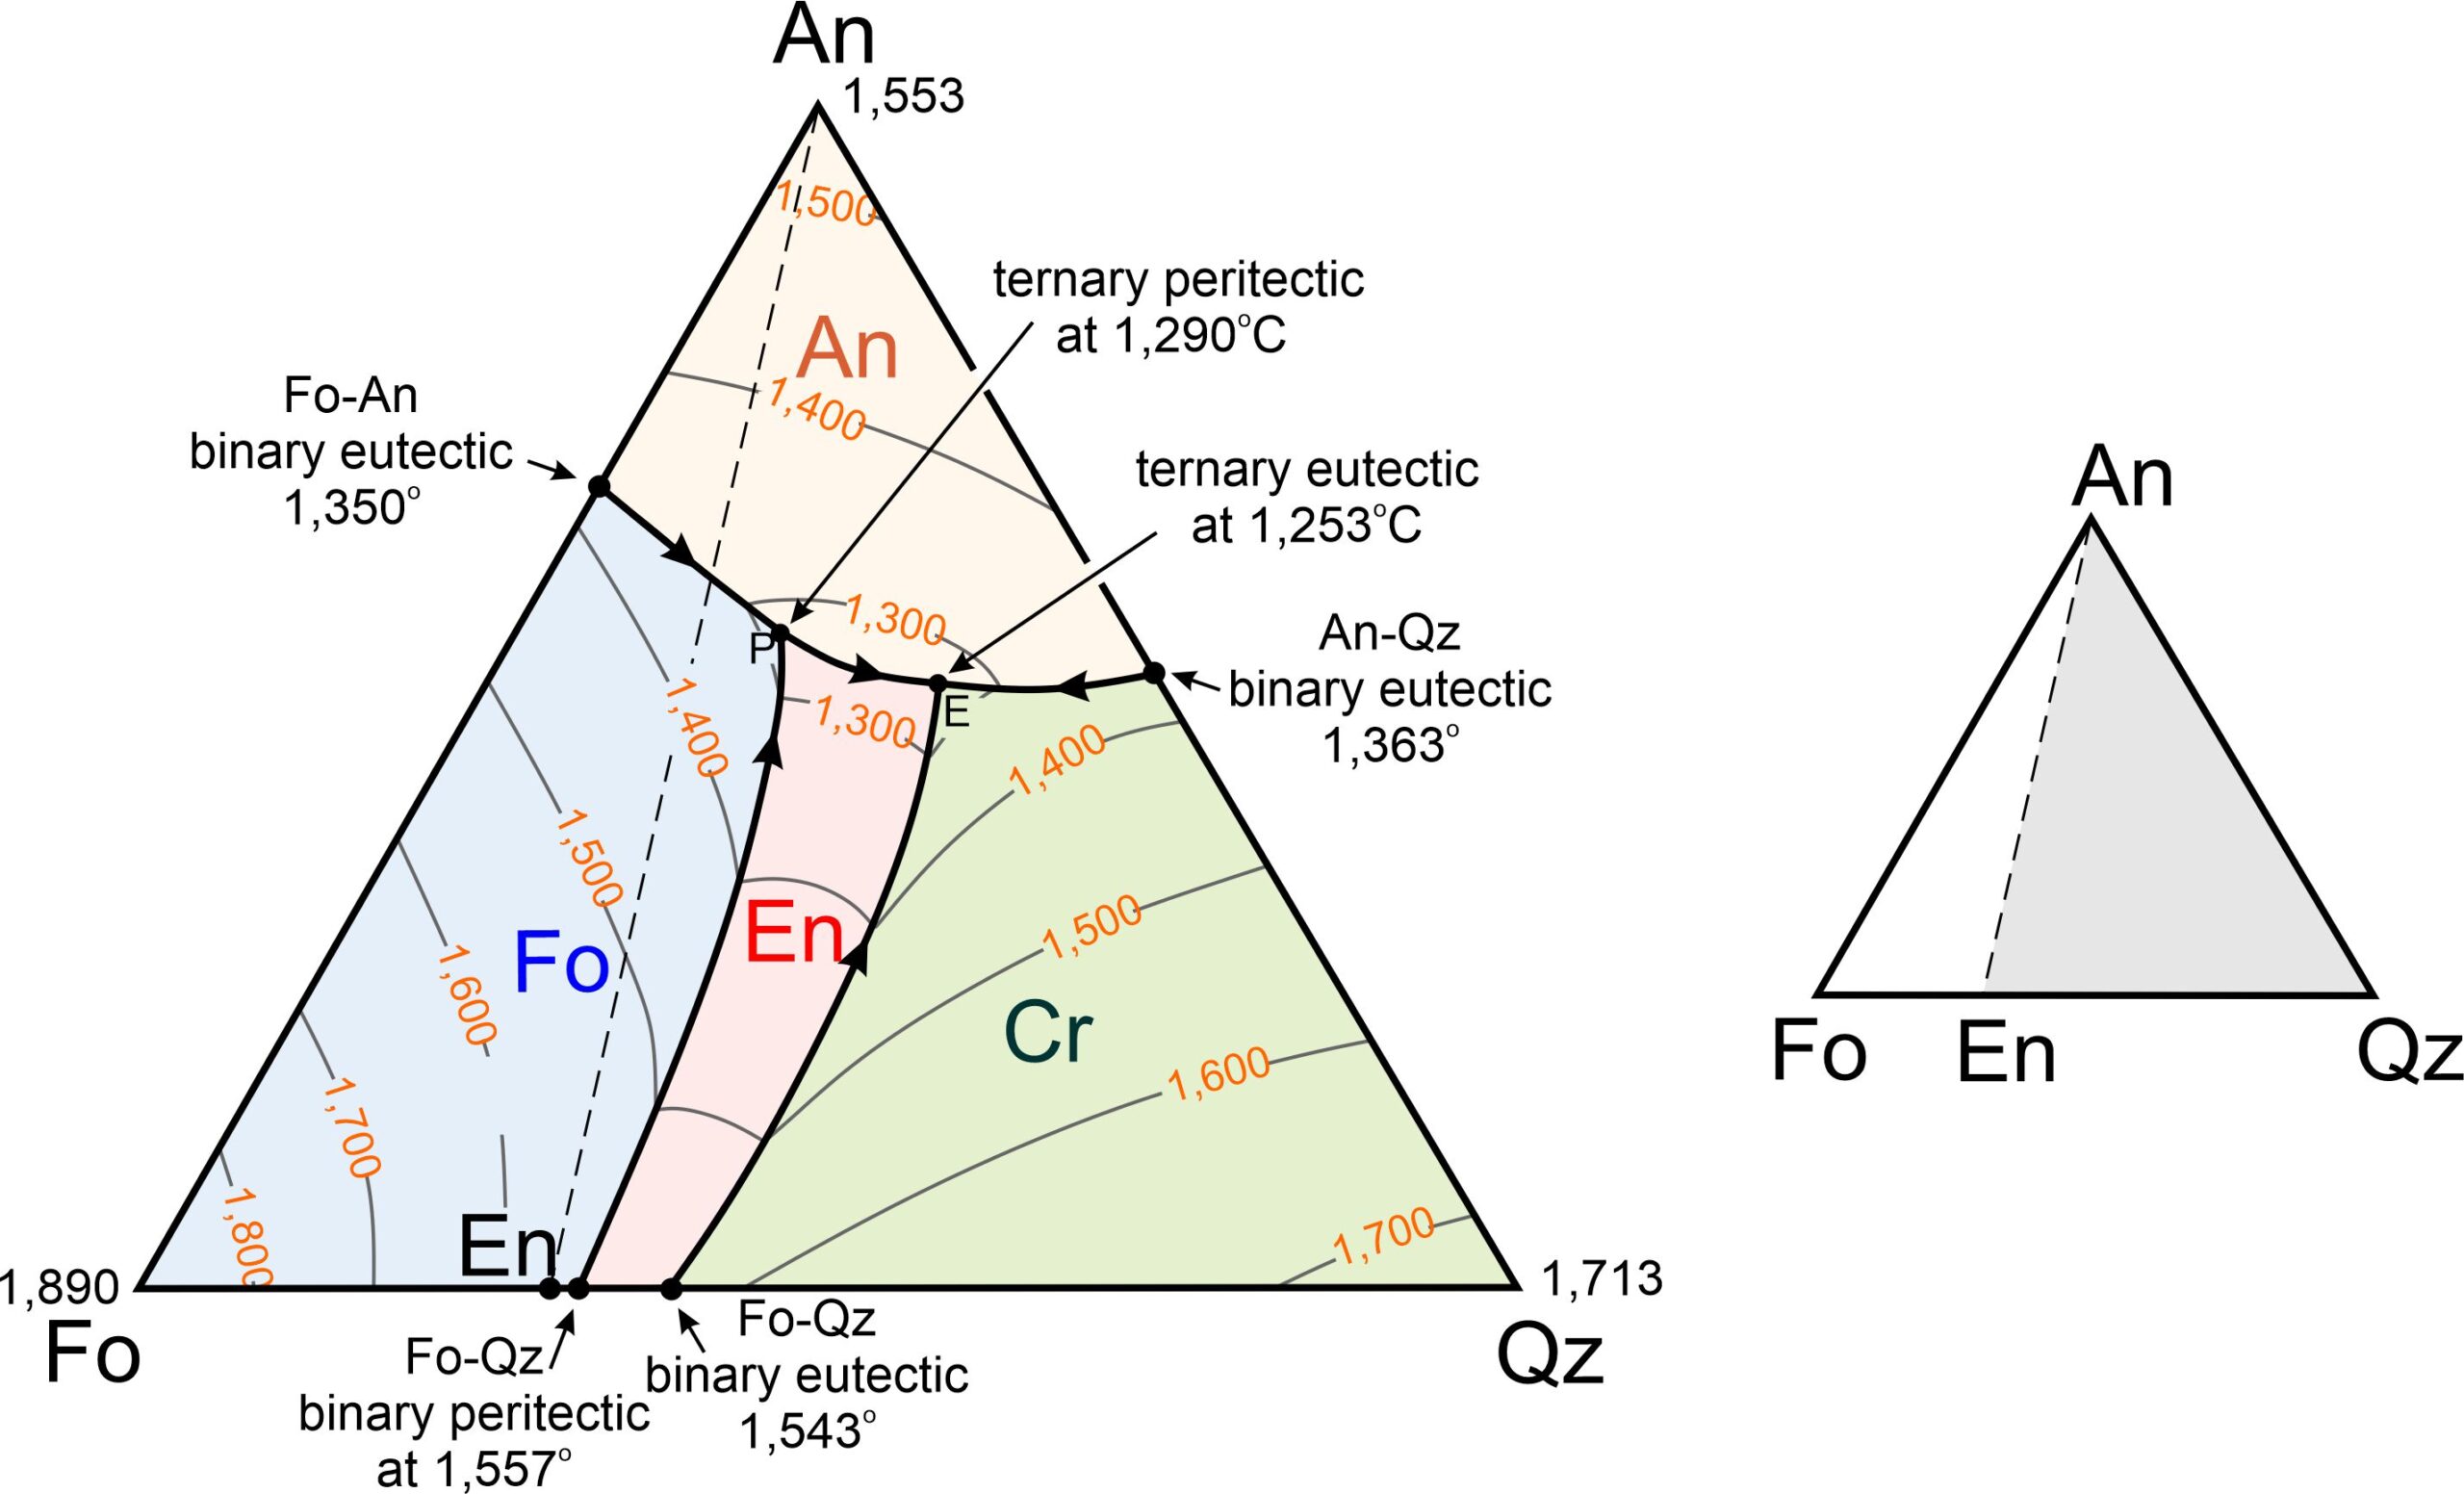
The ternary diagram in Figure 8.57 shows the forsterite-anorthite-quartz system. We have omitted some complications from this diagram but, even so, it is more complicated than the anorthite-diopside-forsterite diagram we just considered. A trivial difference is that, although we list the component at the bottom right corner as quartz (Qz), cristobalite (another SiO2 polymorph) crystallizes at the liquidus. It is only after significant cooling that the cristobalite turns into quartz. A more significant difference is that enstatite plots between forsterite and quartz on the bottom of the ternary. And this means, as we saw previously (Figure 8.29), that the binary forsterite-quartz system includes both a peritectic and a eutectic.
The forsterite-anorthite-quartz diagram in Figure 8.57 contains four fields with different colors. Abbreviation labels show the mineral that will crystalize first for melt compositions that plot in each field: anorthite, forsterite, enstatite, or cristobalite. The interior of the triangle contains a ternary peritectic at 1,290 oC and a ternary eutectic at 1,253 oC. As with binary diagrams, the peritectic temperature is higher than the eutectic temperature. A cotectic separates the Fo and En fields, running from the Fo-Qz binary peritectic to the ternary peritectic. A different cotectic separates the En and Cr fields, running from the Fo-Qz eutectic to the ternary eutectic.
We have four minerals in the forsterite-anorthite-quartz system, and in contrast with the anorthite-diopside-forsterite system (Figures 8.55 and 8.56), there are two possible final mineral assemblages. The smaller right-hand drawing in Figure 8.57 shows that the ternary conveniently divides into two parts. If a magma has composition that plots in the white An-Fo-En triangle to the left of the dashed line, the mineral assemblage after temperature drops below the solidus will be anorthite, forsterite, and enstatite. These minerals can only crystallize together at the ternary peritectic, where the anorthite, forsterite, and enstatite fields touch each other. So, crystallization will end at 1,290 oC (the peritectic temperature) and melt composition will never reach the eutectic.
If a magma has composition that plots to the right of the dashed line in Figure 8.57, in the gray An-En-Qz triangle (right side of Figure 8.57), the assemblage after the temperature drops below the solidus will be anorthite, enstatite, and cristobalite (or, eventually, quartz with even more cooling). These minerals can only form together at the ternary eutectic, where the anorthite, enstatite, and cristobalite fields touch each other. So, the final drop of melt will disappear at 1,253 oC and have the eutectic composition.
Figure 8.58 depicts examples of cooling paths for four magmas (labeled U, V, W, and X) having compositions equivalent to combinations of forsterite, anorthite, and quartz. They will begin crystallizing at 1,675, 1,550, 1,510, and 1,600 oC, respectively (refer to Figure 8.57, the previous figure to see temperature contours.)

Compositions U and V (left triangle in Figure 8.58) plot in the forsterite field, so, for these magmas, forsterite crystallizes first. Enstatite crystallizes second for composition U and anorthite second for composition V. For both compositions U and V, melt compositions will follow the red arrows from point 1 to point 2 to point 3 (the peritectic) where anorthite will begin to form. The three minerals will crystallize simultaneously until all the melt is gone. Only then will temperature drop below 1,290 oC, the peritectic temperature. The final mineral assemblage for both compositions will contain forsterite, anorthite, and enstatite, but the relative proportions of these minerals vary with melt composition.
For compositions W and X (right triangle in Figure 8.58), cristobalite will form first, followed either by enstatite or by anorthite. For both compositions W and X, melt compositions will follow the red arrows from point 1 to point 2 to point 3. At point 3, the eutectic, cristobalite, enstatite, and anorthite will crystallize together. Temperature will only drop below 1,253 oC when all melt is gone.
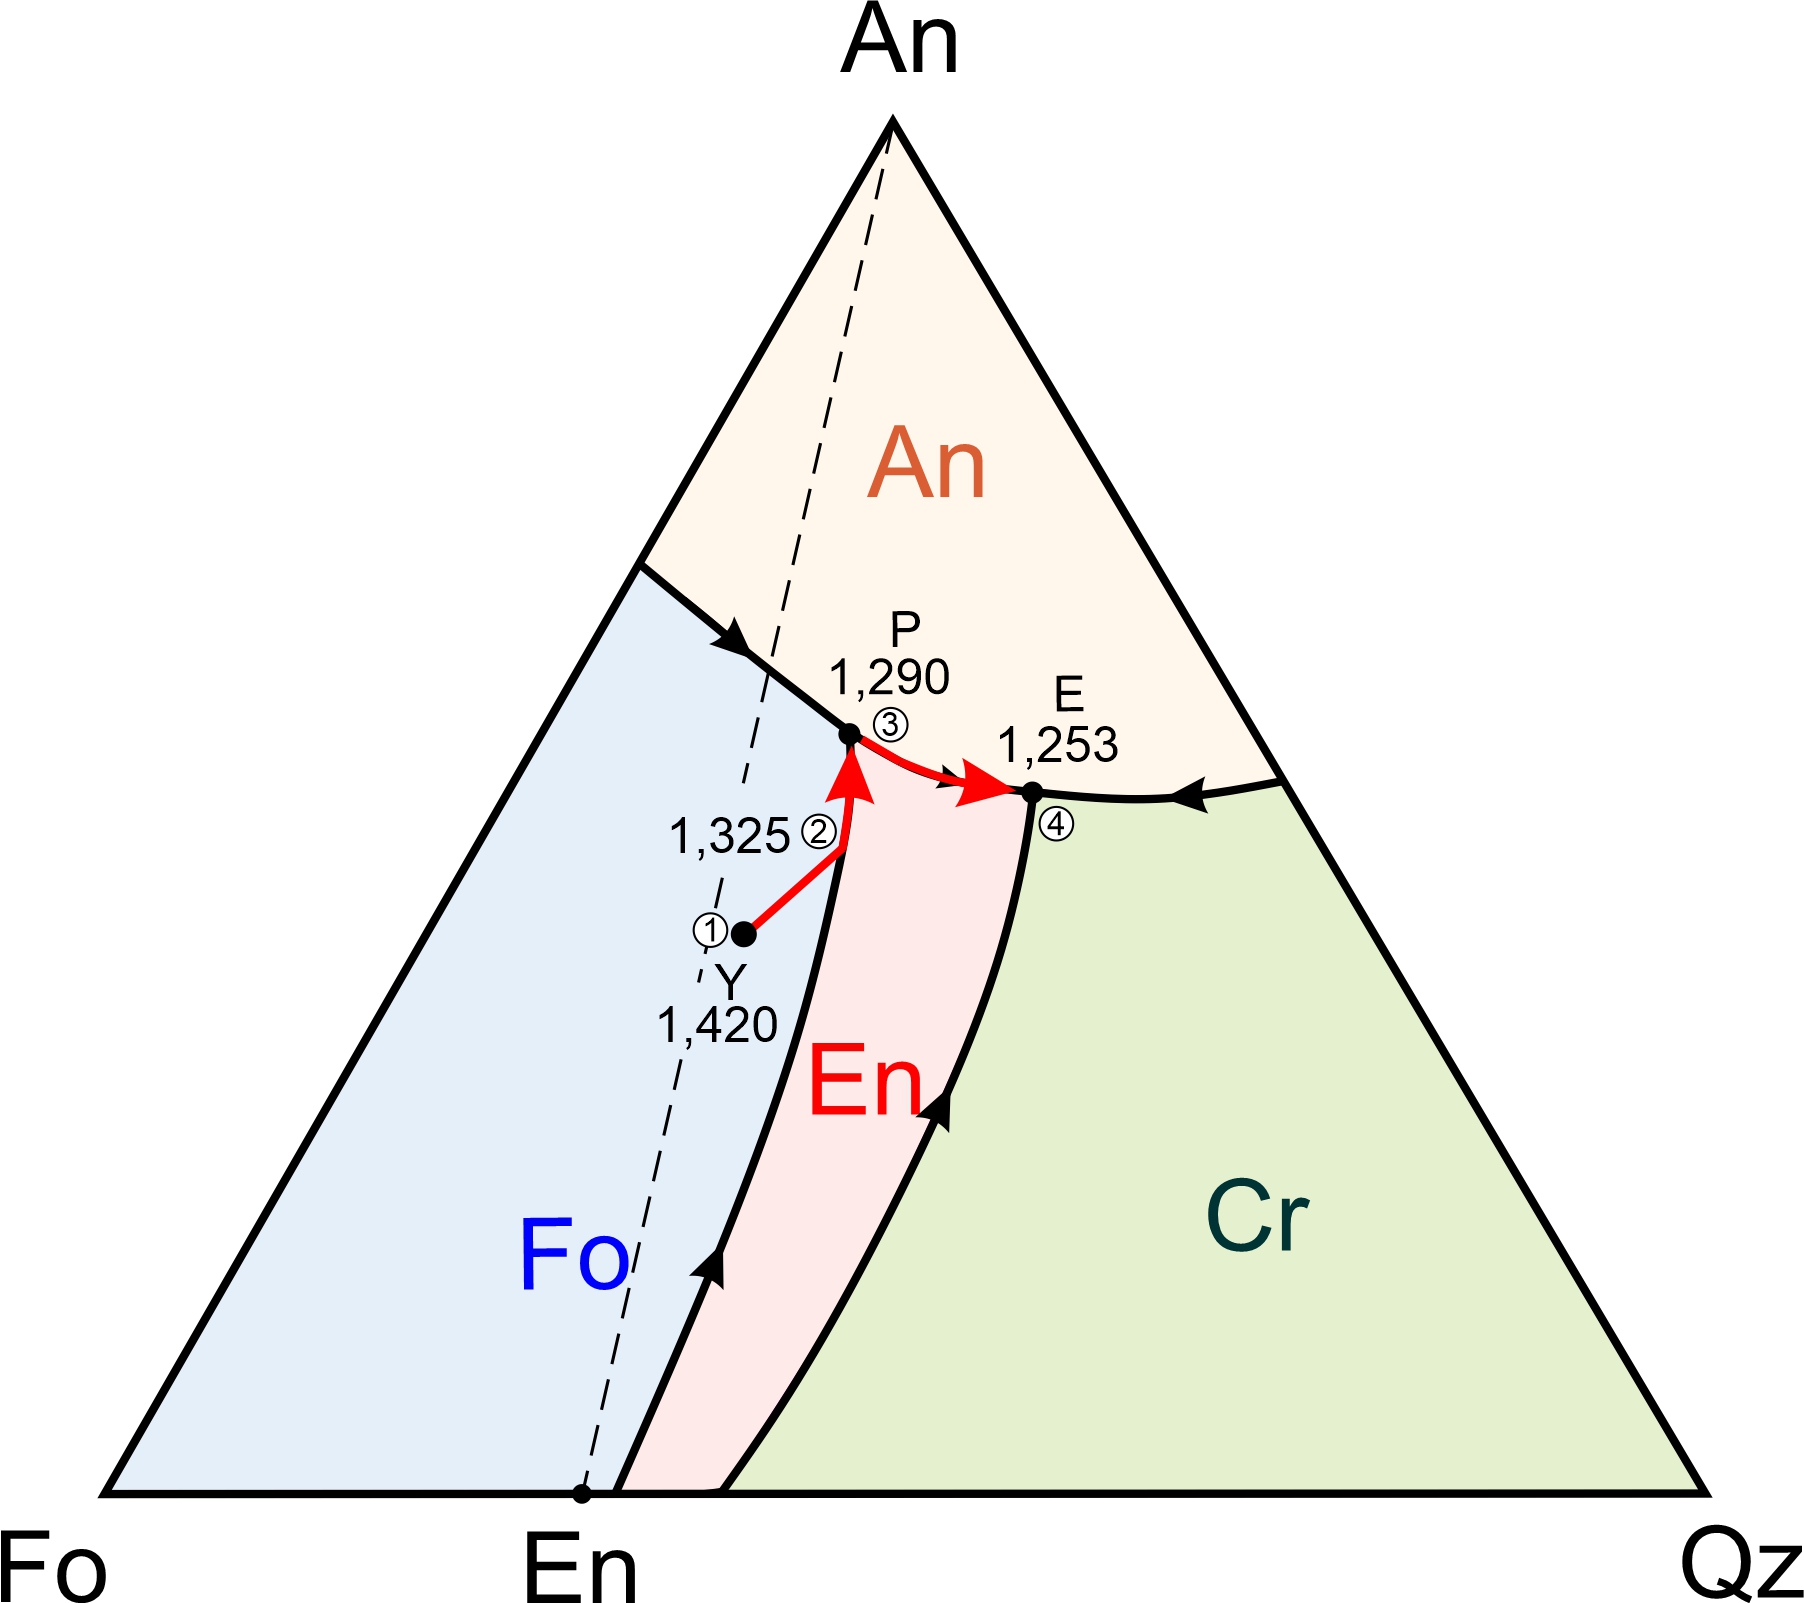
Figure 8.59 shows another possible crystallization path for the forsterite-anorthite-quartz system, starting with a melt of composition Y. Forsterite will crystallize first because the composition plots in the blue forsterite field. However, because the composition plots to the right of the dashed line connecting En and An, the final mineral assemblage will not include any forsterite. It will be anorthite, enstatite, and cristobalite (and the cristobalite will turn into quartz with even more cooling). The final drop of melt will, therefore, have the eutectic composition because this is the only place on the diagram where anorthite, enstatite, and cristobalite can crystalize together.
The cooling path for composition Y in Figure 8.59 is shown by the red arrows from point 1 to point 2 to point 3 and finally to the eutectic at point 4. Forsterite crystallizes first and, as forsterite crystallizes, melt composition moves away from the Fo corner. Eventually, at 1,325 oC, it will reach the cotectic (point 2). Then forsterite and enstatite will crystallize together until the melt reaches the peritectic as 1,290 oC (point 3). At this temperature, all the forsterite will dissolve back into the melt – a process typical of systems that contain a peritectic. (Recall that a similar thing happened in the binary system we considered in Figure 8.28.) At temperatures below the peritectic, enstatite and anorthite will crystallize together. Melt composition will move from the peritectic (point 3) to the eutectic (point 4) where final crystallization of anorthite, enstatite, and cristobalite will occur.
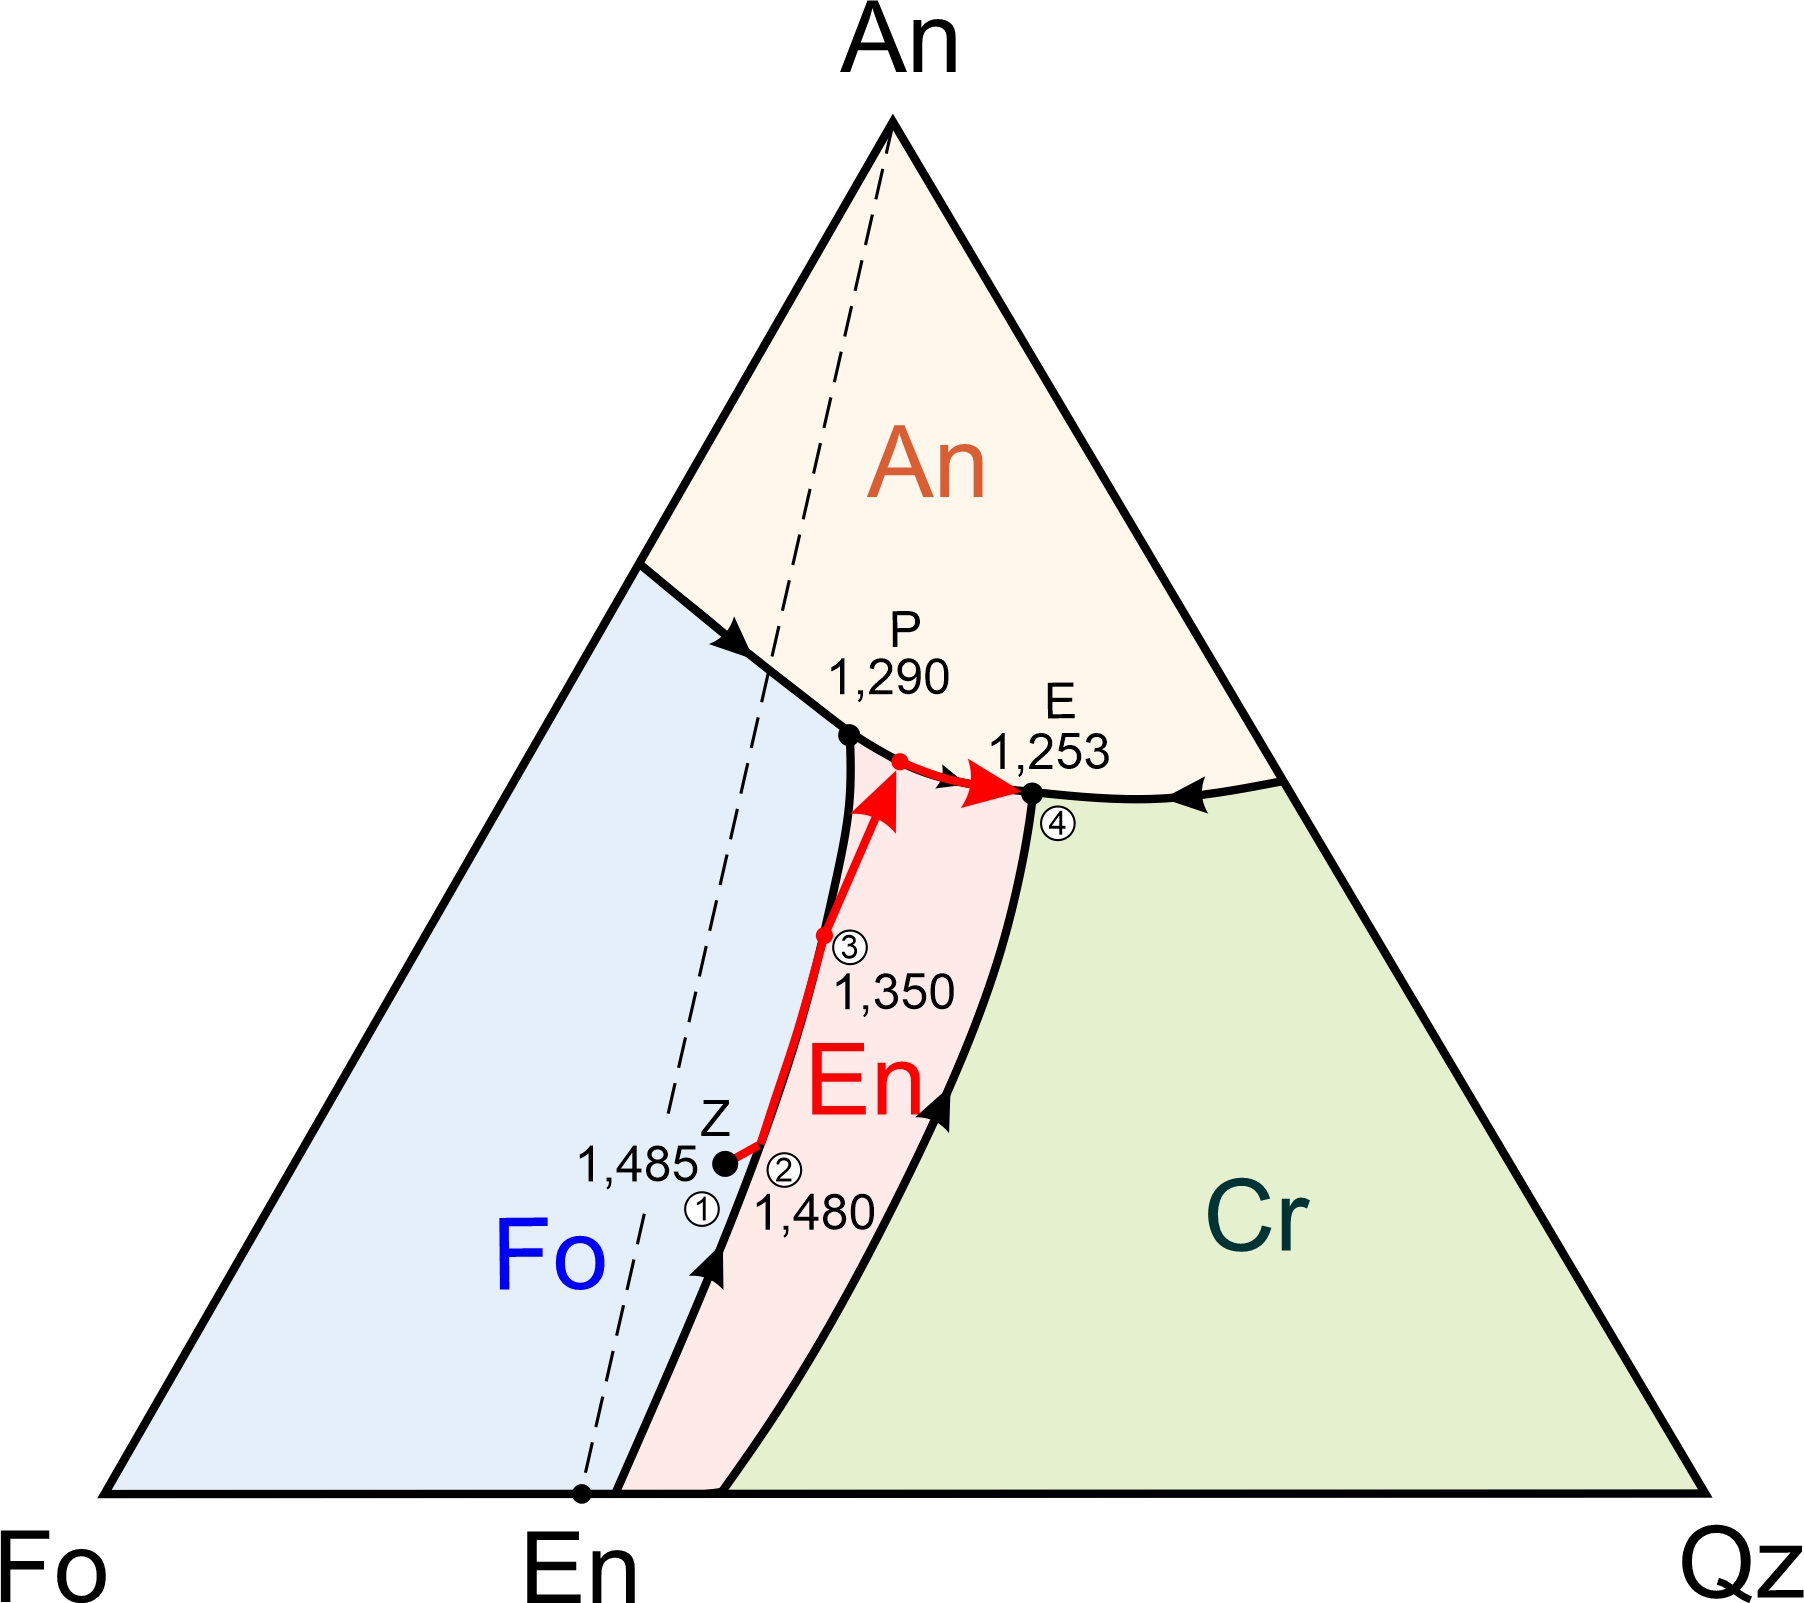
Figure 8.60 is a slightly more complicated example. Crystallization of composition Z starts the same as composition Y, with crystallization of forsterite. And it ends at the eutectic, like composition Y, with a final mineral assemblage of anorthite, enstatite, and cristobalite. Melt composition, however, follows a significantly different path. The melt will start by crystallizing forsterite at 1,485 0C (point 1). A little more cooling and it will reach point 2 (1,480 0C) where enstatite will begin to crystallize with forsterite. Cooling may continue, but at point 3 (1,350 0C), no matter what combination of forsterite and enstatite crystallize, the melt composition cannot follow the cotectic. Removing any amount of enstatite and forsterite cannot change magma composition so it follows the curve. Instead, at point 3, the forsterite will dissolve back into the melt and only enstatite crystals will remain. Enstatite will continue to crystallize with more cooling. Melt composition will move away from En until the composition reaches the curve between the ternary peritectic and the eutectic. Then, anorthite and enstatite will crystallize simultaneously and, eventually, the melt will get to the eutectic where cristobalite will crystallize too.
8.4.1.3 The Diopside – Albite – Anorthite System

Figure 8.61 describes melting relationships for rocks made of plagioclase and diopside. The diagram shows liquidus temperatures for magmas with composition equivalent to some combination of the components diopside, albite, and anorthite. Plagioclase is a solid solution mineral that can have any composition between albite and anorthite, so this ternary diagram only contains two mineral phases: diopside and plagioclase. Furthermore, as we saw earlier in this chapter, the plagioclase that first crystallizes on the liquidus is always more anorthite-rich than the overall composition of a magma. This adds some complications not seen in the previous few examples. The diagram contains one cotectic that connects the diopside-anorthite binary eutectic at 1,278 ̊C to the diopside-albite binary eutectic at 1,085 ̊C. The violet/red-colored labels and dashed lines show plagioclase compositions that will crystallize at different temperature along the cotectic curve. Crystallization in this system is best understood by example.
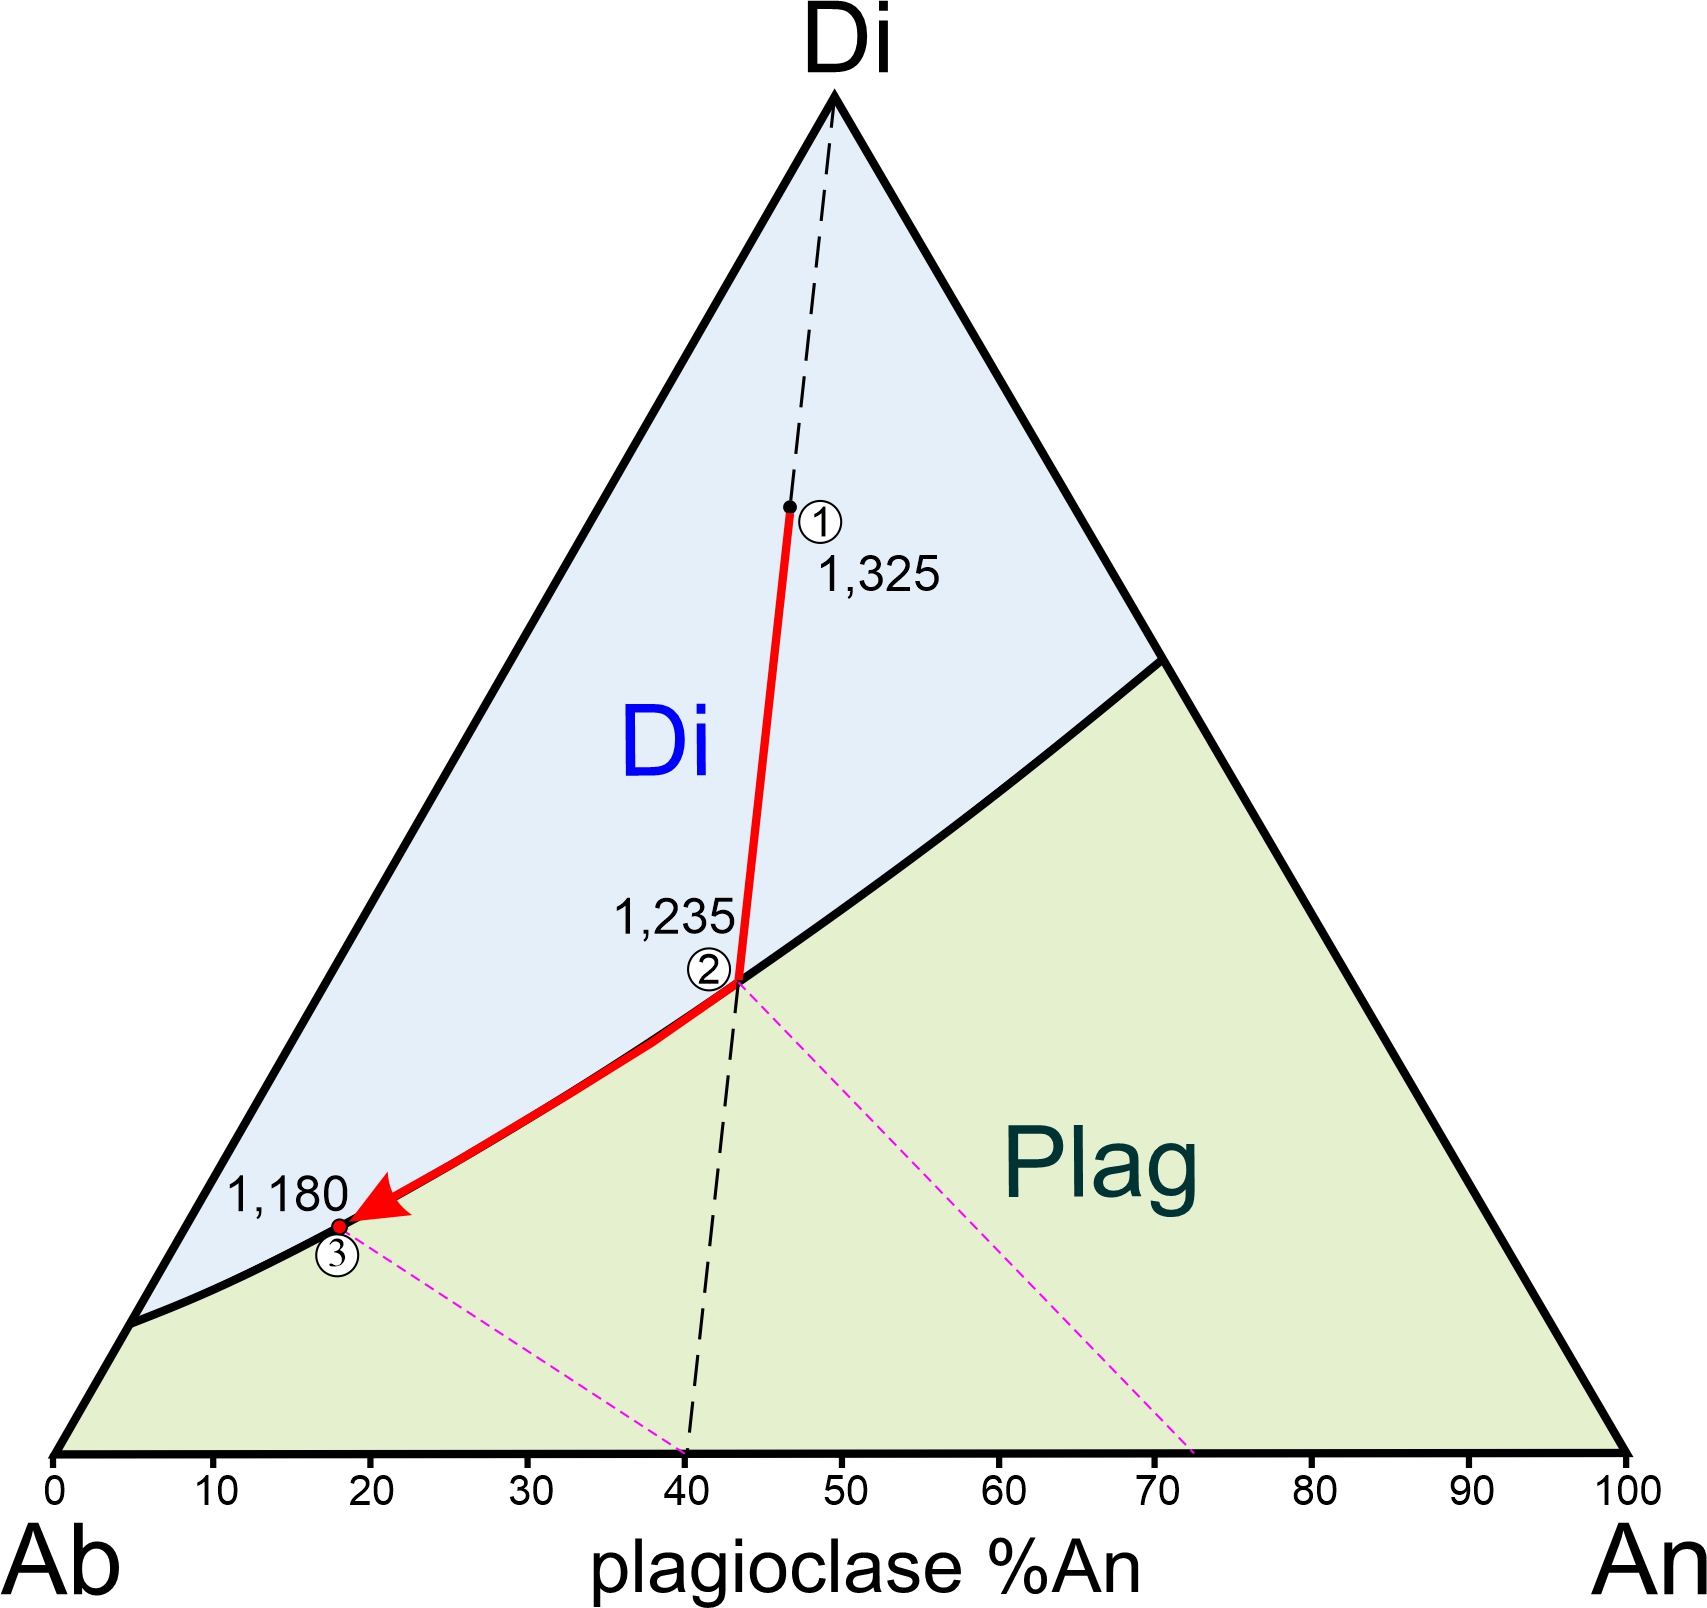
Consider a magma with composition Di70Ab18An12 (point 1 in Figure 8.62). This is equivalent to 70% diopside plus 30% plagioclase (with composition Ab60An40). When the magma cools, diopside will start crystallizing at about 1,325 oC. So melt composition will move away from the Di corner and eventually reach the cotectic at about 1,235 oC (point 2). Plagioclase will then crystallize along with diopside, but the plagioclase will have composition Ab27An73 – significantly more anorthite-rich than the plagioclase component of the melt. As temperature continues to fall, the plagioclase crystals will become more albite-rich and the melt composition will follow the red arrow along the cotectic. Eventually, at 1,180 oC (point 3), plagioclase will have composition Ab60An40 as the last drop of melt (with composition about Ab73Di17An10) disappears. The result will be a rock containing 70% diopside and 30% plagioclase (with composition Ab60An40).
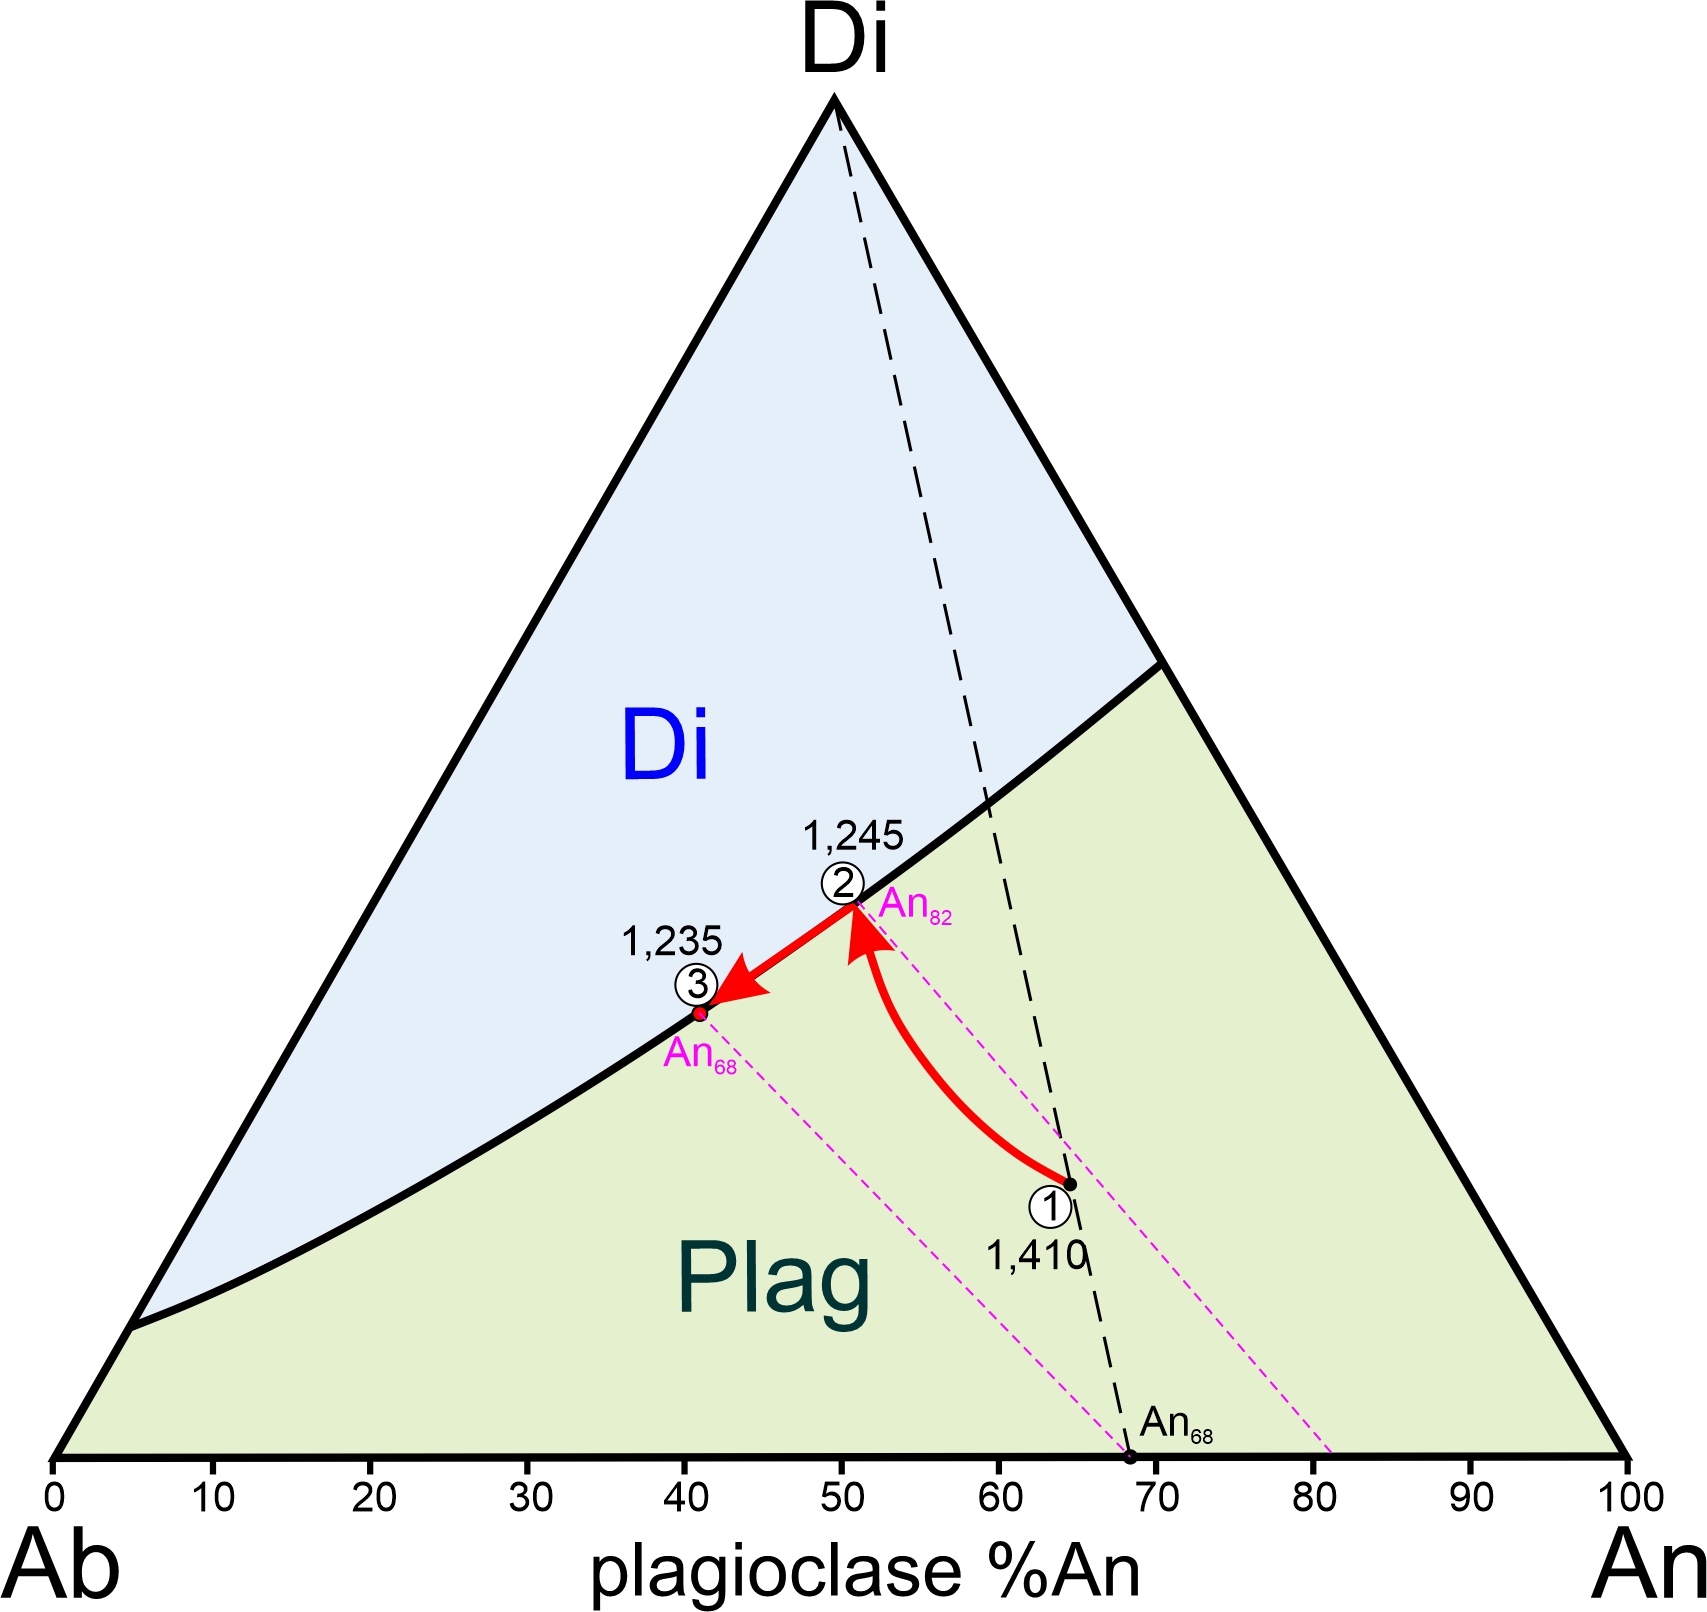
Figure 8.63 shows a more complicated example involving a magma of composition An54Ab26Di20. This is equivalent to 80% plagioclase (of composition An68Ab32) and 20% diopside. Upon cooling, plagioclase will begin crystallizing at slightly more than 1,400 oC. The initial crystals that form will be nearly 100% anorthite, and melt composition will move away from the An corner of the diagram. But as temperature falls, the plagioclase that is crystallizing will become more albite-rich. So, the melt composition, shown by the red arrow, will follow a curving path to the cotectic at 1,245 ̊C (point 2). With further cooling, plagioclase and diopside will crystallize simultaneously as melt composition follows the cotectic to point 3 at 1,235 ̊C. The plagioclase will have composition An68Ab32 as the last drop of melt (with composition Ab43Di33An24) disappears, and the rock will contain 80% plagioclase and 20% diopside.
8.4.1.4 Feldspars and Incongruent Melting in a Ternary System
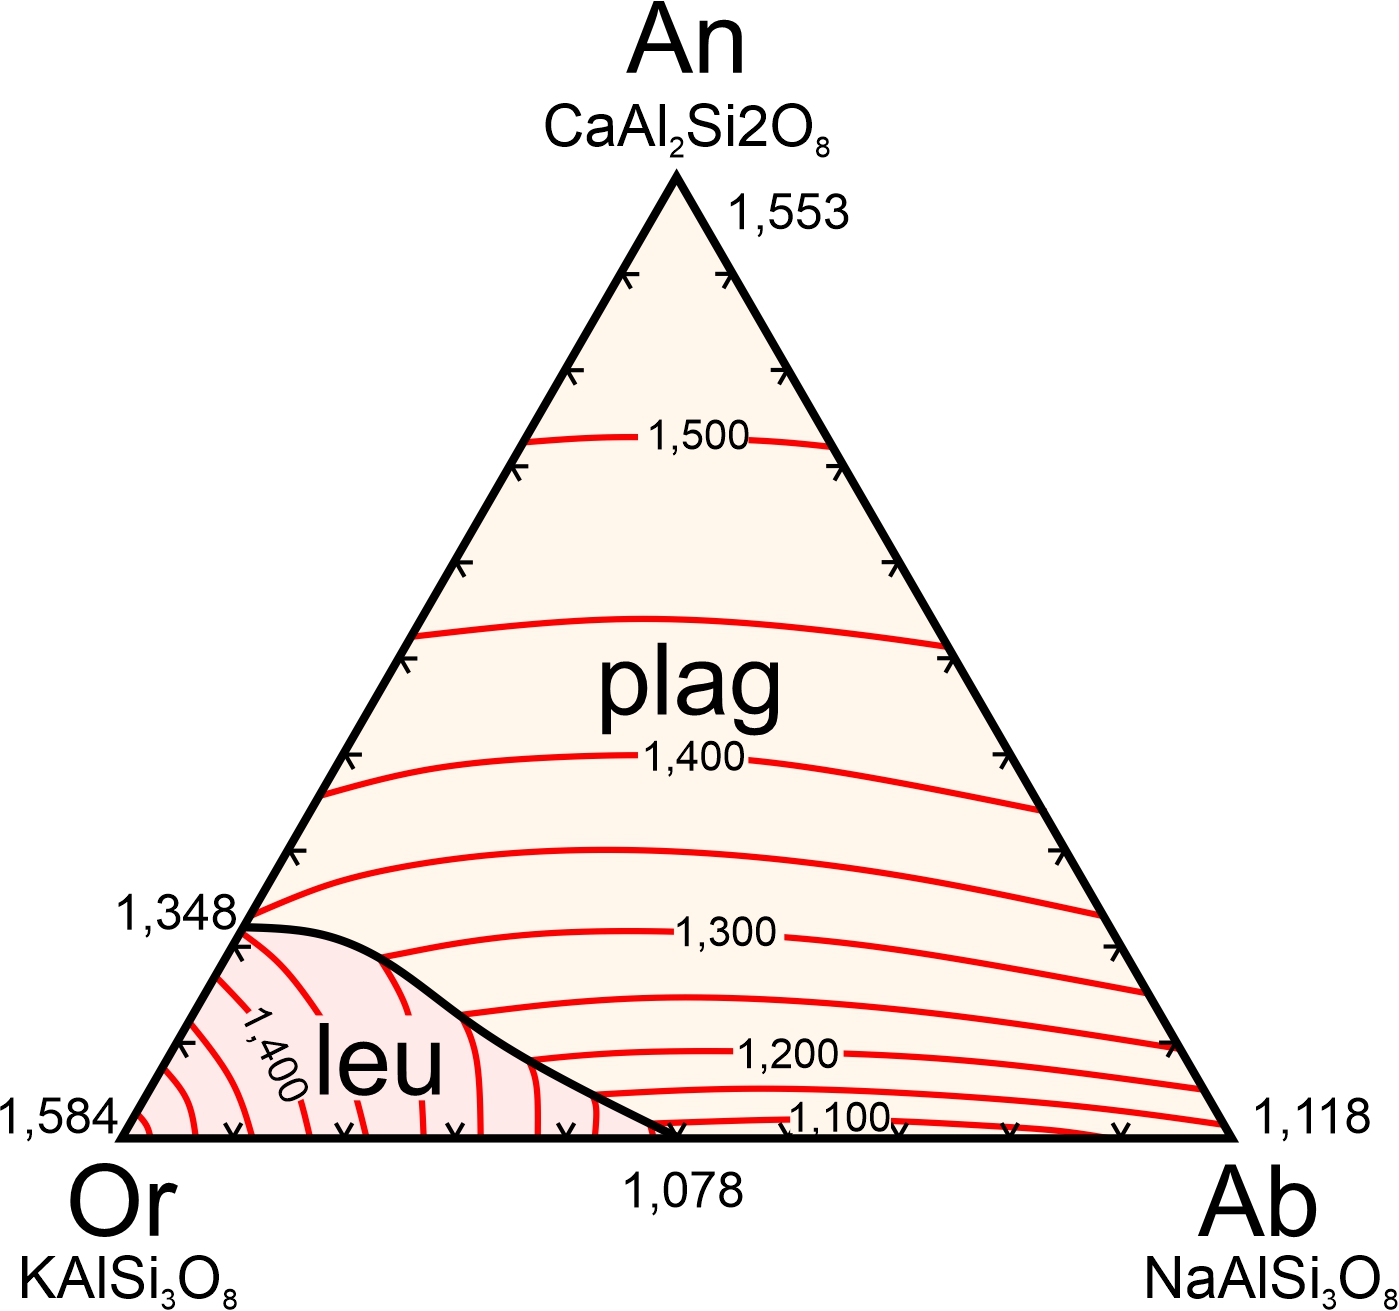
So far in this chapter, we have considered alkali feldspars that are binary solutions of end-members albite and orthoclase (K-feldspar), and plagioclase that is a binary solution of albite and anorthite. But natural alkali feldspars always contain some anorthite, and natural plagioclase always contains some orthoclase. So, both kinds of feldspars are really ternary minerals. Figure 8.64 depicts the ternary anorthite-orthoclase-albite system. It contains two fields separated by a cotectic curve, a plagioclase field (plag) and a leucite field (leu).
This ternary feldspar diagram has a complication that we have not seen previously. A melt of anorthite composition will crystallize at 1,553 oC and a melt of albite composition will crystallize at 1,118 oC. But, orthoclase or other K-feldspars never crystallize at liquidus temperatures because KAlSi3O8 melts (and crystallizes) incongruently. A cooling magma of orthoclase composition (KAlSi3O8) will crystallize leucite (leu, KAlSi2O6) at 1,584 oC instead of feldspar. We saw this previously in the binary leucite-quartz diagram (Figure 8.26).
Incongruent melting means that the bottom left corner of Figure 8.64 has a leucite field instead of an orthoclase field. But leucite is not a mineral in the ternary anorthite-orthoclase-albite system (because leucite’s composition cannot be made from a combination of those components – another component is needed). So Figure 8.64 is really a four-component system. We call phase diagrams such as this that have one or more extra components, pseudoternary phase diagrams.
What happens during cooling? Depending on magma composition, plagioclase or leucite will crystallize first and melt composition will move toward the cotectic. The two minerals will then crystallize simultaneously. With further cooling, the leucite will react with the melt, producing K-feldspar. K-feldspar and plagioclase will then crystallize until all the melt is gone.
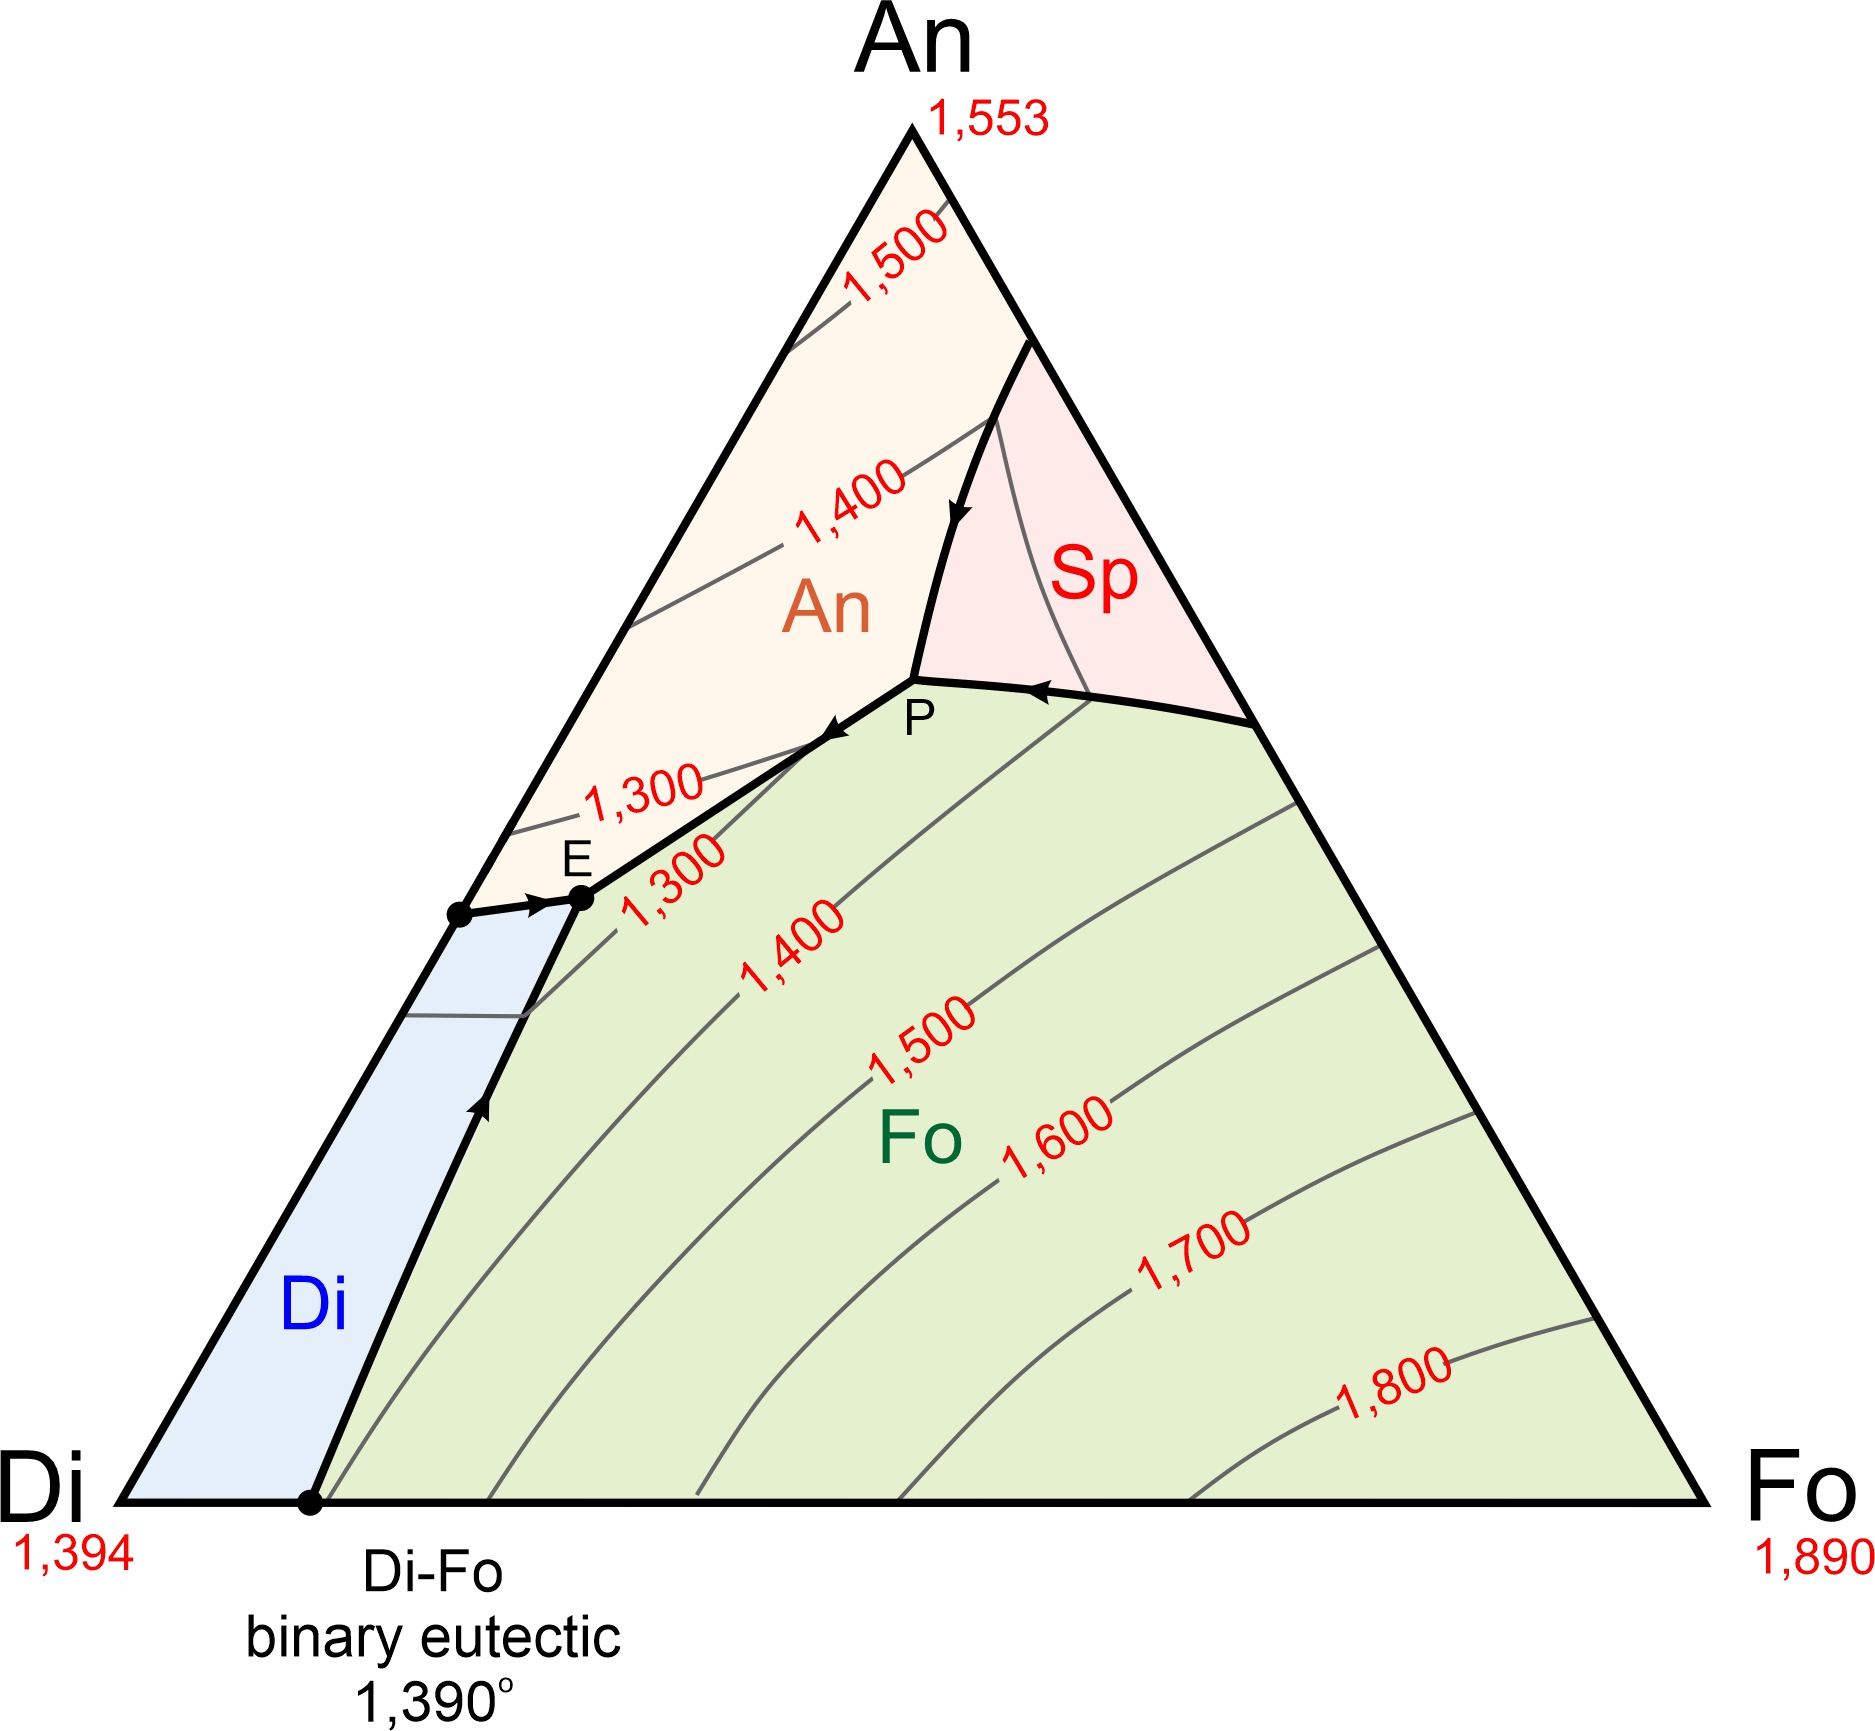
For another example of a pseudoternary diagram, consider the anorthite-diopside-forsterite system. Previously we looked at a “simplified” ternary phase diagram for this system (Figure 8.55). The system is really a pseudoternary but we ignored that to keep the first discussion of ternary diagrams straightforward. Figure 8.65 is a more accurate depiction. A small spinel (Sp) field is present, but spinel’s composition cannot be made from the components at the corners of the triangle. Similarly, the forsterite-anorthite-quartz system depicted as a ternary in Figure 8.57 also has a small spinel field on the anorthite-forsterite side (that we omitted from the diagram), and so is really a pseudoternary. Some apparent two-component systems are pseudobinaries, but no examples are in this chapter.
8.4.1.5 Subsolidus Feldspar Equilibria and Immiscibility
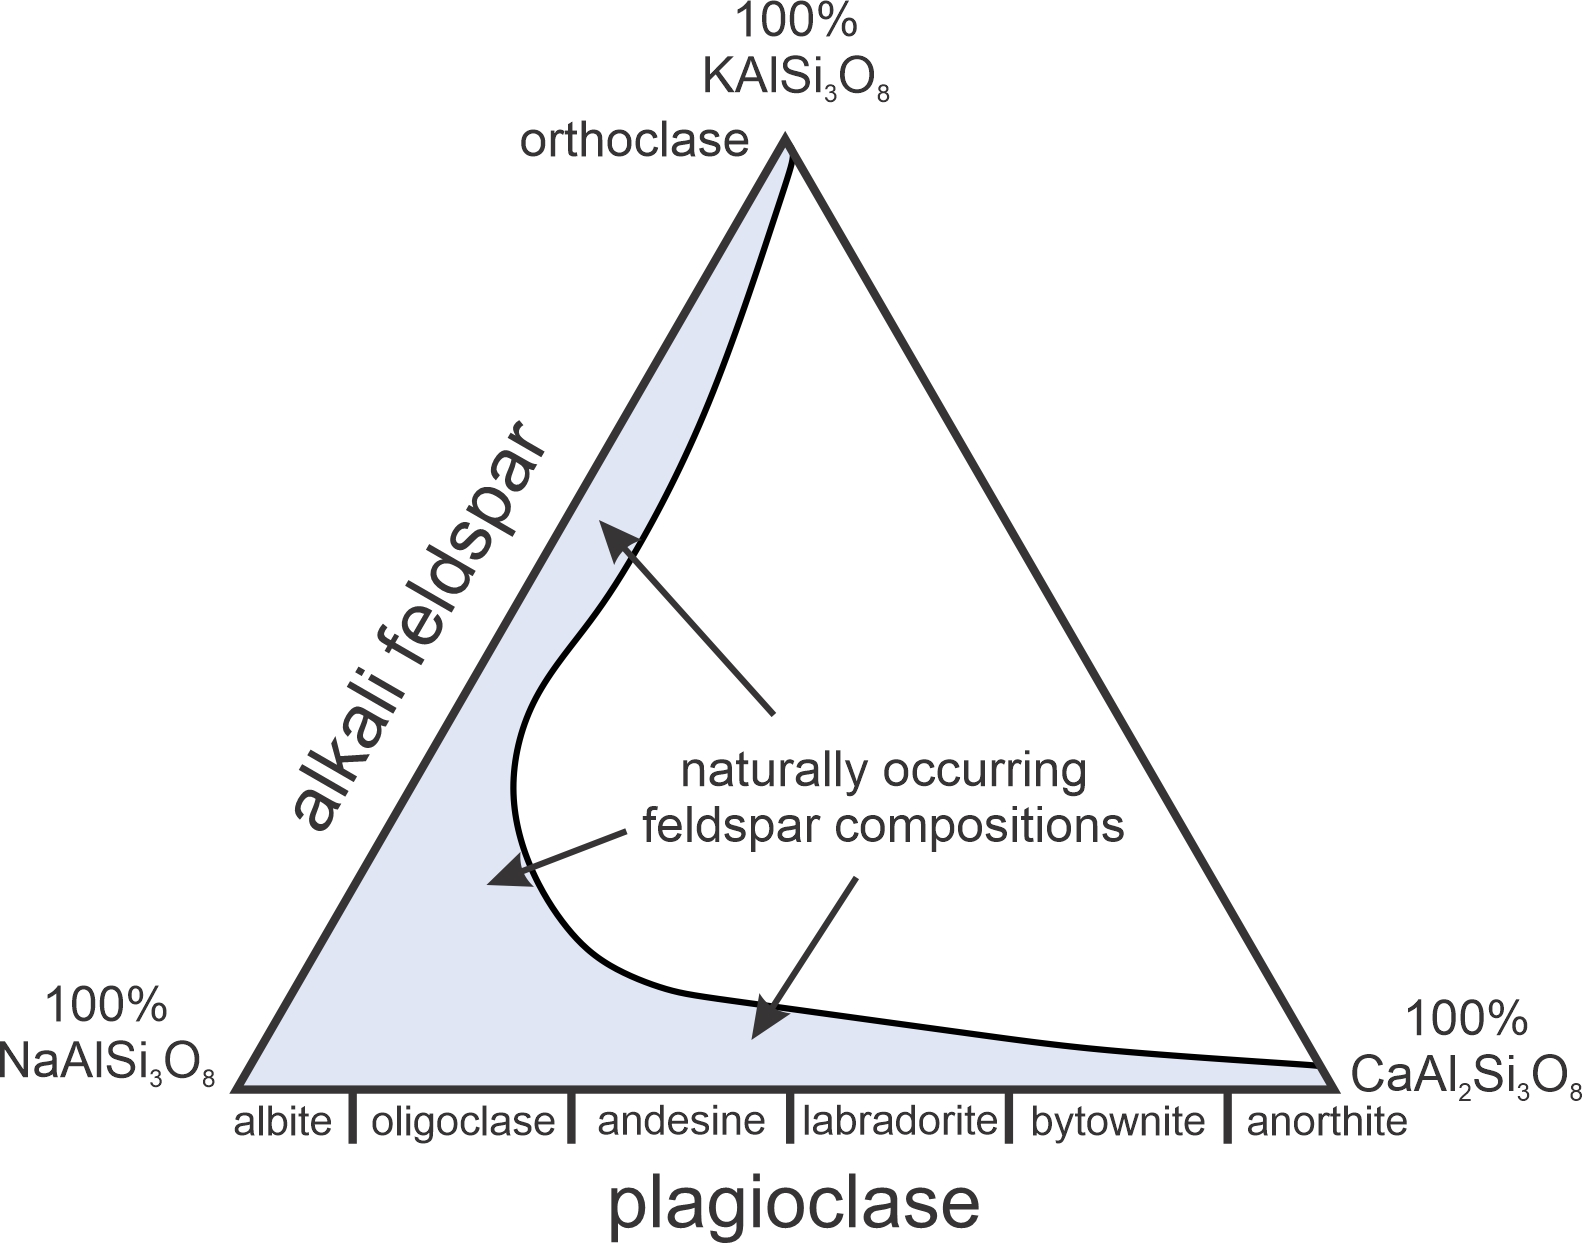
Figure 8.66 shows, in blue, the range of naturally occurring feldspar compositions. This diagram and the ones following are in mole %, not weight %.
Alkali feldspars range from orthoclase (Or) to albite (Ab), although not all compositions are stable under all conditions. Plagioclase ranges from albite (Ab) to anorthite (An) and, except at very low temperatures where some small solvi interfere, all compositions between are stable. Different plagioclase composition ranges have their own mineral names: albite (0-10% An), oligoclase (10-30% An), andesine (30-50% An), labradorite (50-70% An), bytownite (70-90% An), and anorthite (>90 An).
Feldspars may crystallize at liquidus temperature but they often react and change composition during cooling, even at temperatures below the solidus. So, diagrams like the one in Figure 8.65 vary with pressure and temperature. That is, the size and shape of the blue field that depicts stable feldspar compositions will change if pressure or temperature change.
Previously we looked at binary alkali feldspars and the solvus between albite (NaAlSi3O8) and orthoclase (KAlSi3O8) (Figure 8.41). At low temperature, the solvus is very wide. We see the same thing on a ternary feldspar diagram. The first triangle in Figure 8.67 shows stable feldspar compositions at 400 oC (small field along the bottom of the triangle and small field near the top, both in blue). K-feldspar contains up to 15% albite, and perhaps a few % anorthite. Intermediate K-Na feldspars are not stable, but all plagioclase compositions between albite and anorthite are possible.
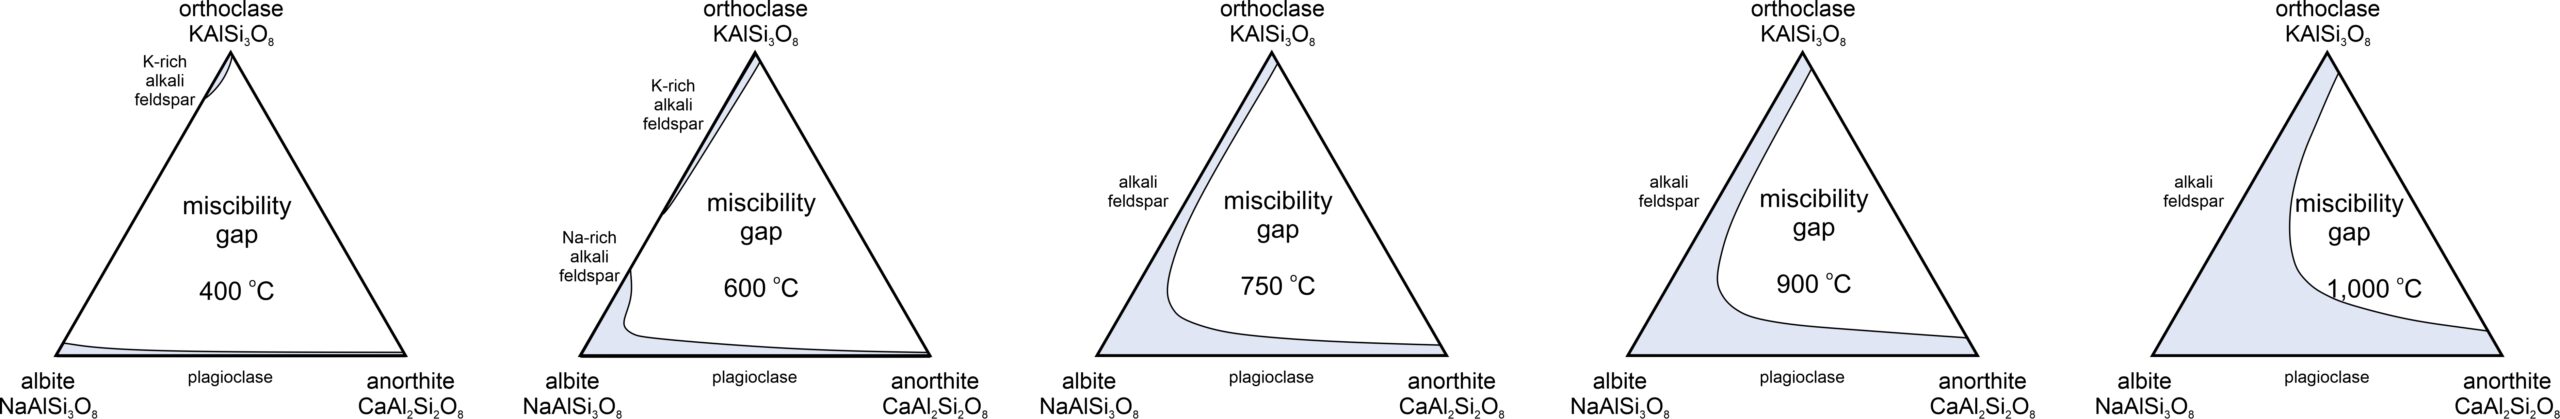
Figure 8.67 also shows stable feldspar compositions at 600, 750, 900, and 1,000 oC. As temperature increases, the size of the miscibility gap shrinks. Above about 650 oC, the break between orthoclase and albite disappears – any composition alkali feldspar is stable. And with increasing temperature, alkali feldspar can contain more anorthite, and plagioclase can contain more orthoclase. But, even at 1,000 oC, there is a large remaining miscibility gap. Feldspars with compositions that plot in the white field are never, or very rarely, found.
8.4.2 Ternary Pyroxenes
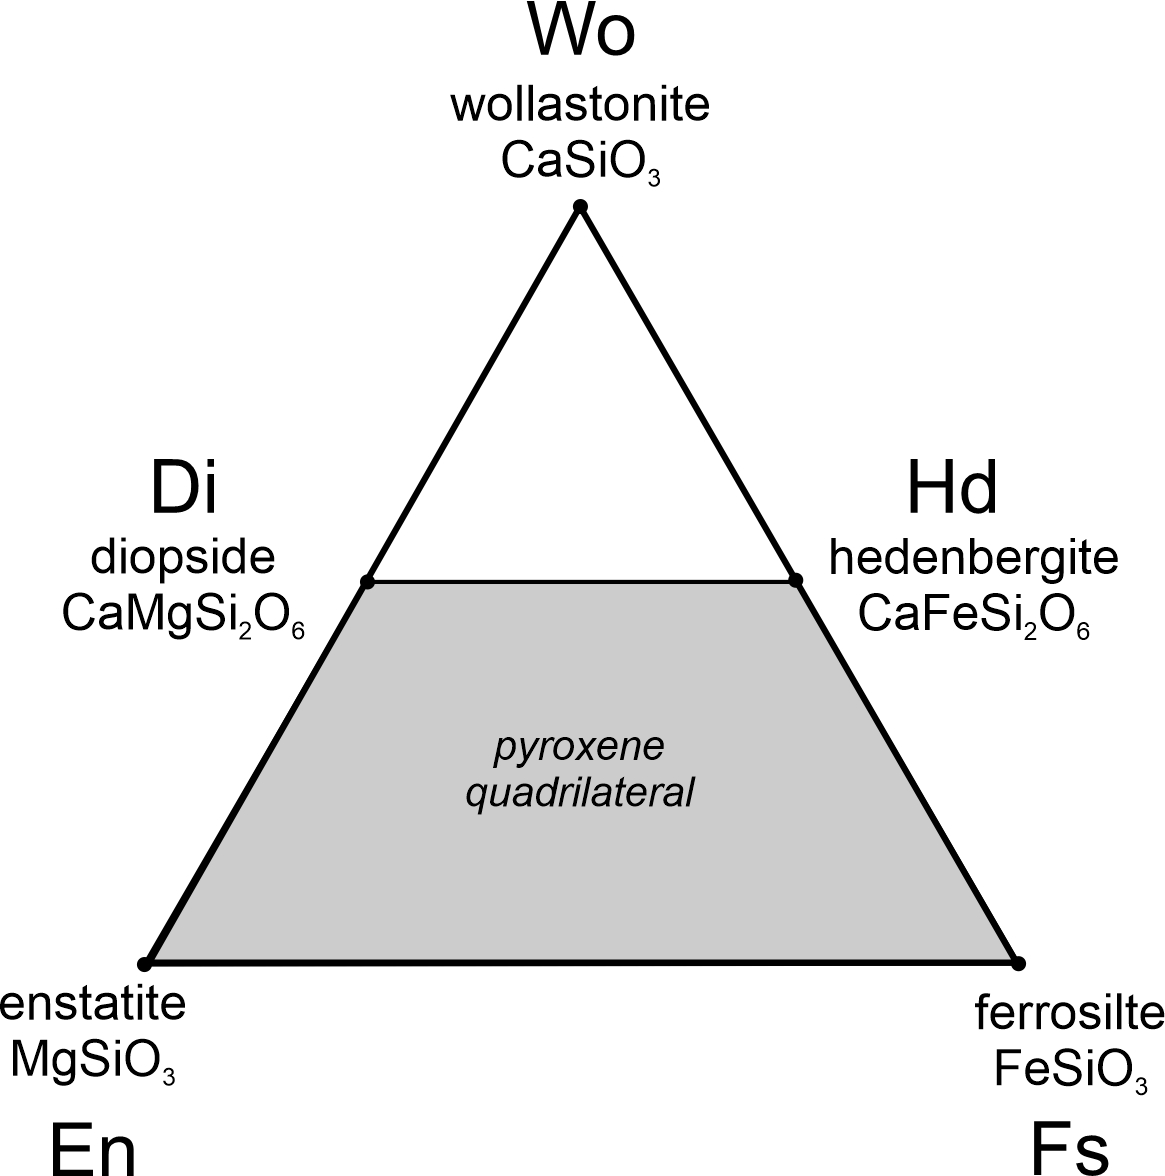
Common pyroxene contains predominately three components: MgSiO3, FeSiO3, and CaSiO3. These components correspond to the compositions of the three minerals: enstatite (MgSiO3), ferrosilite (FeSiO3), and wollastonite (CaSiO3). We typically abbreviate the components En, Fs, and Wo (Figure 8.68). Enstatite and ferrosilite are pyroxenes, but wollastonite has a slightly different atomic arrangement and belongs to the pyroxenoid group of minerals. Diopside and hedenbergite, with compositions halfway between enstatite and wollastonite, and ferrosilite and wollastonite, are also pyroxenes. Common pyroxenes are solutions of enstatite, ferrosilite, diopside, and hedenbergite. They never contain more calcium than magnesium and iron combined, and so plot only in the bottom have of this triangle, a region we call the pyroxene quadrilateral.
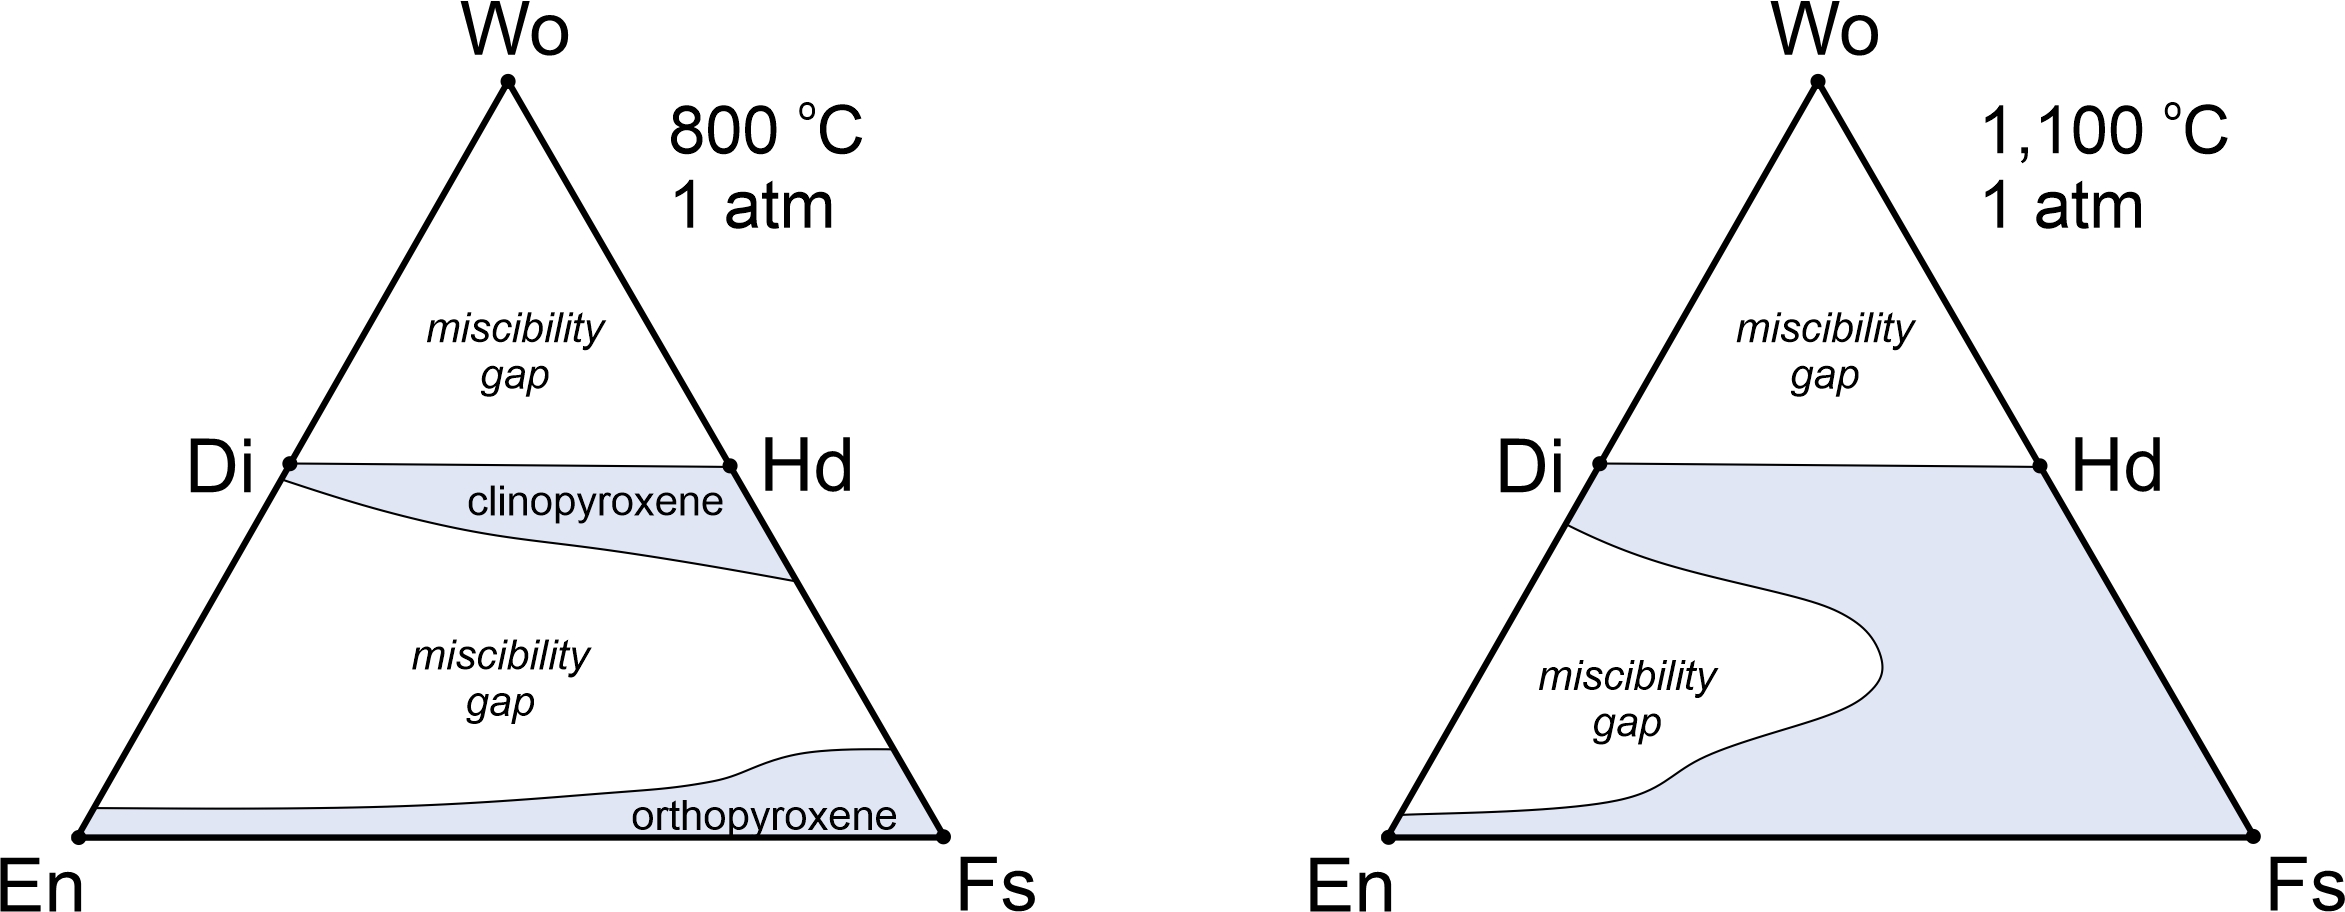
There are several different kinds of pyroxenes with slightly different atomic arrangements. Enstatite and ferrosilite components dominate orthopyroxenes. Calcic pyroxenes – pyroxenes rich in diopside and hedenbergite components – are clinopyroxenes. These names derive from the shapes of the minerals’ unit cells. As seen in Figure 8.69, orthopyroxenes typically contain a small amount of calcium and so plot above the join – the line – connecting enstatite to ferrosilite. Clinopyroxenes are generally somewhat deficient in calcium and plot below the join connecting diopside to hedenbergite.
Like feldspars, stable pyroxene compositions vary with temperature. Figure 8.69 is a simplified diagram that shows (in blue) stable compositions at and 800 and 1,100 oC and 1 atmosphere. A large miscibility gap separates clinopyroxenes from orthopyroxenes. At 800 oC, orthopyroxenes contain little wollastonite component, and clinopyroxenes are close to 50% wollastonite. The size of the gap, however, varies with temperature. At temperatures greater than, for example at 1,100 oC, pyroxenes with any composition between ferrosilite and hedenbergite are stable, and the gap between enstatite and diopside is smaller than at 800 oC. No matter the temperature, however, pyroxenes more wollastonite-rich than diopside and hedenbergite are never stable. We have omitted a third kind of pyroxene, pigeonite, from this diagram to keep things clear. Pigeonite has a stability field that partly overlaps that of orthopyroxene.
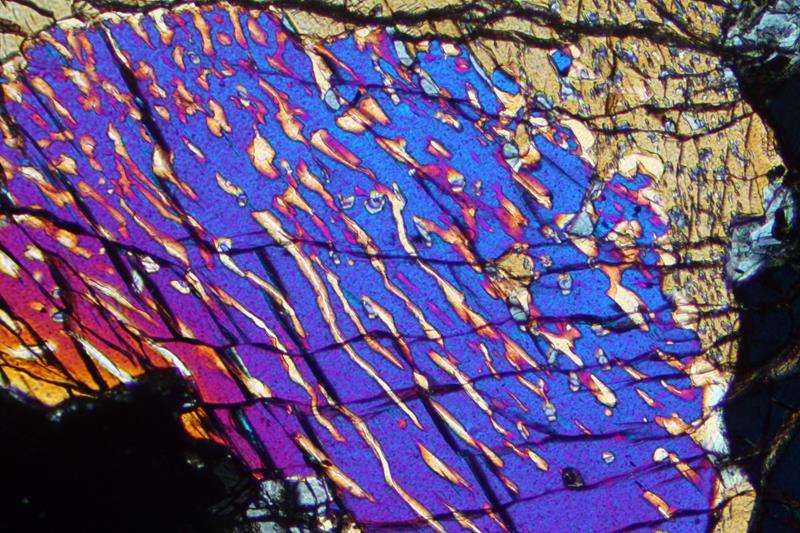
Figure 8.70 is a photo of exsolution lamellae in a pyroxene grain in a peridotite from northern Italy. The colors are interference colors caused by cross-polarized filters, not the real colors of the pyroxene. These exsolution lamellae developed when an original high-temperature pyroxene exsolved to create two pyroxenes, one a Ca-rich clinopyroxene and the other an orthopyroxene containing little Ca. The bright, mostly blue, part of the pyroxene is clinopyroxene. The light-colored stringers are orthopyroxene. This photo should remind us why looking at rocks in thin section is important – exsolution features like this are not visible in hand specimen.
Natural pyroxenes contain components other than those depicted by the pyroxene quadrilateral. The most common kind of clinopyroxene is augite. Augite has complex chemistry that includes Na, Mn, Al, Ti and other minor elements not considered in Figure 8.69. Augite, however, is mostly a solution of diopside and hedenbergite. Figure 8.71 is a photo of a black augite phenocrysts in a coarse-grained mafic rock from a volcano in Rwanda. Figure 8.72 is a photo of an andesite that contains dark-colored augite phenocrysts. Like clinopyroxenes, orthopyroxene often exsolve and always contain components other than those of the pyroxene quadrilateral. The exsolved pyroxene in Figure 8.70 was also augite before exsolution occurred.
|
|
|
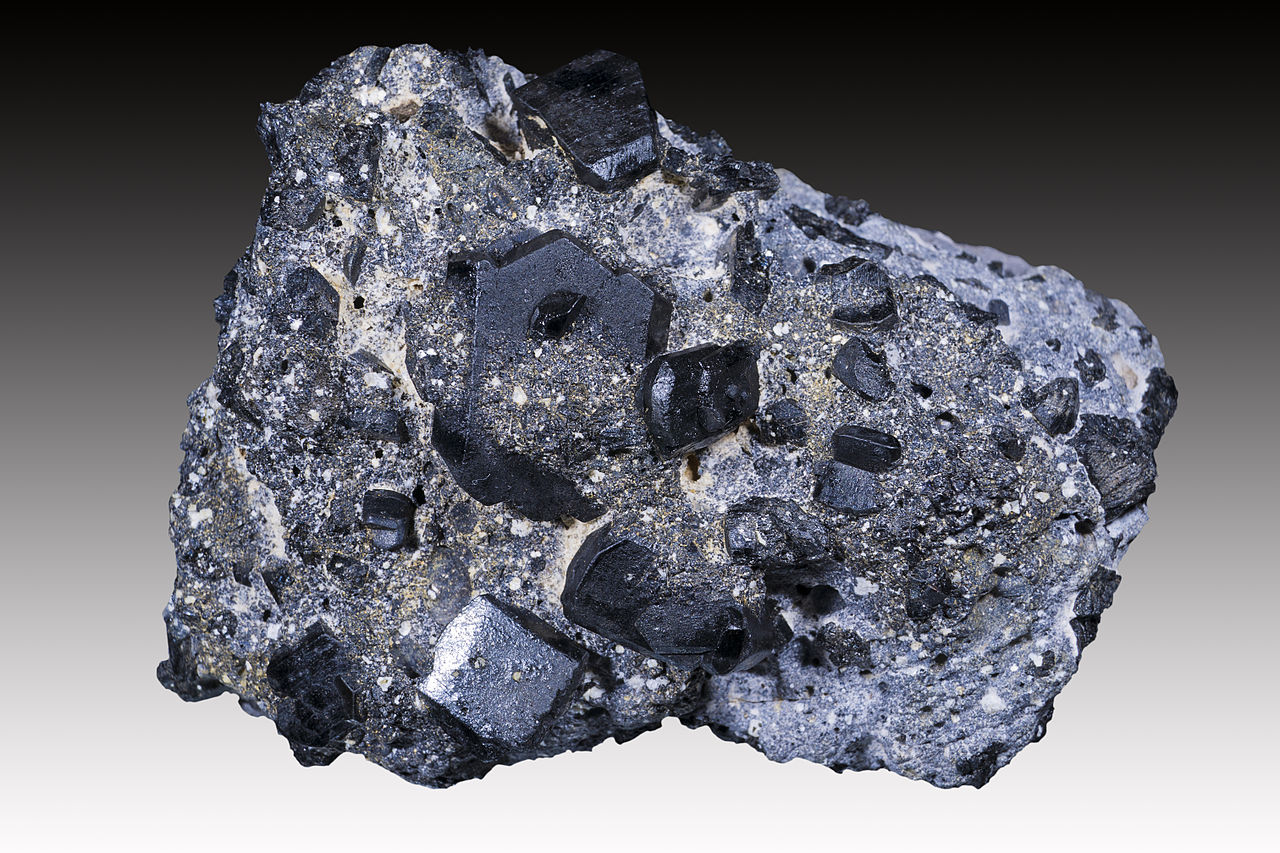
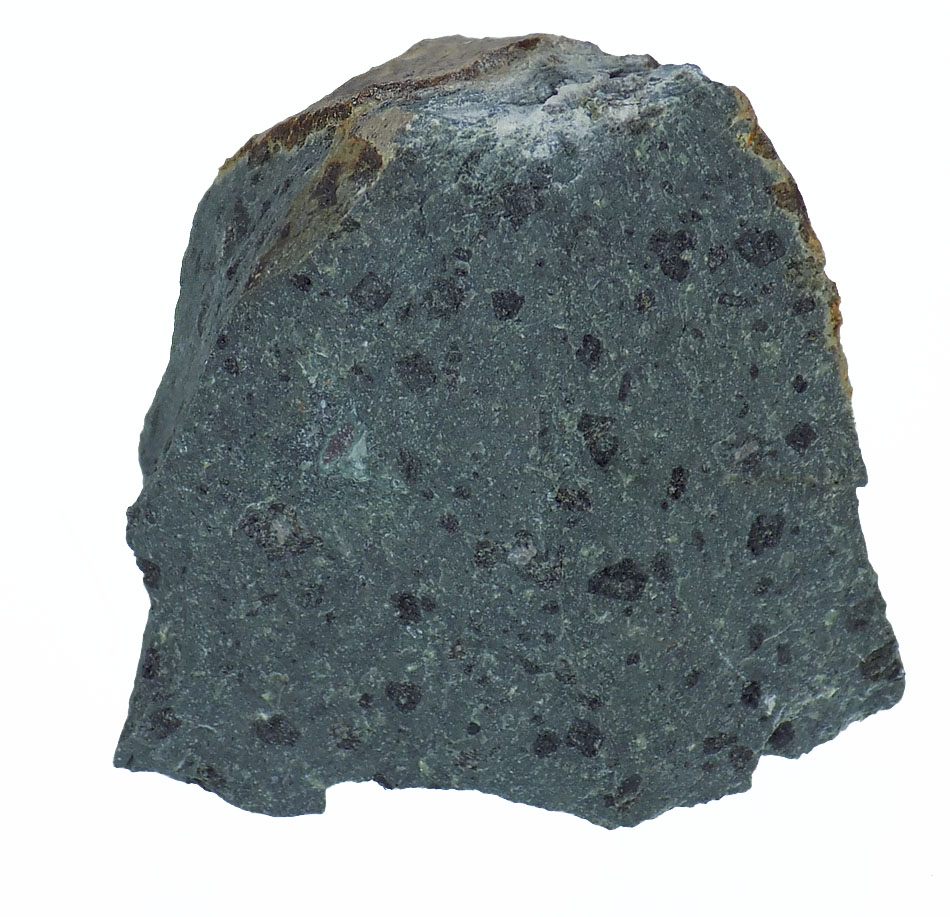
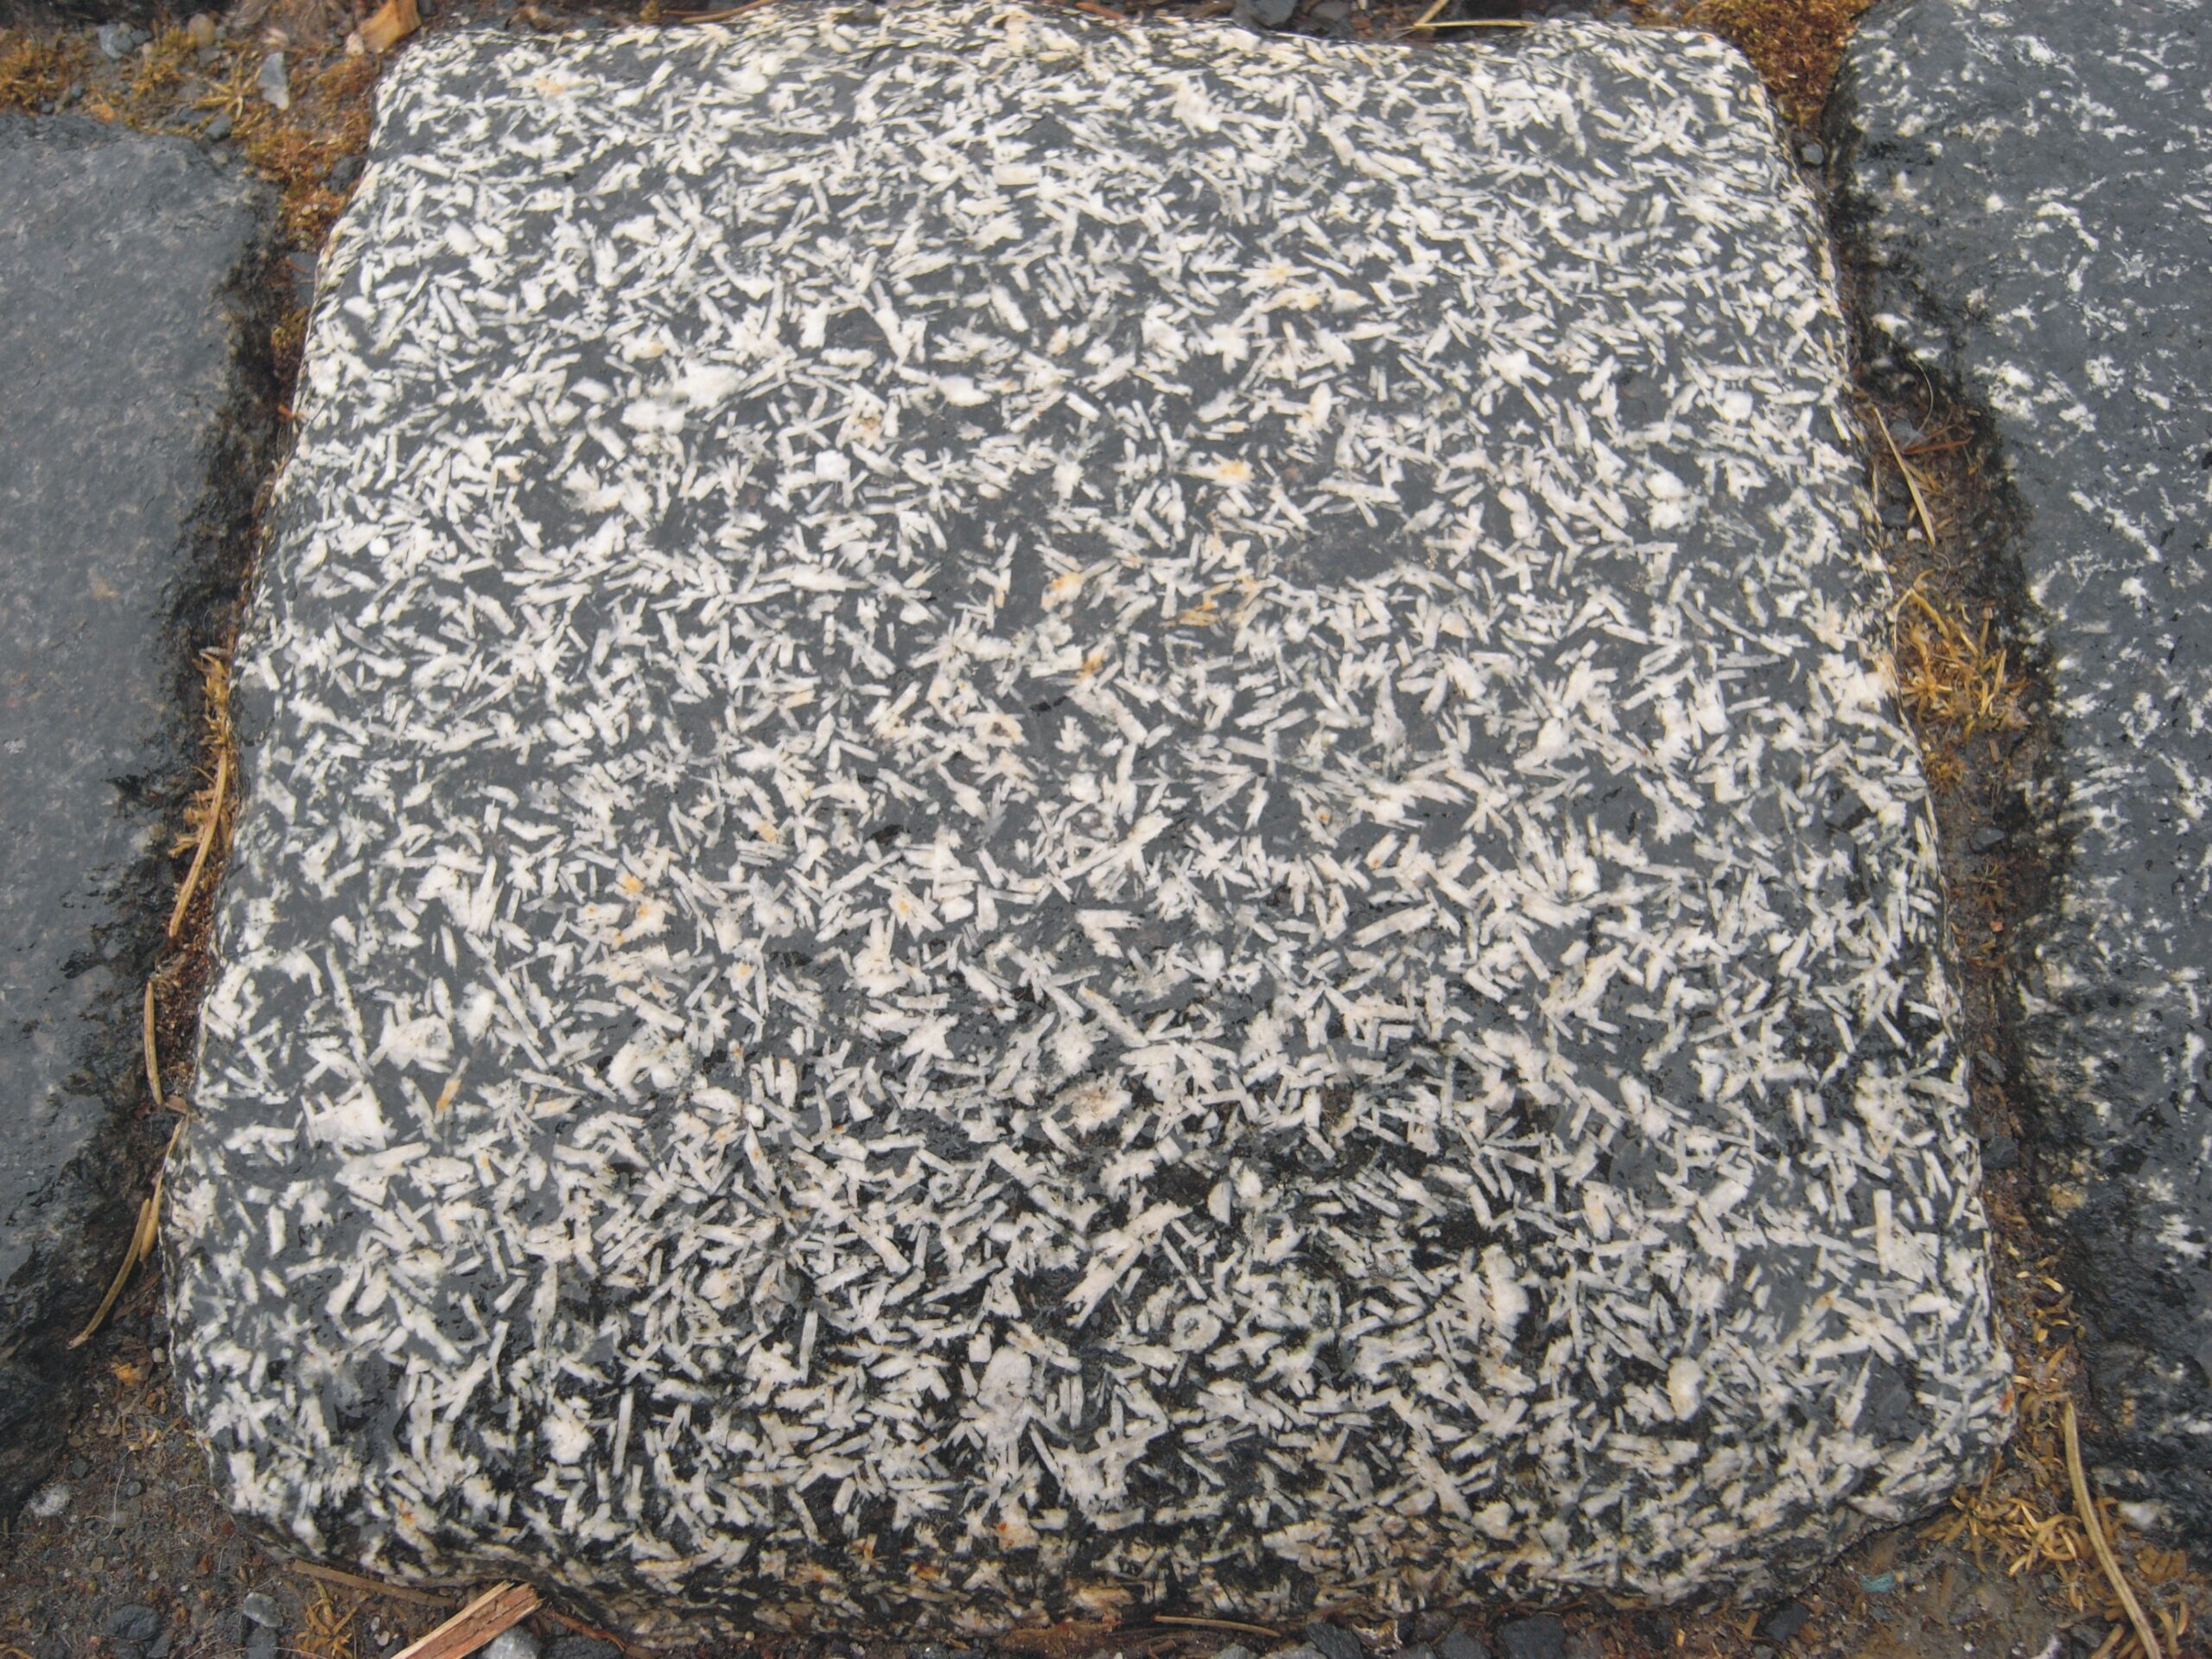
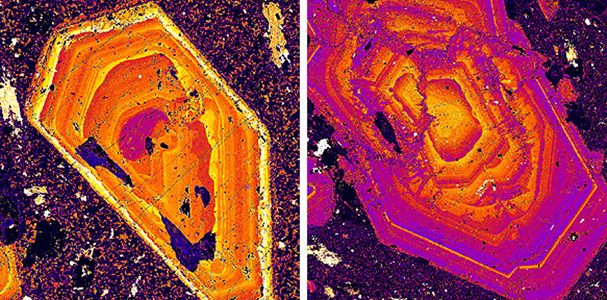
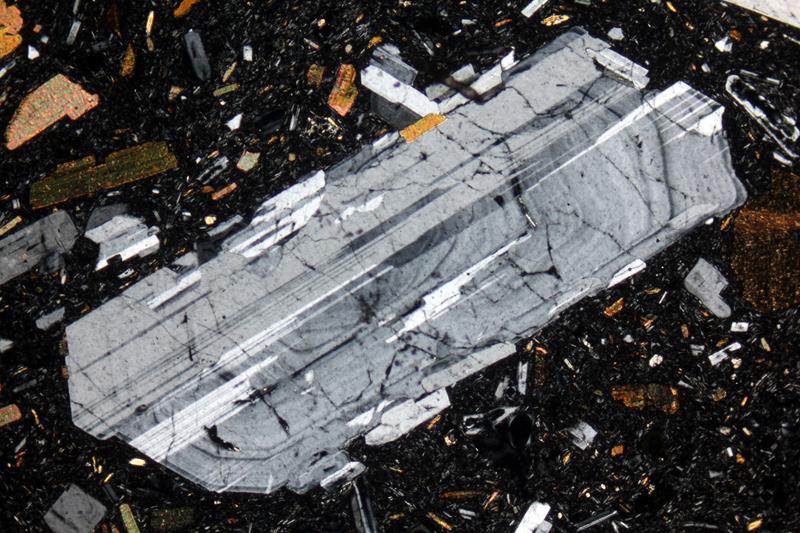
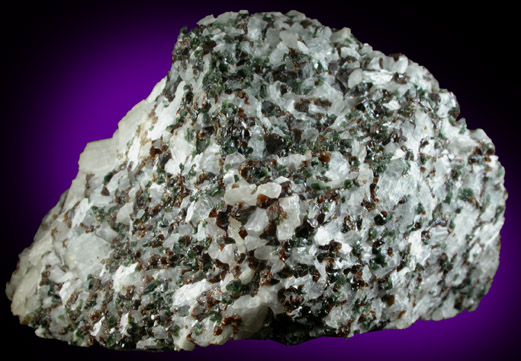
Figure 8.73 is a photo of a marble (metamorphosed limestone) that contains small (1-2 mm) green crystals of diopside (CaMgSi2O6) and abundant white bladed wollastonite (CaSiO3). In contrast with other pyroxene and pyroxenoid occurrences, wollastonite and diopside in marbles generally have compositions very close to their end members. Wollastonite (a pyroxenoid) and diopside (a pyroxene) often coexist because no pyroxenes or pyroxenoids with composition between the two (that would plot in the top half of Figure 8.65) are stable.
8.4.3 Ternary Amphiboles
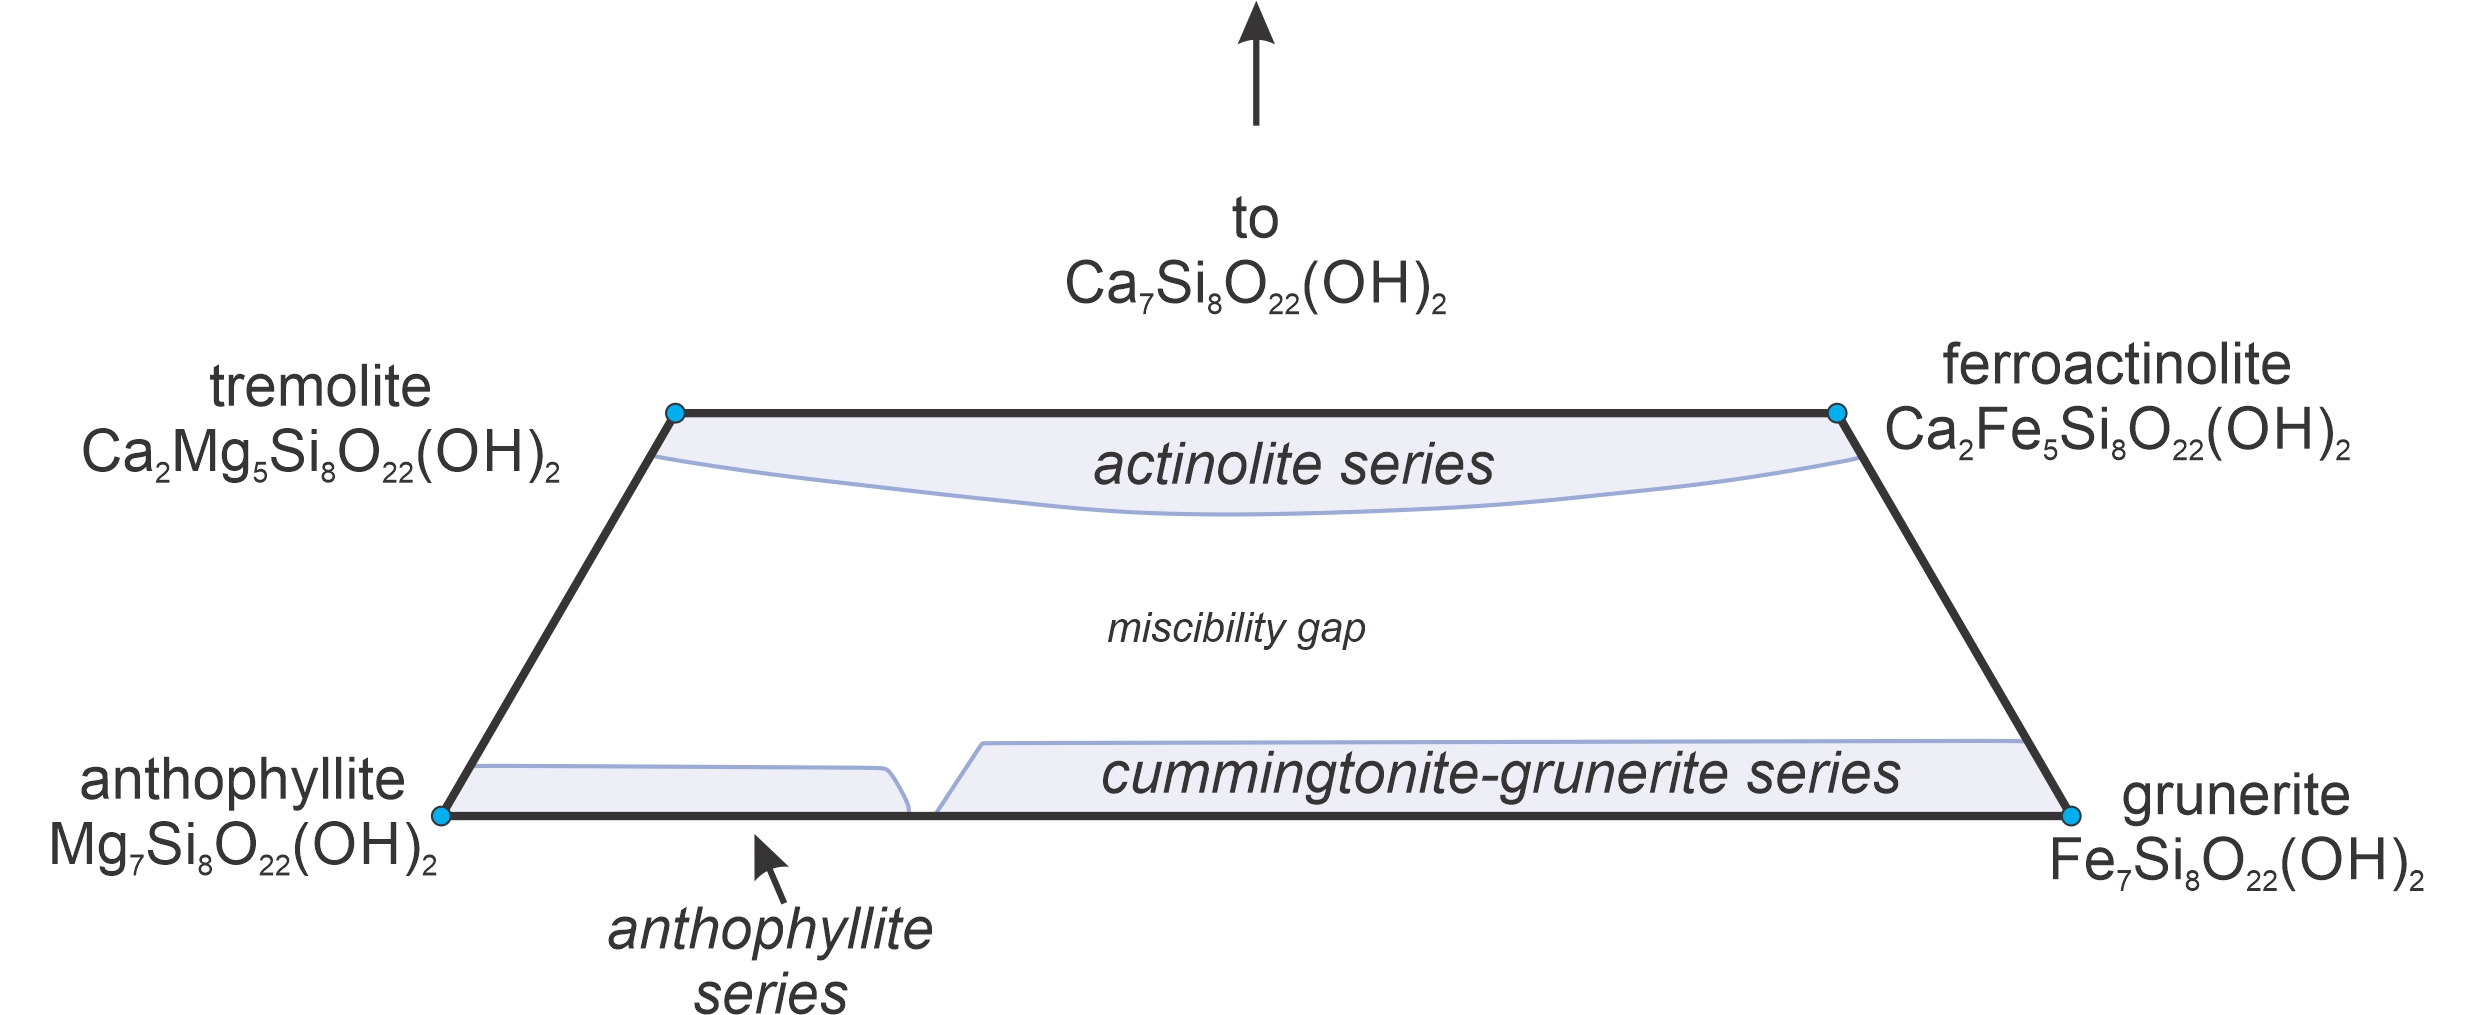
Figure 8.74 is a simplified amphibole quadrilateral, similar in many ways to the pyroxene quadrilateral but it is for amphiboles. Amphiboles are complex minerals with complex chemistries, but divide into two major groups: calcic amphiboles (clinoamphiboles) and calcium-free amphiboles (mostly orthoamphiboles). The four principal end-members are anthophyllite, grunerite, tremolite and ferroactinolite, labeled in the figure. Like the pyroxenes, a large miscibility gap separates the calcic amphiboles from those that are calcium-poor. The size and shape of this gap vary with pressure and temperature. And natural amphiboles, analogous with natural pyroxenes, always include components not depicted in Figure 8.74.
We could go on and look at diagrams depicting immiscibility for other minerals and mineral systems. But the examples we have just seen are adequate for now. They show the range and variety of phase diagrams and composition diagrams for some key mineral groups.
● Figure CreditsUncredited graphics/photos came from the authors and other primary contributors to this book. 8.4 Slope in Wales, anonymous, Wikimedia Commons |

