KEY CONCEPTS
- Metacarbonates form by metamorphism of sedimentary protoliths that contain significant amounts of carbonate minerals. These protoliths are mostly limestones or dolostones.
- The metamorphic reactions that occur, and the metamorphic minerals that form, in metacarbonates depend on overall protolith composition.
- Mineral reactions in metacarbonate rocks commonly depend on the composition of H2O-CO2 fluids present during metamorphism.
- Mapping regional isograds based on minerals in metacarbonates can be problematic because, besides pressure and temperature, fluid composition affects the minerals that are present.
- The most common minerals in metacarbonates are Ca-, Mg-, or CaMg-silicates. Other minerals, including garnets and phlogopite, are also common.
- Key reactions that occur during carbonate metamorphism include decarbonation reactions, dehydration reactions, mixed-volatile reactions and, less commonly, solid-solid reactions. We commonly depict these reactions on T-X phase diagrams.
- Contact aureoles, with concentric zones containing different mineral assemblages, often develop when an igneous intrusion causes contact metamorphism of a carbonate sedimentary rock.
- Calcsilicates, metacarbonate rocks dominated by silicate minerals, are produced by metasomatism during metamorphism of carbonate sedimentary rocks.
- Calcsilicates may be in zoned skarns that develop adjacent to or around igneous intrusions.
15.1 Metacarbonates
Metacarbonates form by metamorphism of sedimentary protoliths that contain significant amounts of calcite or dolomite. Metacarbonates are not as common as metabasites or metapelites, but we are going to give them extra attention in this chapter. We do this for two related reasons. First, the reactions that occur during metamorphism of carbonate-rich rocks often depend on the compositions of fluids present during metamorphism. This is untrue of most other rock compositions. Second, discussion of the role of fluids leads naturally to discussion of T-X phase diagrams, an important kind of diagram that we skipped (on purpose) when discussing reactions and phase diagrams in Chapter 11.
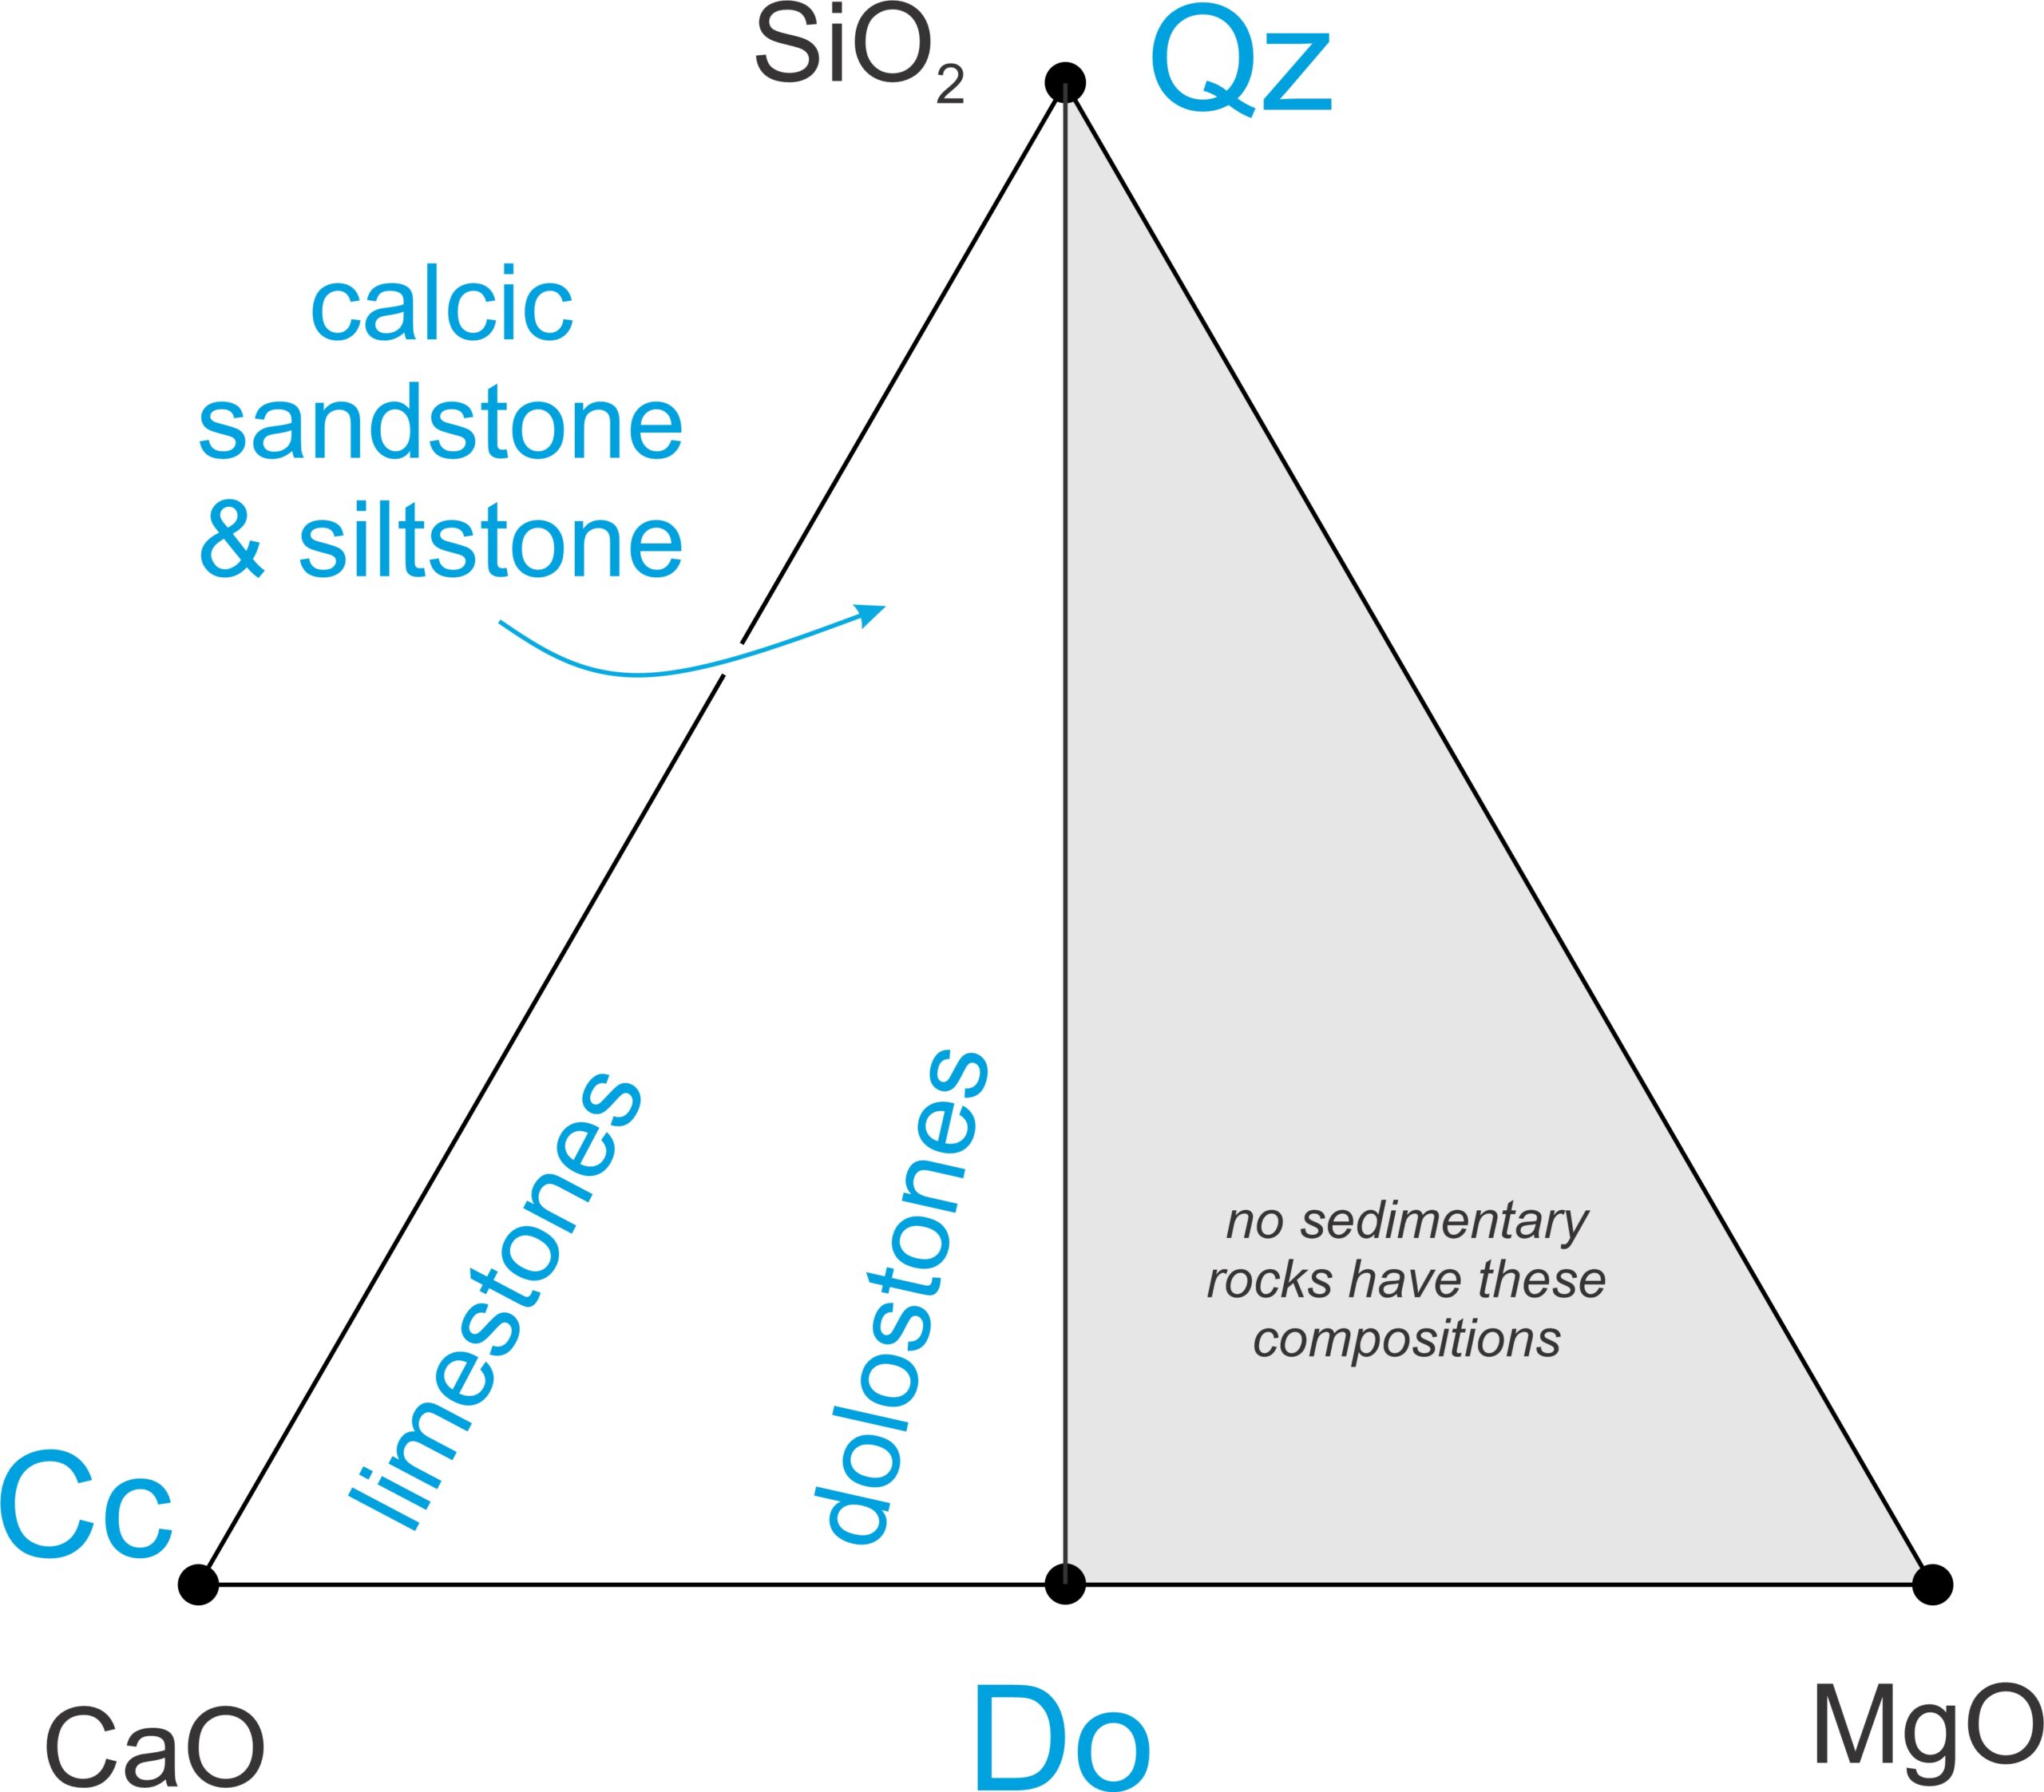
Metacarbonate protoliths may be clastic or chemical sedimentary rocks. They are mostly limestones and dolostones, dominated by carbonate minerals. Less commonly, the protoliths are calcareous shales and mudstones (both often called marls), or calcareous siltstones or sandstones. Figure 15.1 shows the range of compositions projected onto the SiO2-CaO-MgO plane. Clay-rich rocks, such as calcareous mudstones or shales, do not plot on this diagram.
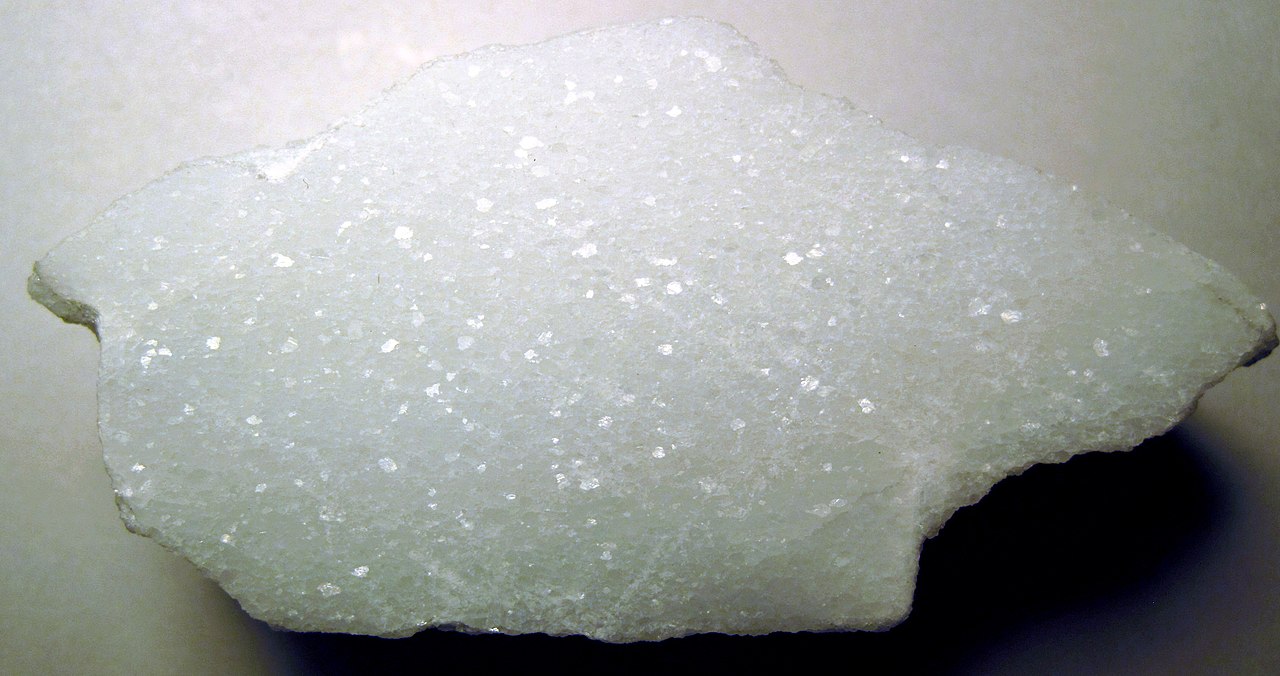
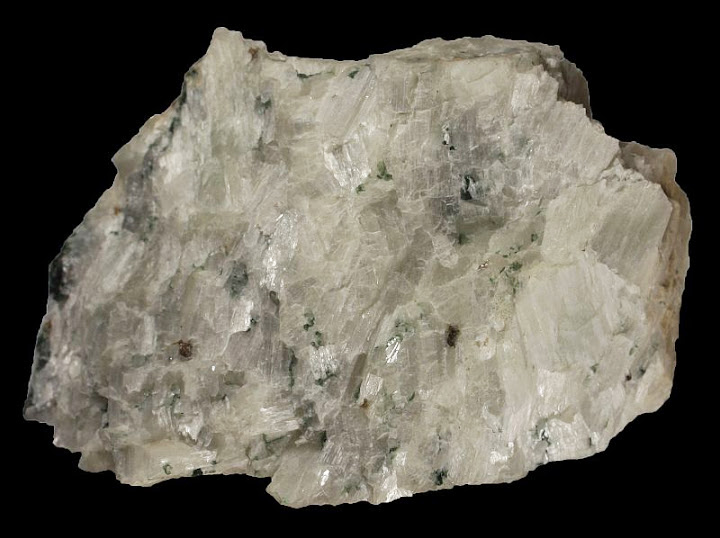
If the protolith is made mostly of calcite or dolomite, or a combination of the two, metamorphism typically causes recrystallization as small grains combine to become larger. Generally, for such rocks, no new minerals will form during metamorphism. We call metacarbonates made entirely, or mostly, of carbonate minerals, marbles. (In the construction industry, the term marble is used in a more generic sense to refer to any composition rock that can be cut into slabs and polished.) Figure 15.2 is a photo of a marble from Colorado that contains nothing but white calcite. This kind of marble is the official “state rock” of Colorado. Figure 10.28 is another example of a marble that is entirely calcite.
Although some limestones or dolostones are made entirely of carbonate minerals, most carbonate-rich sediments contain other minerals too. Chert, quartz, clays, and Fe-oxides are particularly common. The amounts of these additional components range from none to being dominant. Marine limestones, for example, typically contain minor amounts of chert. At the other end or the spectrum, clays dominate calcareous mudstones, and quartz dominates calcareous sandstones or siltstones.
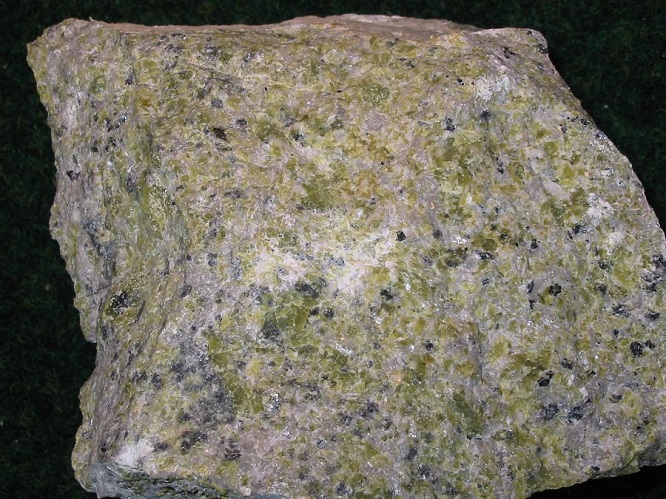
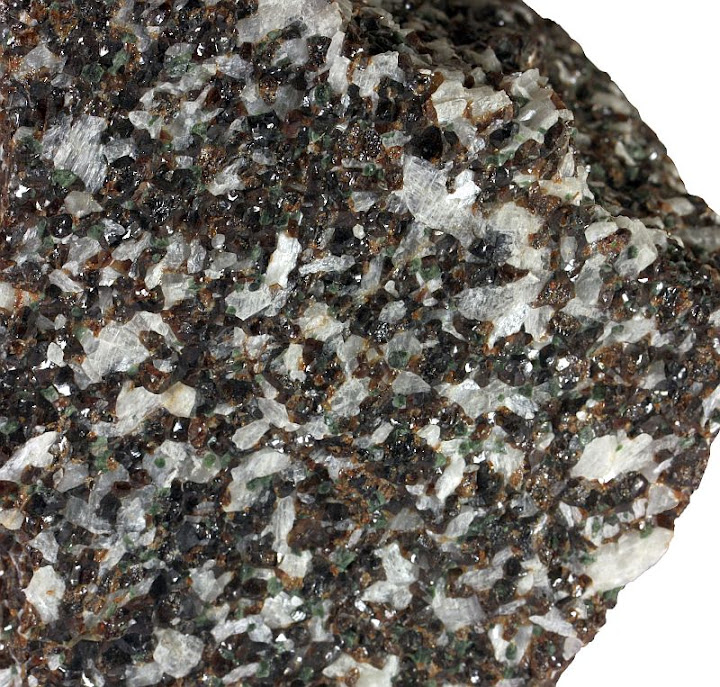
If a protolith contains significant amounts of non-carbonate minerals, many intriguing silicate minerals may form during metamorphism. These include tremolite, diopside, forsterite, Ca-rich garnet (grossular or andradite), wollastonite, and others. The metamorphic minerals that develop depend on the protolith composition, but most are calcium-, magnesium-, or calcium-magnesium-silicates. Figure 15.3, for example, is a photo of a forsterite (Mg2SiO4) marble, and Figure 10.34 shows an example of a diopside (CaMgSi2O6) marble. Phlogopite (Mg-rich biotite), and some other minerals that are not a CaMg- silicates, are also common in some kinds of marbles.
If silicate minerals make up most, or a significant amount of a metacarbonate rock, we call the rock a calcsilicate rock, or just a calcsilicate. Some calcsilicate rocks contain neither calcite nor dolomite because these minerals were entirely consumed by decarbonation reactions during metamorphism. The rock seen in Figure 15.4 for example, contains no carbonates. It is mostly white wollastonite with minor green diopside and red garnet. Figure 10.35 is another example of a calcsilicate rock; it contains mostly red garnet and white wollastonite. Although calcsilicate rocks are quite rare, they have received much attention because of the intriguing mineralogical changes that occur during metamorphism, and because they can tell us about the nature and composition of metamorphic fluids. Metamorphism of siliceous dolomites, in particular, has been the focus of much investigation because of all the fascinating minerals that may be created. Several photos in Chapter 16 show examples of calcsilicates that contain wollastonite, montecellite, and vesuvianite.
BOX 15.1 Minerals, Abbreviations and FormulasTable 15.1 lists minerals, formulas, and abbreviations used in figures and some other places in this chapter. For the rest of this chapter, we will omit mineral formulas from reactions and just use mineral names.
|
|||||||||||||||||||||
15.2 Decarbonation Reactions
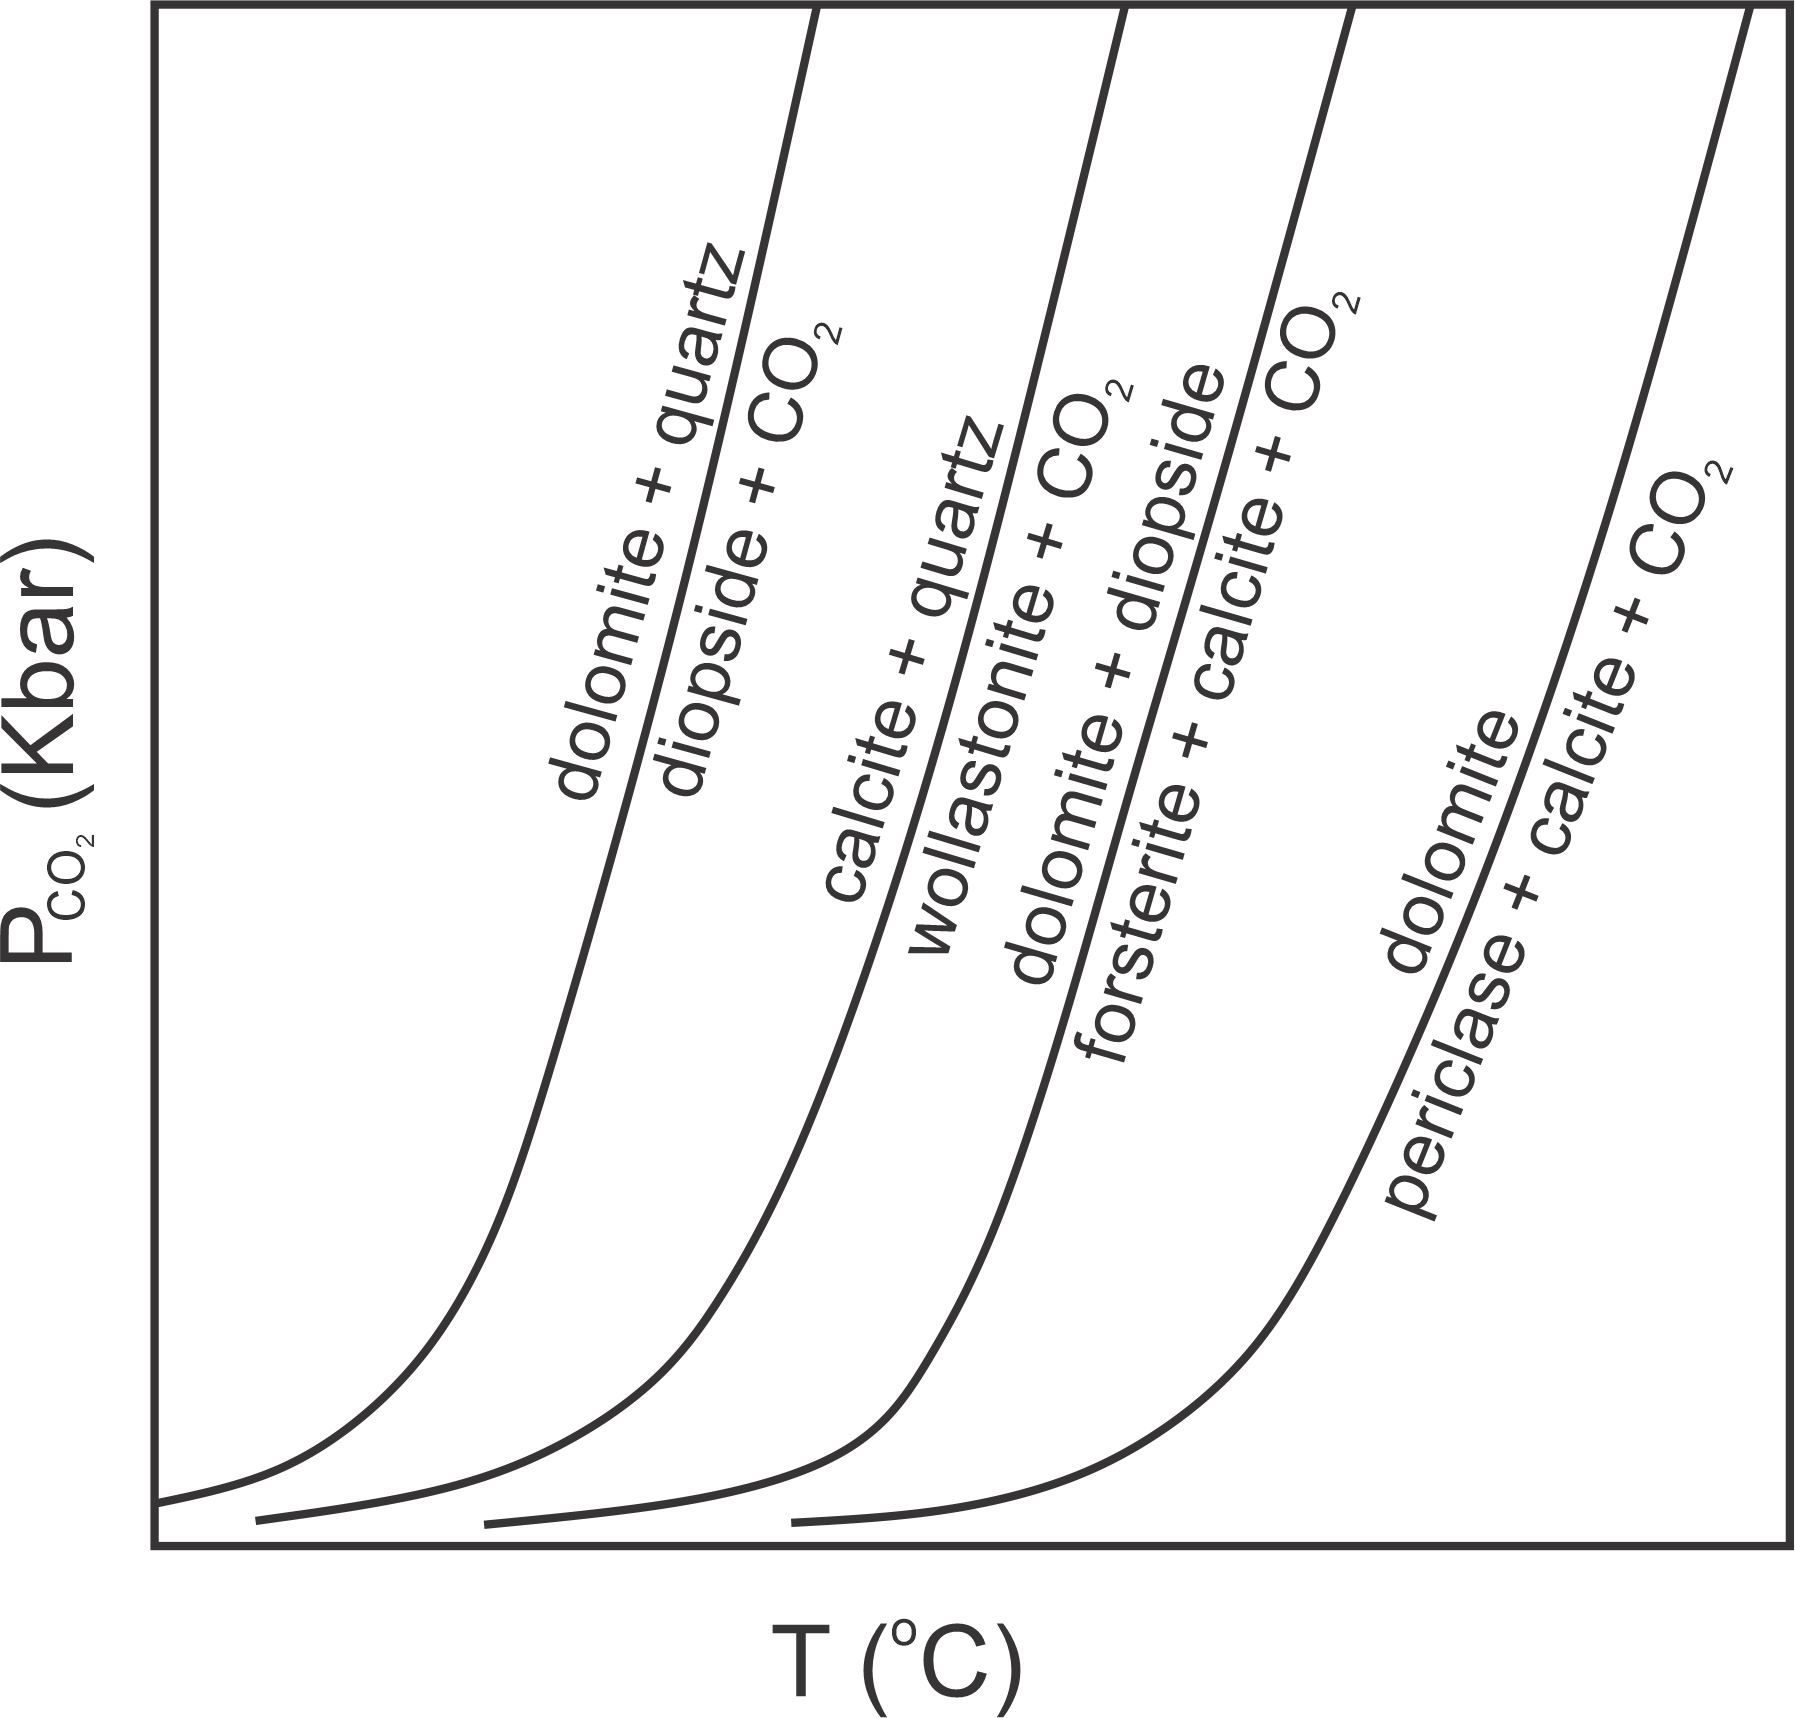
A key difference between metamorphism of carbonate rocks and metamorphism of pelites, or of mafic rocks, is that many of the most important metamorphic reactions in carbonate-rich rocks are decarbonation reactions. Figure 15.5 shows four example reactions that might produce diopside, wollastonite, forsterite, or periclase during metamorphism. These phases and reactions belong to the 4-component CaO-MgO-SiO2-CO2 system. So reactions may contain five phases, but four of the reactions in this figure are degenerate. The univariant reaction lines in this diagram separate divariant fields where four phases may coexist.
The “P” in the vertical axis label in Figure 15.5 has a subscript CO2. This is to remind us that (unless otherwise specified) when looking at a P-T diagram, we can assume that the fluid pressure is equal to the total pressure – meaning the rock is saturated with fluid. In this diagram all reactions involve CO2 and, by implication, the fluid in the rock is 100% CO2.
In previous chapters we looked at P-T diagrams involving dehydration reactions. For those diagrams, it was implicit that the fluid present was 100% H2O. Metamorphic fluids may be mostly H2O or mostly CO2, or somewhere between. (Other fluids are generally present in small amounts.) But, we only rarely show decarbonation and dehydration reactions on the same P-T diagram. If we do, we usually specify the partial pressures of both CO2 and H2O. Adding further complications: it is possible, although uncommon, that metacarbonates are not saturated with fluid. In such cases, the total fluid pressure does not equal the load pressure. However, we will ignore that complication in this chapter.
So, CO2 can be a major part of the metamorphic fluid present as marbles or calcsilicate rocks develop. (In contrast, metamorphic fluids in metapelites and metabasites are generally close to pure H2O). Of great significance, the relative amounts of CO2 and H2O in metacarbonates have a major influence on the metamorphic reactions that may occur. Consequently, analyzing phase equilibria in carbonate rocks involves (besides P and T) another dimension: fluid composition. Because most of the metamorphic fluids in carbonates contain only H2O and CO2, we generally describe fluid composition by specifying the mole fractions (X) of one of these two components. We may say, for example, that XCO2 = 0.32, meaning the fluid is 32 mol% CO2. (The remaining 68% is H2O.)
15.2.1 What Happens When XCO2 Changes?
The P-T diagram in Figure 15.6 depicts the reaction:
| [Rxn 1] | calcite + quartz = wollastonite + CO2 |
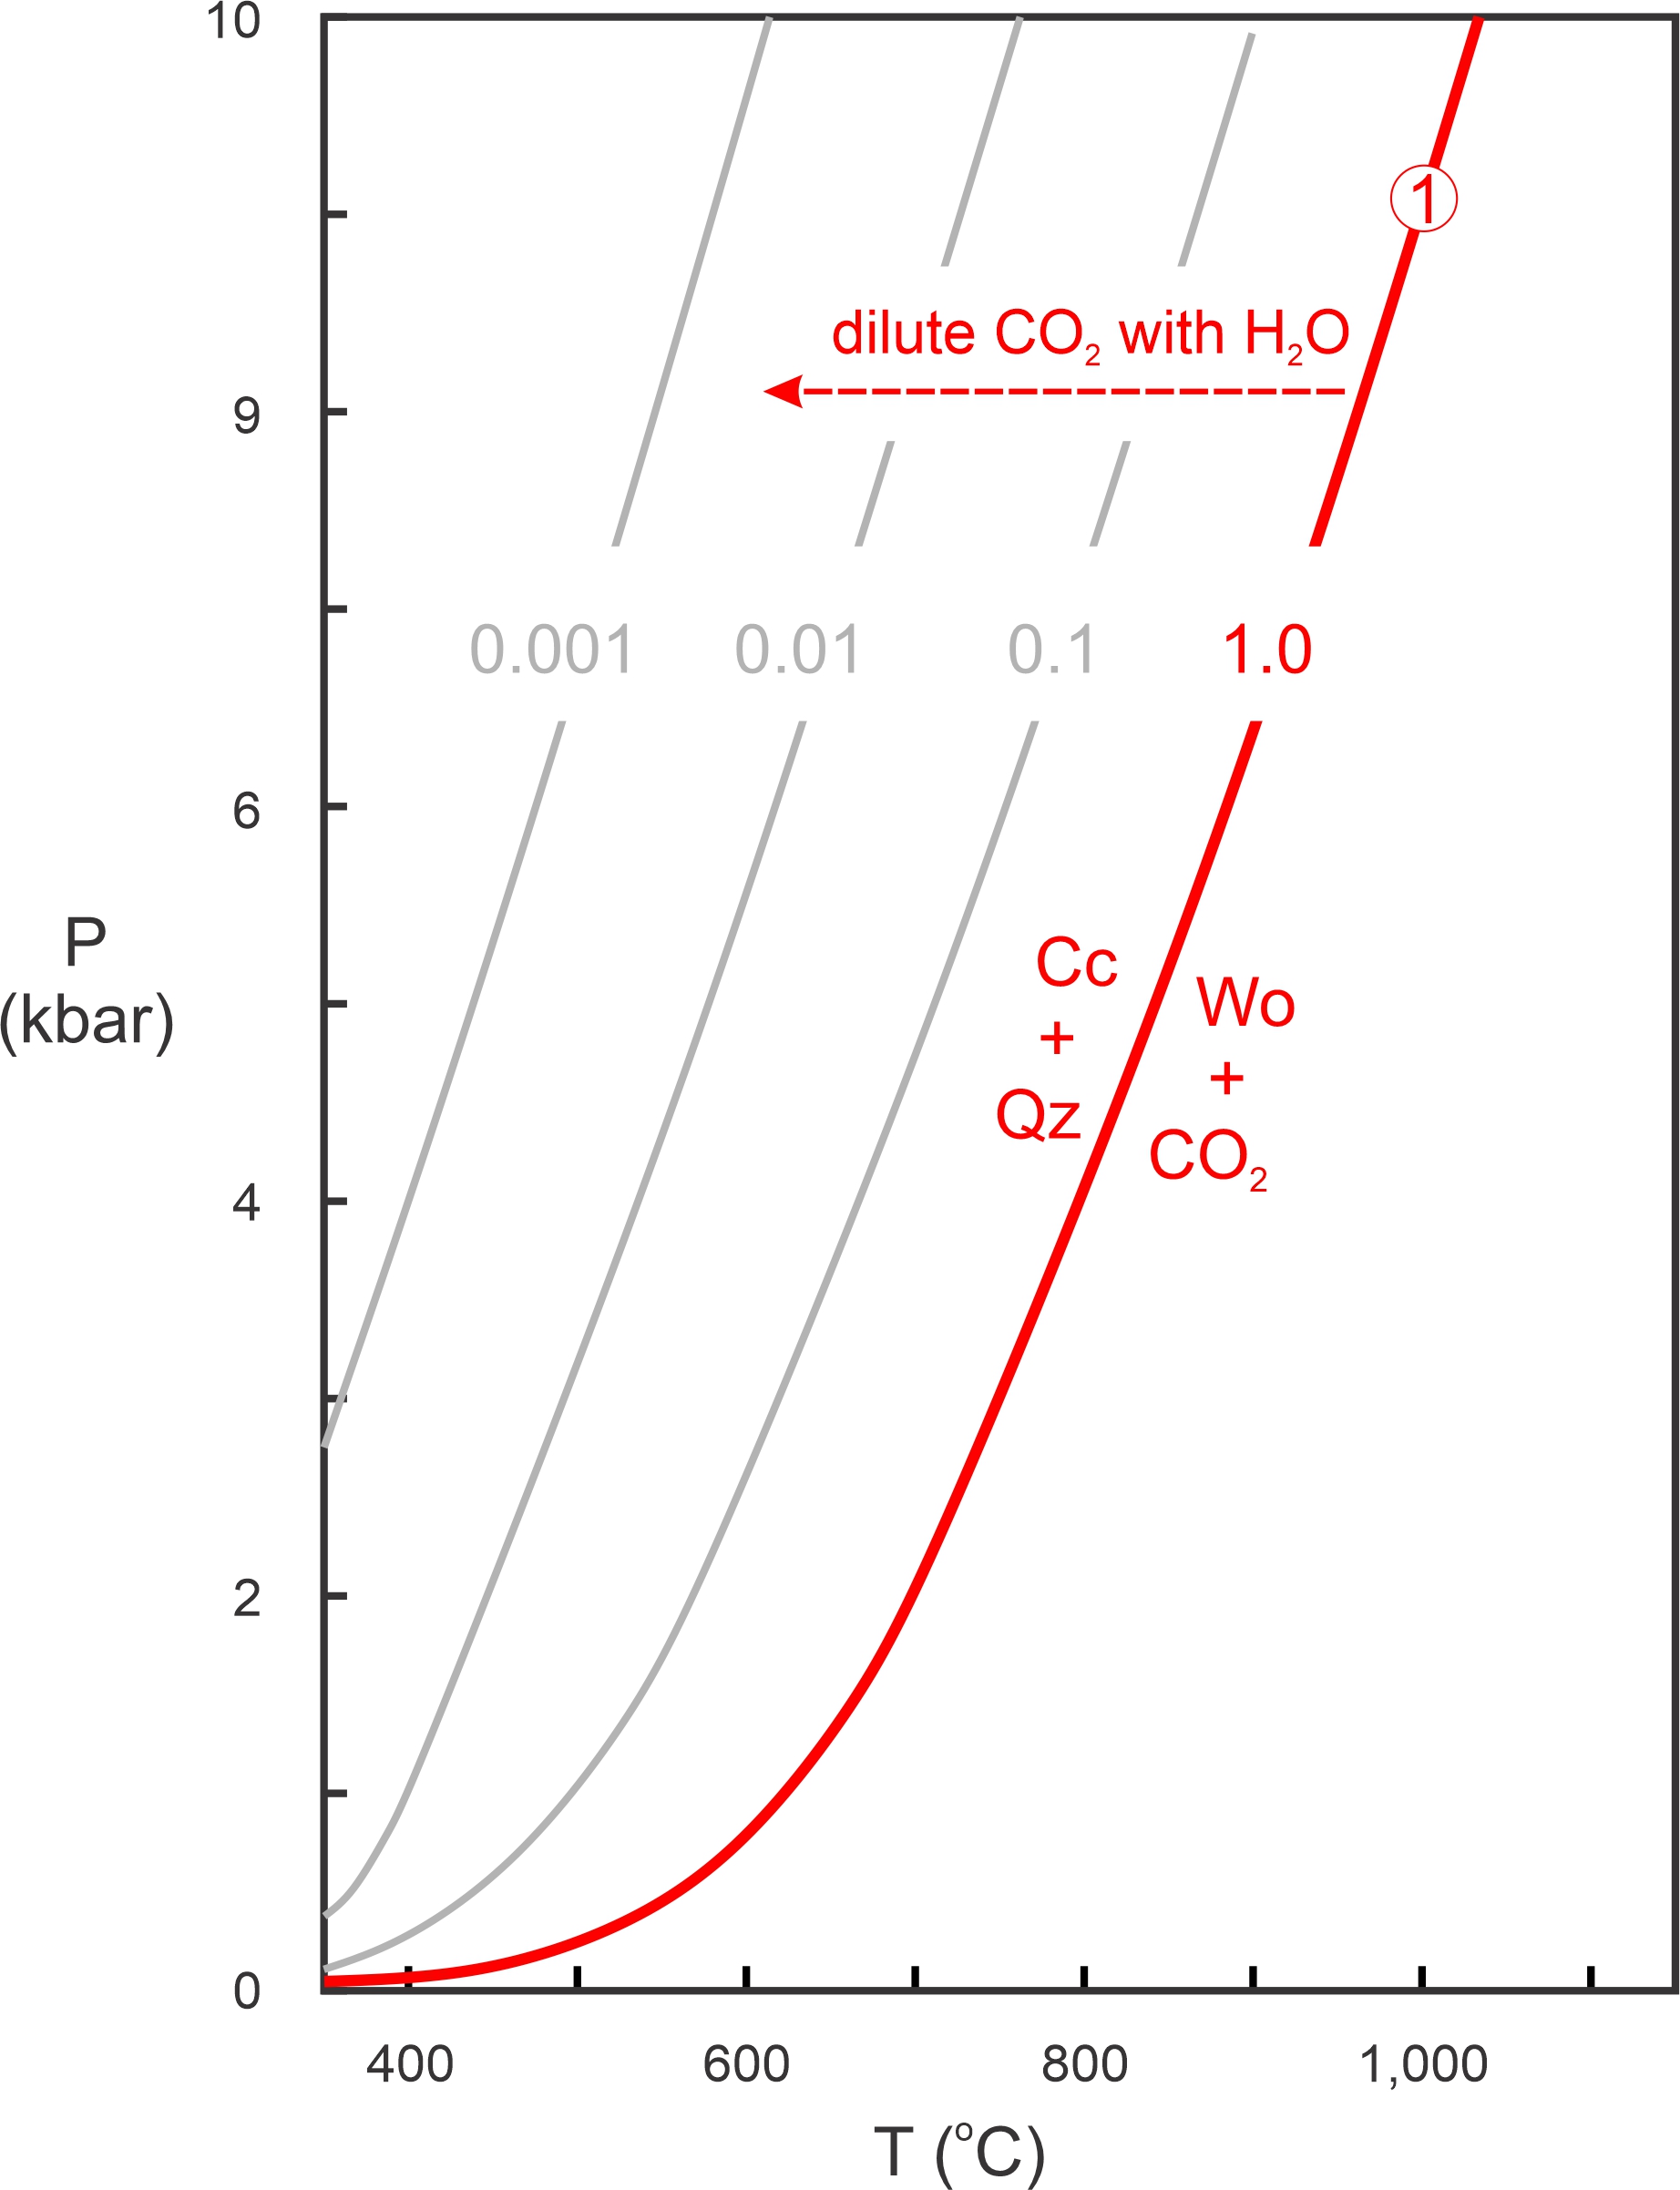
The red line shows P-T conditions for the reaction if XCO2 = 1 (if the fluid is 100% CO2). Lighter gray lines show where the reaction occurs if the fluid contains H2O and less CO2 (XCO2 = 0.1, 0.01, or 0.001). As we saw in Chapter 12, diluting a phase on one side of a reaction extends the stability of that side of the reaction. So, decreasing the mole fraction of CO2 in the fluid moves the reaction to the left. In thermodynamic terms, diluting the CO2 decreases the activity of CO2 and thus decreases the reactivity of wollastonite + CO2 (right side of Reaction 1). So, Reaction 1 shifts to lower temperature. The isopleths for XCO2 are about evenly spaced as the log of XCO2 goes from 0, to -1, to -2, and to -3. We saw this same kind of even spacing involving activities and equilibrium constants when we looked at solid-solid reactions in Chapter 12. See, for example Figures 12.5 and 12.6.
15.3 T-X Diagrams
If we are considering many reactions and wish to plot them on the same P-T diagram, but for varying values of XCO2, our diagram can become complicated and cluttered in a hurry. So, instead of using P-T diagrams so show the effects of changes in fluid compositions, we generally use T-X diagrams.
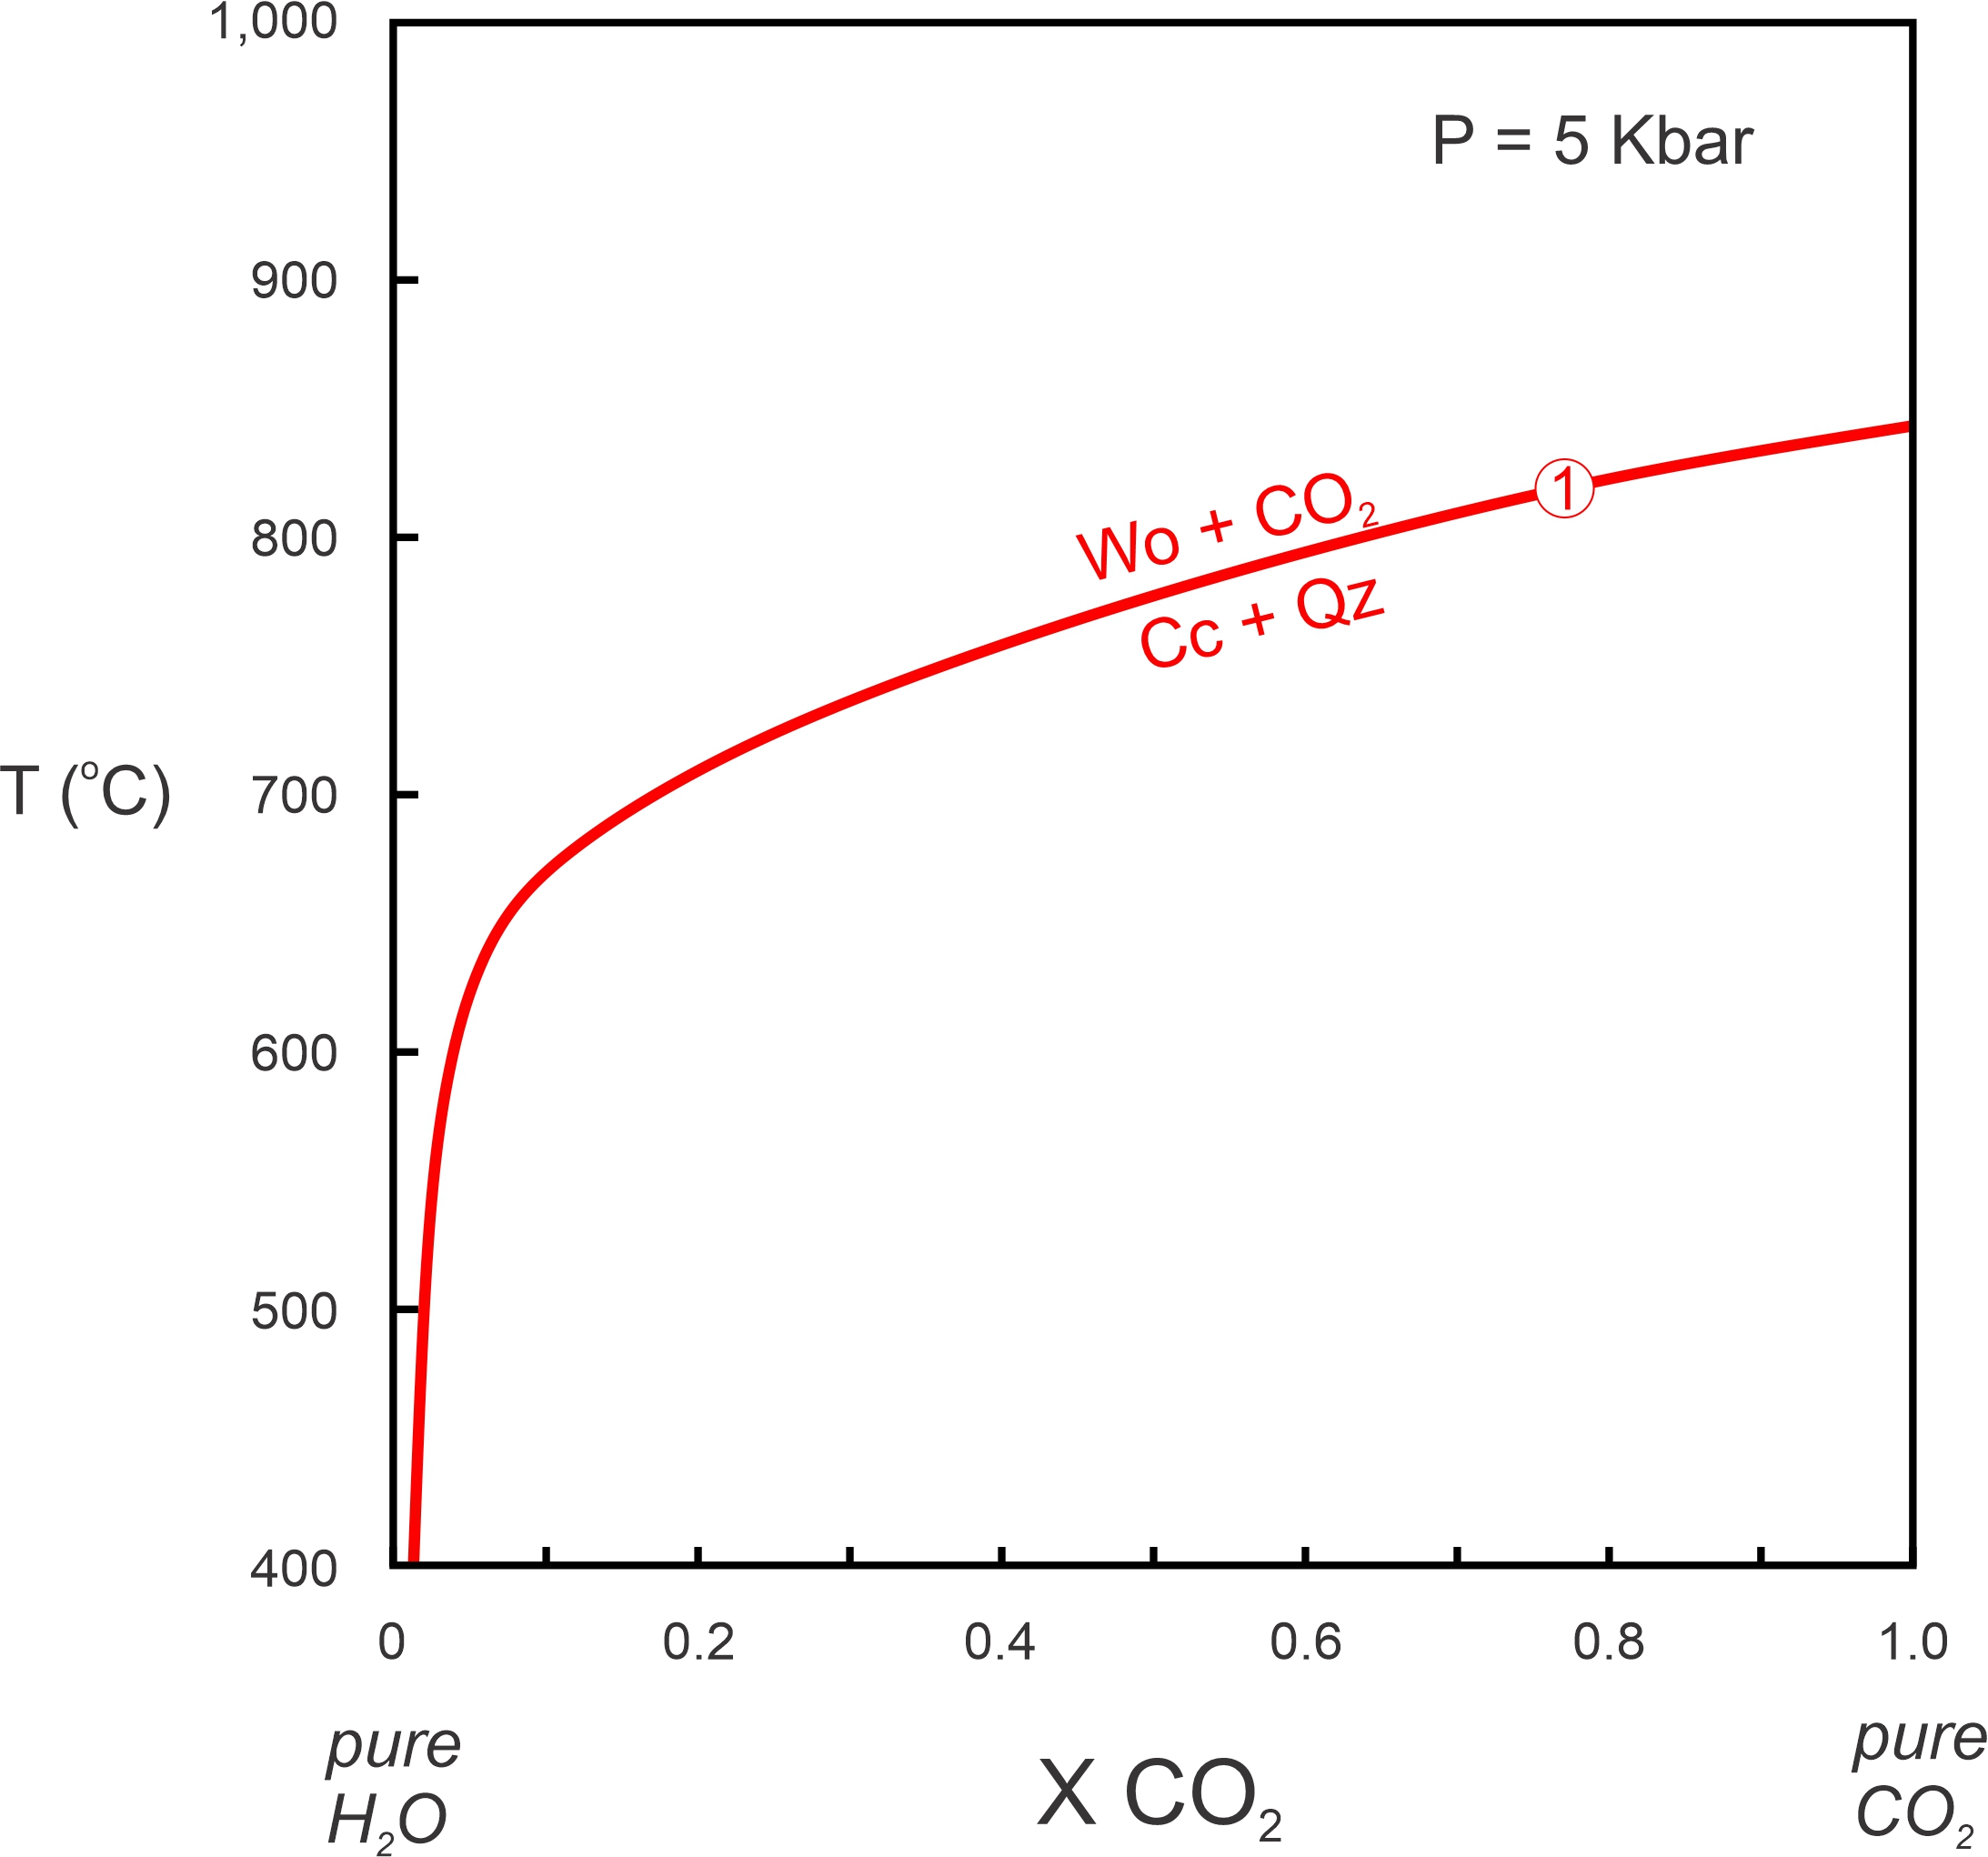
Figure 15.7 is a T-X diagram for Reaction 1 at 5 Kbar. The horizontal axis is fluid composition and the vertical axis is temperature. T-X diagrams, like the one seen in Figure 15.7, will change if pressure changes. Because most metamorphic reactions have positive slopes on P-T diagrams and take place at higher pressure if temperature increases, we must specify the pressure or a T-X diagram has little value.
Although the axes are different, Figures 15.6 and 15.7 are consistent. Both figures show Reaction 1 taking place at just below 850 oC for pure CO2 at 5 Kbar And both show that, as water is added to the fluid and XCO2 decreases, the reaction moves to lower temperatures.
In Figure 15.7, the reaction curve (red) becomes tangential to the vertical axis as XCO2 approaches 0 – it can never get to 0. Why? Because calcite is always unstable if no CO2 is present. Thermodynamics tells us that there would be an infinite amount of energy driving calcite to decarbonate if CO2 is completely absent. So any reaction that involves calcite can never reach the left side of the diagram where XCO2 = 0. (Similarly, any reaction that involves H2O can never reach the right side where XCO2 = 1.)
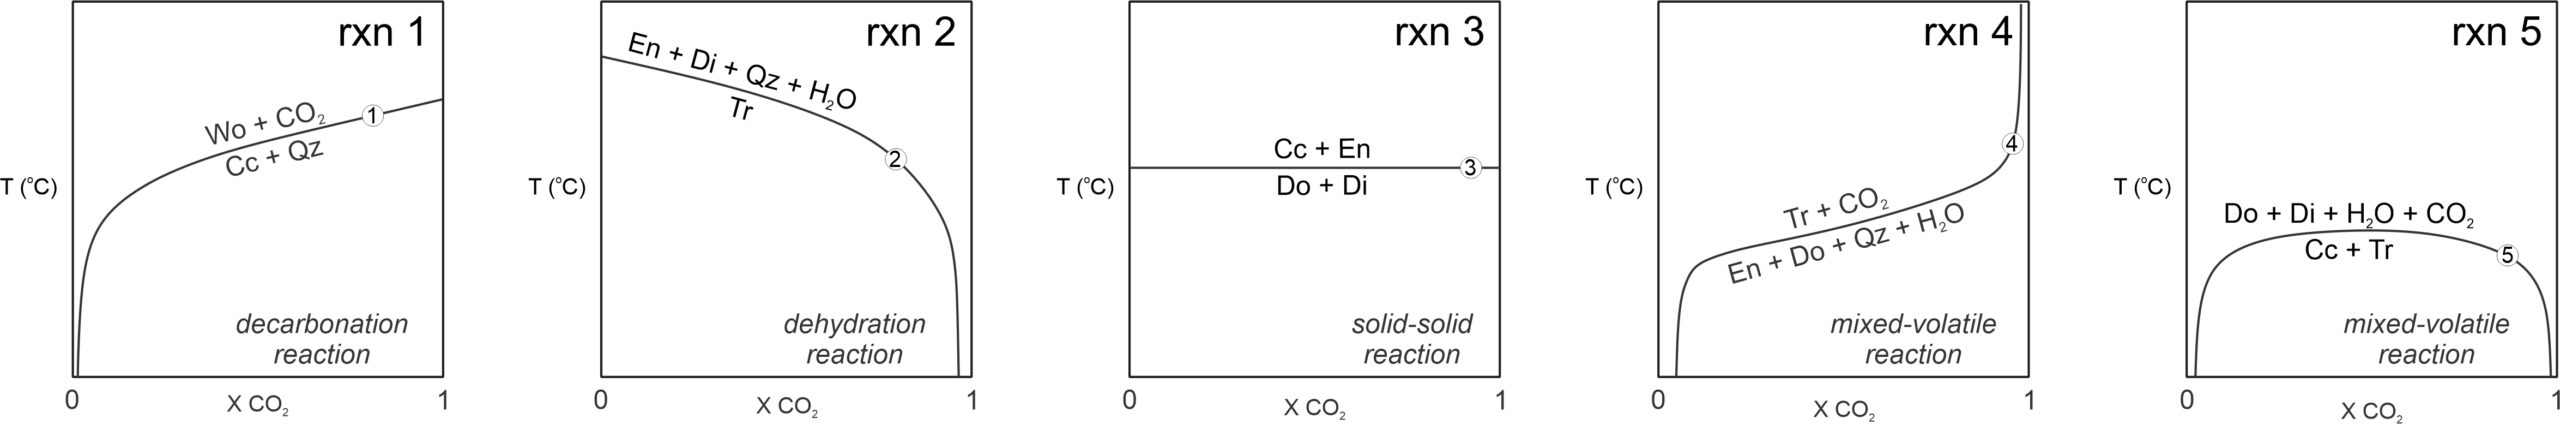
15.3.1 Different Kinds of Reactions on T-X Diagrams
Figure 15.8 depicts five different kinds of reactions plotted on T-X diagrams. For the two reactions that involve H2O or CO2 but not both (Reactions 1 and 2), the fluid appears on the high-temperature side of the reaction, as is normal for dehydration or decarbonation. In Figure 15.8, Reaction 1 is the same decarbonation reaction we just discussed – the reaction that creates wollastonite from calcite and CO2. It intersects the right side of the diagram but is tangential to the left side. Reaction 2, a dehydration reaction, intersects the left side of the diagram, where XH2O = 1, at a specific temperature. It is tangential on the right side, where XCO2 = 1 (no H2O is present):
| [Rxn 2] | tremolite = 3 enstatite + 2 diopside + quartz + H2O |
 15.8 Different kinds of reactions on T-X diagrams
Reaction 3, a solid-solid reaction, plots as a horizontal line on the T-X diagram because it does not involve fluid and so occurs at the same temperature no matter the fluid composition:
| [Rxn 3] | dolomite + diopside = 2 calcite + 2 enstatite |
Reaction 4, is a mixed-volatile reaction (meaning it involves both H2O and CO2):
| [Rxn 4] | 3 enstatite + 2 dolomite + 5 quartz + H2O = tremolite + 4 CO2 |
Because it includes both H2O and CO2, the Reaction 4 curve can never reach either side of the diagram. H2O is on the low-temperature side and CO2 on the high-temperature side of this reaction. But some mixed-volatile reactions (none shown in Figure 15.8) have it the other way around, with H2O on the high-temperature side and CO2 on the low-temperature side.
Reaction 5, involving dehydration and decarbonation, has both H2O and CO2 on its high-temperature side, The reaction curve has an upside-down U-shape and is tangential to both sides of the diagram in Figure 15.8:
| [Rxn 5] | 3 calcite + tremolite = dolomite + 4 diopside + H2O + CO2 |
15.3.2 T-X Diagrams are (Almost) the Same as P-T Diagrams
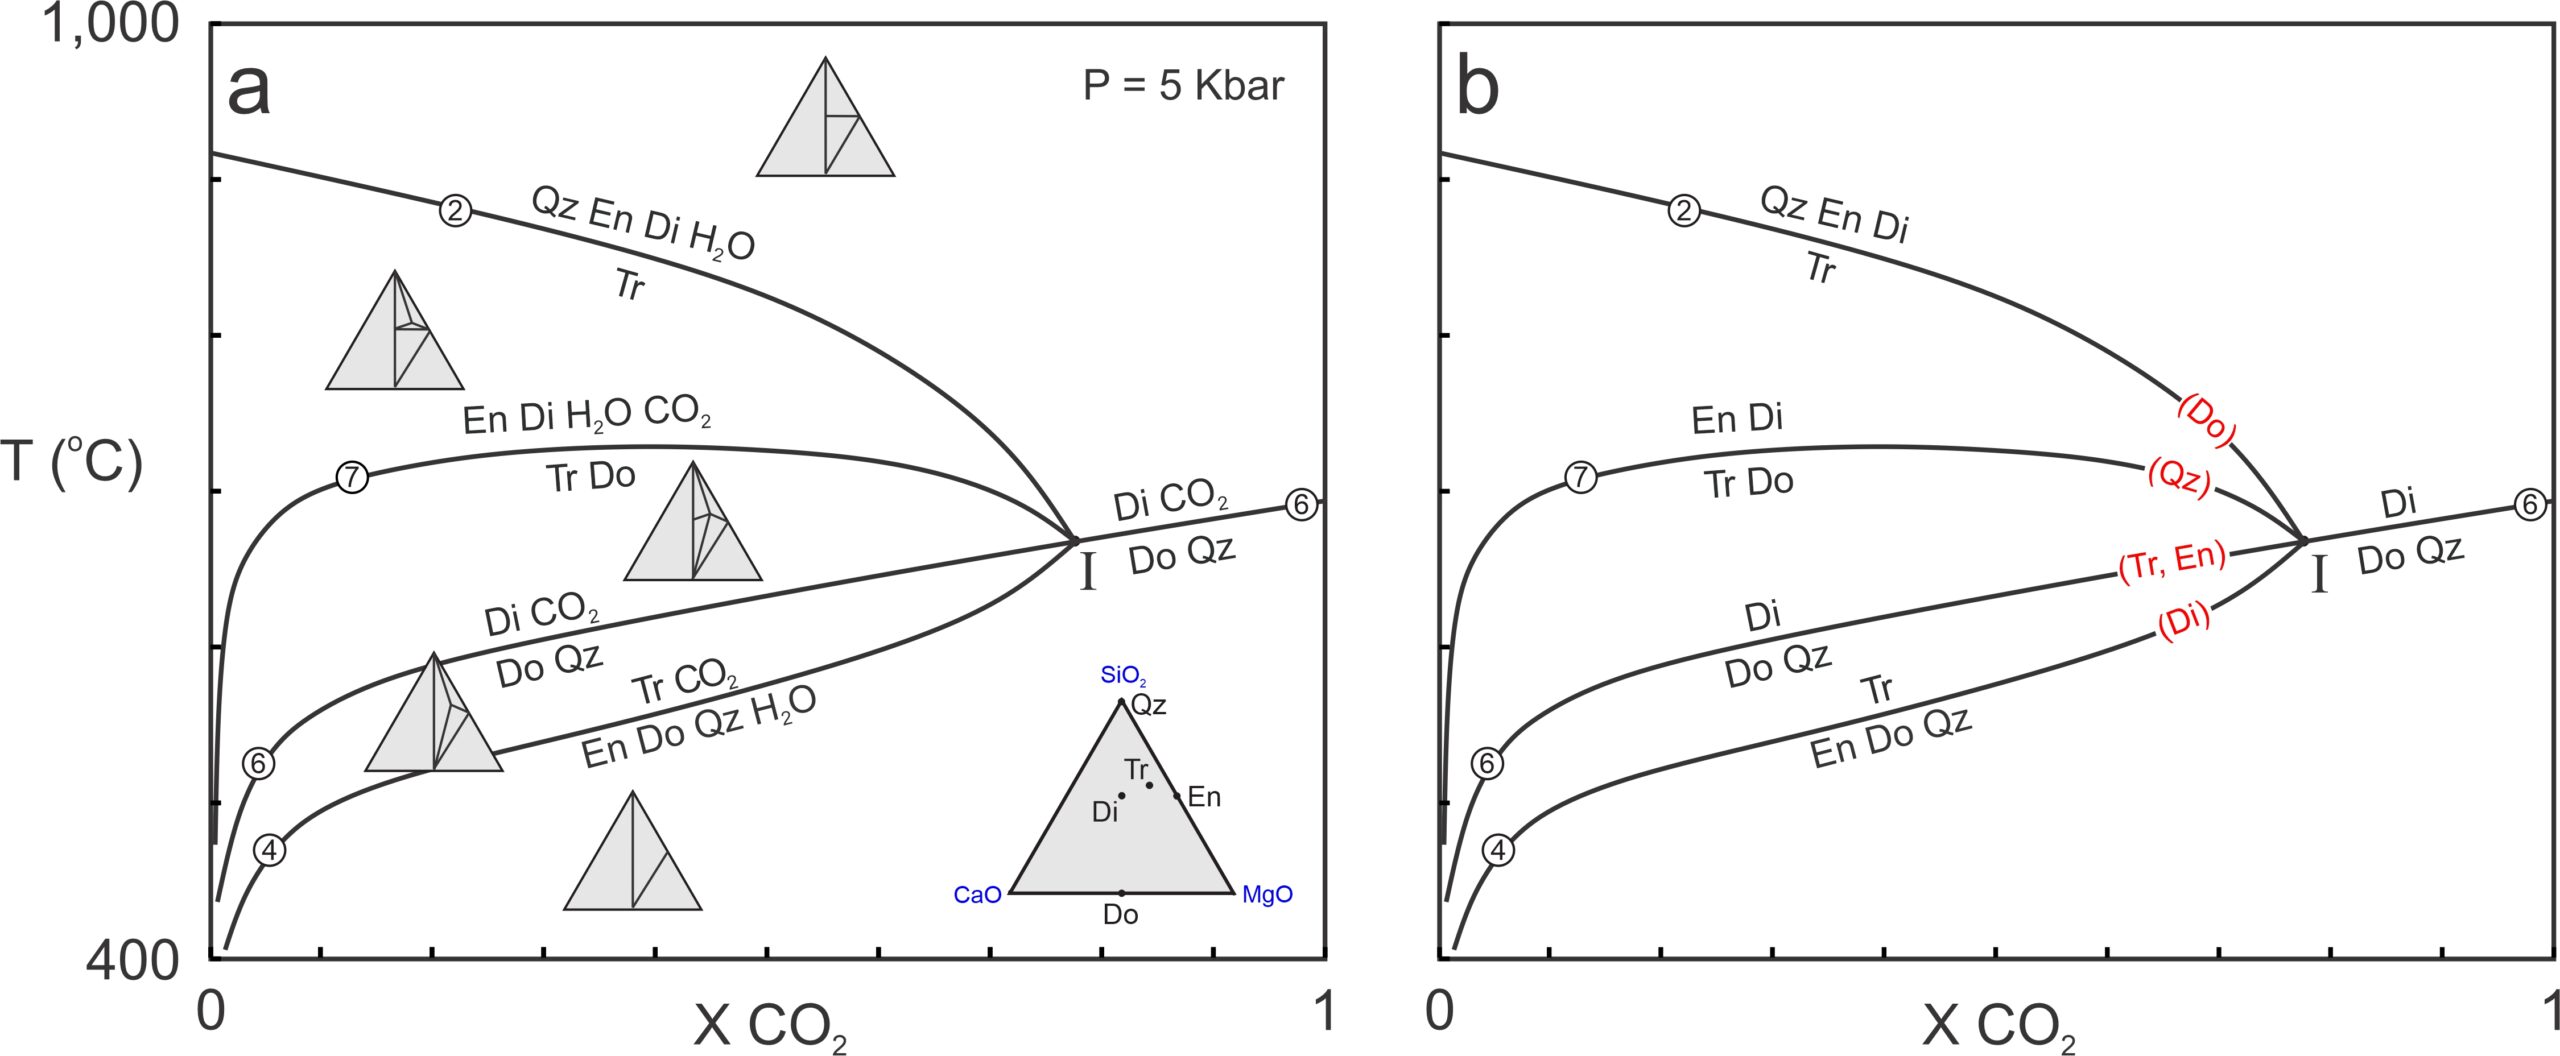
Reactions and reaction lines intersect and behave the same in T-X diagrams as they do in P-T diagrams. For example, Figure 15.9a contains four reactions involving seven phases: quartz, enstatite, diopside, tremolite, dolomite, H2O, and CO2. The seven phases belong to the 5-component CaO-MgO-SiO2-H2O-CO2 system and can coexist at invariant point I. We looked at reactions 2 and 4 previously; the other reactions in these phase diagrams are:
| [Rxn 6] | dolomite + 2 quartz = diopside + CO2 |
| [Rxn 7] | 2 tremolite + dolomite = 6 enstatite + 5 diopside + 2 H2O + 4 CO2 |
Triangular chemographic diagrams in Figure 15.9a, projected from CO2 and H2O, show stable mineral assemblages in divariant fields between the reaction curves. The reactions separating the fields include tie-line flip reactions, terminal reactions, and degenerate reactions. The phase rule tells us that, for a 5-component system, a non-degenerate reaction will involve six phases. Reactions 4 and 7 in Figure 15.9 are examples. Reaction 2, degenerate, involves only five phases. And reaction 6, doubly degenerate involves four phases.
Figure 15.9b is a simpler diagram showing the four reactions. As is often done in T-X diagrams, we have omitted H2O and CO2 from reaction labels. We did this because, when we are looking at a T-X diagram, it is implicit that an H2O-CO2 fluid phase is present. And eliminating unnecessary labels makes a diagram less cluttered and easier to see.
The four reactions in Figure 15.9 intersect at invariant point I. If reactions become metastable at the point, we have omitted their metastable extensions. Doubly degenerate Reaction 6 passes through the point, as often happens for degenerate reactions. The other three reactions stop at the invariant point. For example, Reactions 2 and 7 are metastable at temperatures below the invariant point because they involve diopside that, according to Reaction 6, is not stable at temperatures below the point.
Reaction 2 is a dehydration reaction that intersects the left side of the diagram in Figure 15.9 (where XCO2 = 0). If we showed its metastable part, it would become tangential to the right side (where XCO2 = 1). Similarly, Reaction 6, a decarbonation reaction, intersects the right but not the left side of the phase diagram. Although a bit tough to see (because metastable reaction lines are not shown) reactions 4 and 7, mixed-volatile reactions, are tangent to both sides of the diagram.
In Box 11.3, Chapter 11,we saw that reactions around an invariant point can be identified by the phases they do not include. Red print (with mineral abbreviations in parentheses) shows the missing phases in Figure 15.9b – each of the five mineral phases is missing from one reaction, two of them from the same reaction. Although not labeled in Figure 15.9, CO2 is absent from Reaction 2 and H2O is absent from Reaction 6.
15.4 A More Realistic Grid
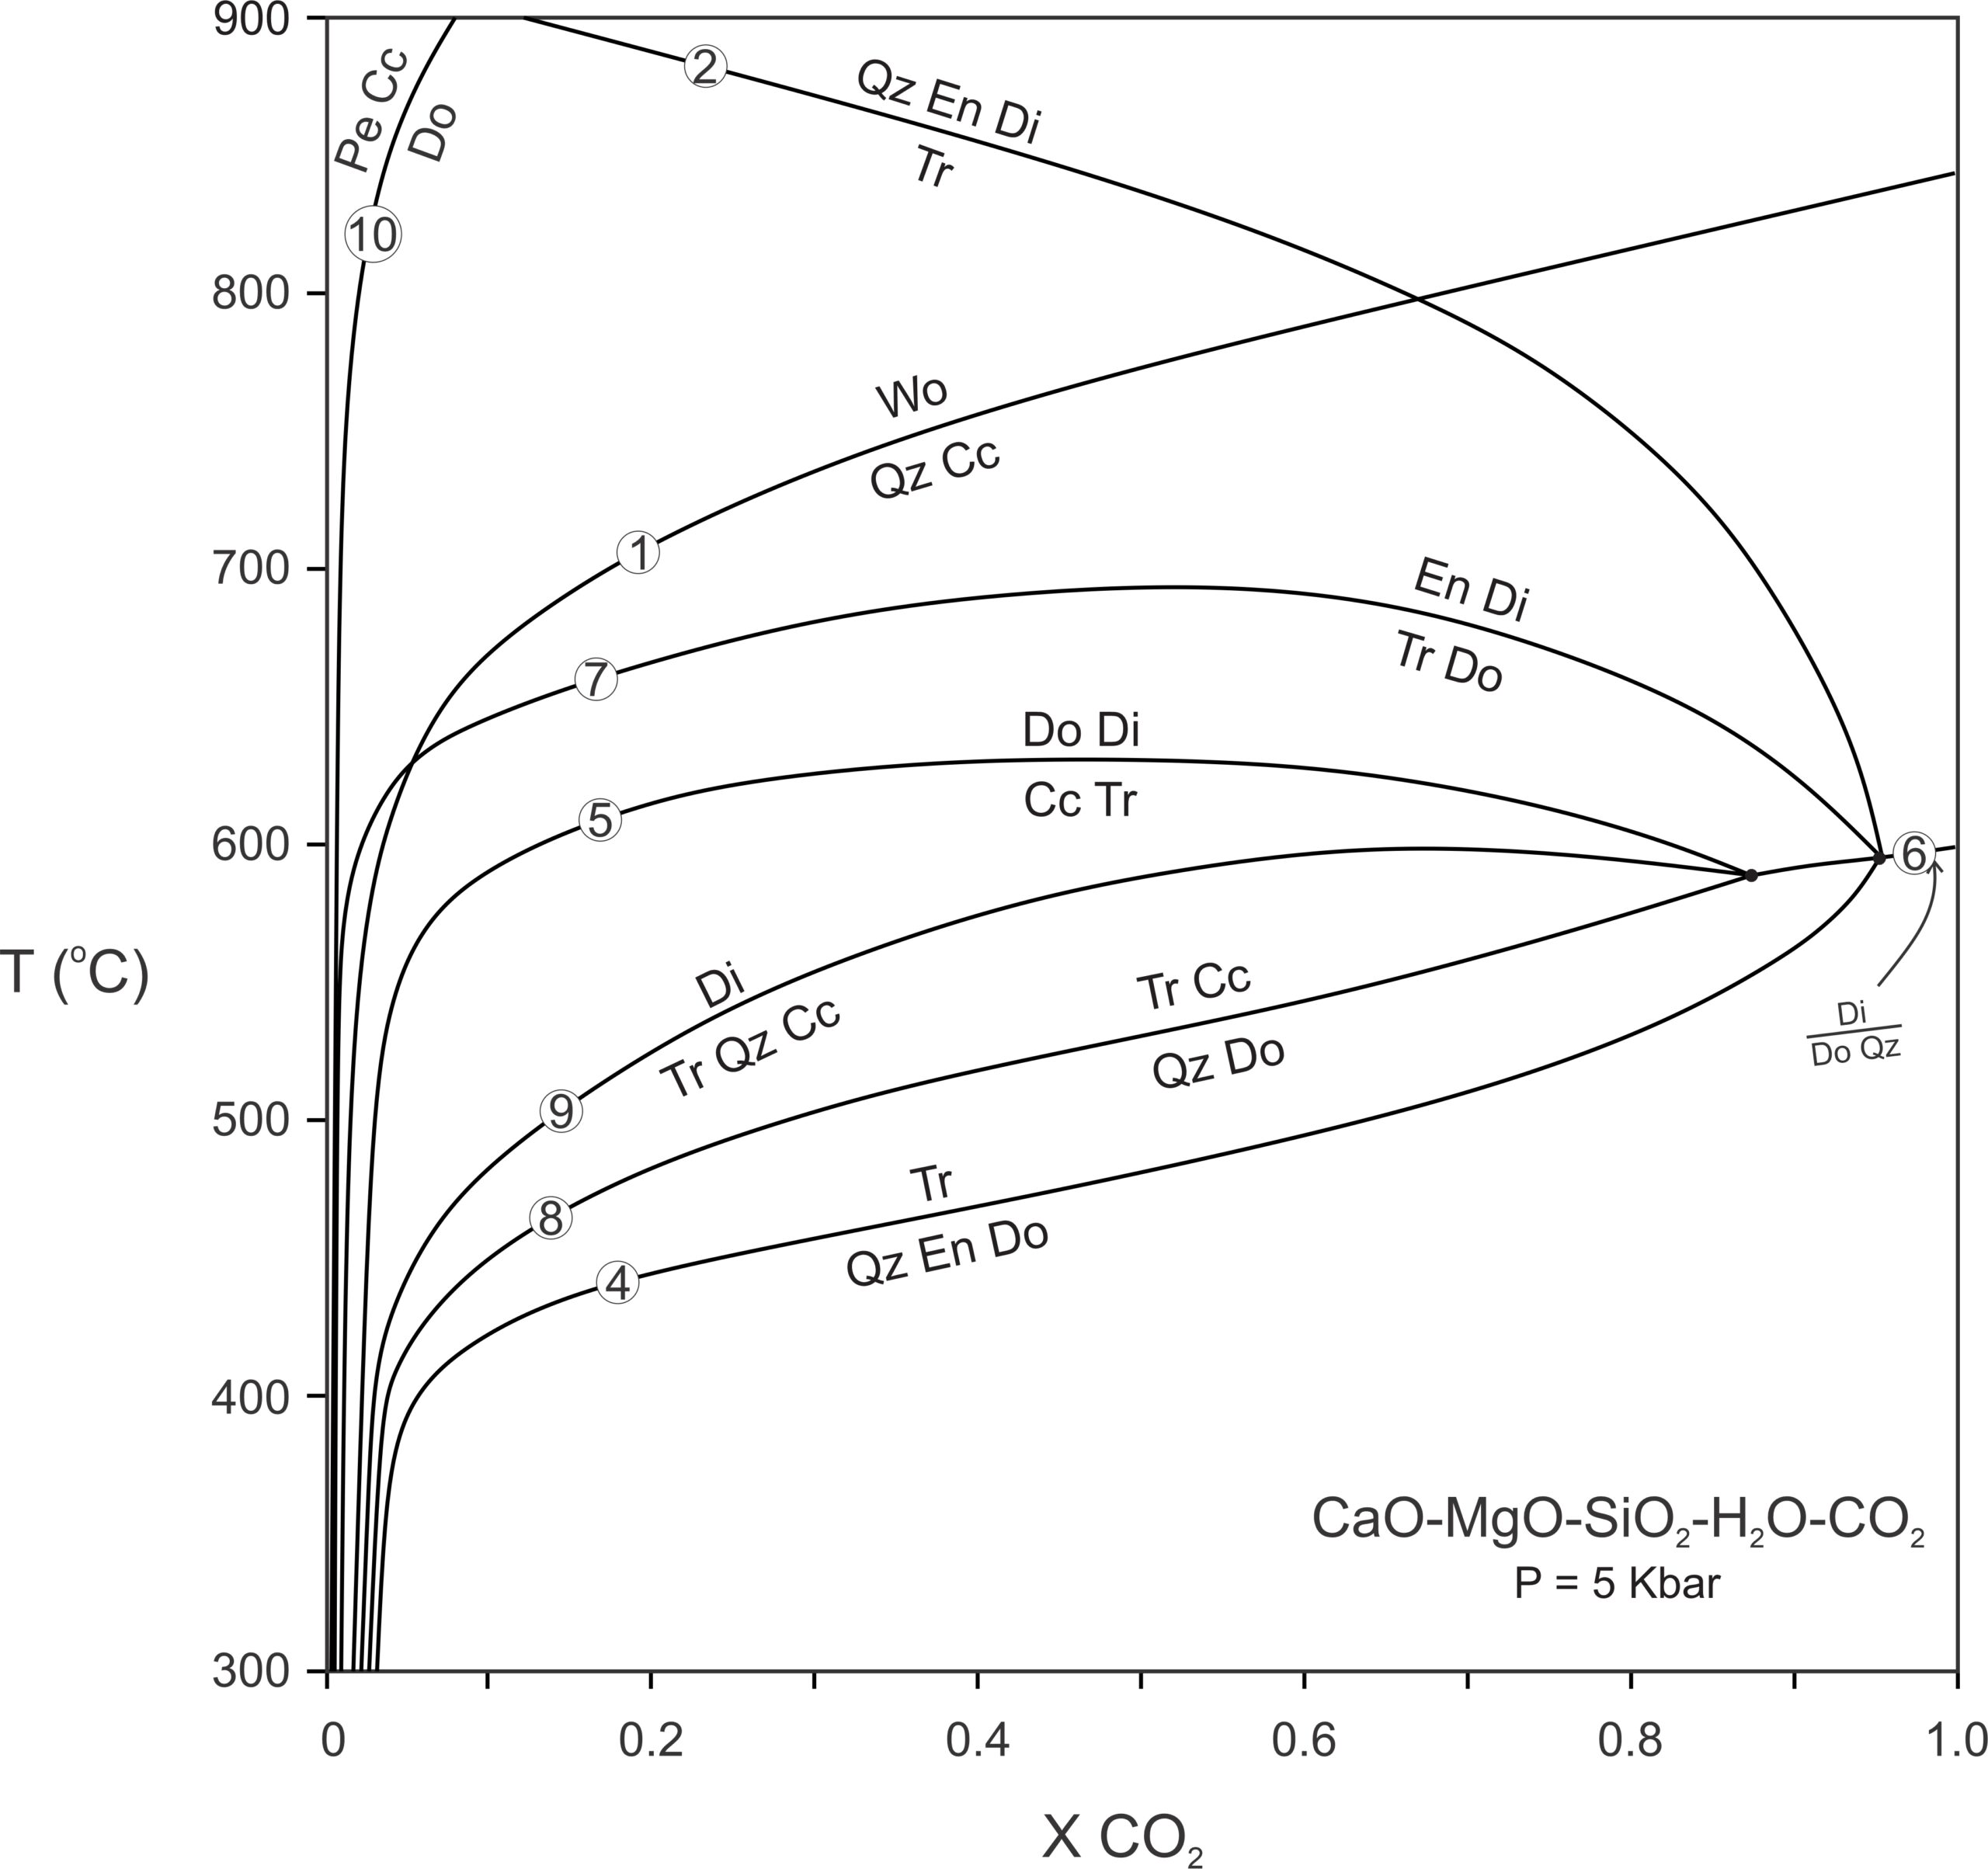
To keep things simple, we omitted many important reactions from the phase diagrams just seen. Figure 15.10 is a more complete T-XCO2 diagram for metacarbonates at 1 Kbar pressure. This diagram considers more minerals, and so is a better representation of what happens in natural systems.
Figure 15.10 contains all stable equilibria that involve the 10 most common phases in the CaO-MgO-SiO2-H2O-CO2 system. The specific reactions are not particularly important. The important thing is that different minerals and assemblages become stable at different temperatures depending on fluid composition. For example, if the fluid is very CO2 rich, tremolite may never form because dolomite and quartz will react to diopside (Reaction 6). On the other side of the diagram, periclase will only be stable if the fluid is extremely H2O-rich (Reaction 10). Wollastonite is stable for all fluid compositions but is more likely to be present when the fluid is H2O-rich unless temperature is quite high.
Figure 15.10 includes the following reactions that we have not seen before:
| [Rxn 8] | 5 dolomite + 8 quartz + H2O = tremolite + calcite |
| [Rxn 9] | tremolite + 2 quartz + 3 calcite = 5 diopside + 3 CO2 + H2O |
| [Rxn 10] | dolomite = periclase + calcite |
15.5 The Influence of Rock Composition
The minerals that form in a rock, and the metamorphic reactions that take place, depend on rock composition, sometimes called bulk composition. The phase diagram and pseudosections in Figure 15.11 (below) demonstrate these points. The reactions are some of the same as in previous examples but, to keep things simple, this diagram involves only six minerals, and we have omitted reactions involving calcite. Additionally, we shifted the invariant point to the left slightly to provide more room.

Figure 15.11a contains compositional triangles (projected from H2O and CO2) for each field in the phase diagram. Stable assemblages include three minerals. Consider two hypothetical rocks, having compositions plotting at X and Y in the triangles. At low temperature, composition X contains mostly dolomite with some calcite and quartz. When heated and metamorphosed it does not “see” – it is not affected by – Reaction 4 because it contains no enstatite. In fact, the only reaction that affects this rock is Reaction 6 that produces diopside from dolomite and quartz.
At low temperature, rock X contains calcite, dolomite, and quartz. At high temperature it contains calcite, dolomite, and diopside. The pseudosection in Figure 15.11b shows this. For an (arbitrary) fluid with composition XCO2 = 0.4, calcite, dolomite, and quartz are stable up to 620 oC, and diopside replaces quartz at higher temperatures.
Things are different for rock Y. In contrast with rock X, Reactions 4 and 7 affect rock Y. As seen in Figure 15.11c, at low temperature, rock Y contains dolomite, enstatite, and quartz. At high temperature it contains dolomite, enstatite, and diopside. At moderate temperatures it contains dolomite, tremolite, and enstatite. For fluid of composition XCO2 = 0.4, the assemblage Do-En-Qz gives way to Do-Tr-En at 555 oC, and the assemblage Do-Tr-En reacts to Do-En-Di at 730 oC.
We just looked at two examples at one pressure only. More complicated (and natural) systems may involve more significant components, reactions, and possible assemblages. But, always, the minerals that form during metamorphism will be different if pressure changes significantly. Additionally, stable mineral assemblages are generally different for different composition rocks.
| Chapter 16 Section 16.3.5 contains many photos of metamorphosed carbonate rocks in hand specimen and in thin section. If you want to know what they look like, go there. |
15.6 Index Minerals in Metacarbonates
Studies by N.L Bowen and C.E. Tilley in the 1940s, updated and modified subsequently by others, have established that, depending on protolith composition, metamorphic minerals appear in predictable order as carbonate rocks are metamorphosed to higher grades. These minerals, like index minerals in pelitic rocks, are stable over different temperature ranges and allow us to compare metamorphic grades of different rocks based on mineralogy.
As discussed above, the minerals that form in metacarbonates depend on both protolith composition and fluid composition. For example if the protolith contains no SiO2, no silicates may form. Or (more commonly) if the protolith contains no Al2O3, no aluminous minerals may form. And if the fluid present in a rock is mostly H2O, hydrous minerals will dominate carbonate minerals. Despite the complications, petrologists have observed the same general trends in many places.
Table 15.2, a summary, lists the most common metamorphic minerals in metacarbonates. Those present in low-temperature rocks are at the top of the list and those present in high temperature rocks are at the bottom. The minerals closest to the top of the list form during both regional metamorphism and contact metamorphism. The minerals at the bottom of the list are found in very high-temperature contact aureoles (in the sanidinite facies) and occasionally in xenoliths. And, those in the center are most often products of contact metamorphism, often involving substantial metasomatism.
The minerals listed in Table 15.2 are mostly Ca-Mg silicates. But if a protolith contains K-feldspar, phlogopite will likely form during metamorphism. If a protolith contains clay, aluminous minerals may form. And if a protolith contains iron oxides, Fe-bearing minerals may form. Besides the minerals listed, calcite, dolomite, K-feldspar, and quartz may be present in rocks of any grade, depending on rock composition.
| Table 15.2 Metamorphic minerals in carbonate rocks | ||
| occurrences | mineral | formula |
| low-T metamorphism may be present in either regional or contact metamorphic rocks |
talc tremolite phlogopite forsterite diopside |
Mg3Si4O10(OH)2 Ca2Mg5Si8O22(OH)2 KMg3(AlSi3)O10(OH)2 Mg2SiO4 CaMgSi2O6 |
| moderate temperature metamorphism generally products of contact metamorphism |
wollastonite grossular (garnet) andradite (garnet) epidote vesuvianite periclase monticellite |
CaSiO3 Ca3Al2Si3O12 Ca3Fe2Si3O12 Ca2Al2(Fe,Al)Si3O12(OH) Ca10(Mg,Fe)2Al4Si9O34(OH)4 MgO CaMgSiO4 |
| high-temperature (sanidinite facies) metamorphism found in contact aureoles or in carbonate xenoliths entrained in mafic hosts |
akermanite tilleyite spurrite rankinite merwinite larnite |
Ca2MgSi2O7 Ca5Si2O7(CO3)2 Ca5(Si2O8)CO3 Ca3Si2O7 Ca3MgSi2O8 Ca2SiO4 |
BOX 15.2 A Cute JingleN.L. Bowen is credited with the following whimsical acronym for remembering the order in which some different minerals appear in carbonates with increasing metamorphic grade: T-Tremble For Dire Peril Walks. Monstrous Acrimony Spurning Mercy’s Laws. In this acronym, the first letters of every word (almost) are abbreviations for talc, tremolite, forsterite, diopside, periclase, wollastonite, monticellite, akermanite, spurrite, merwinite, and larnite. Some of the minerals listed above may develop during regional metamorphism, but all the high-temperature ones are only found in contact aureoles (Table 15.2). |
15.7 Open Systems and Closed Systems
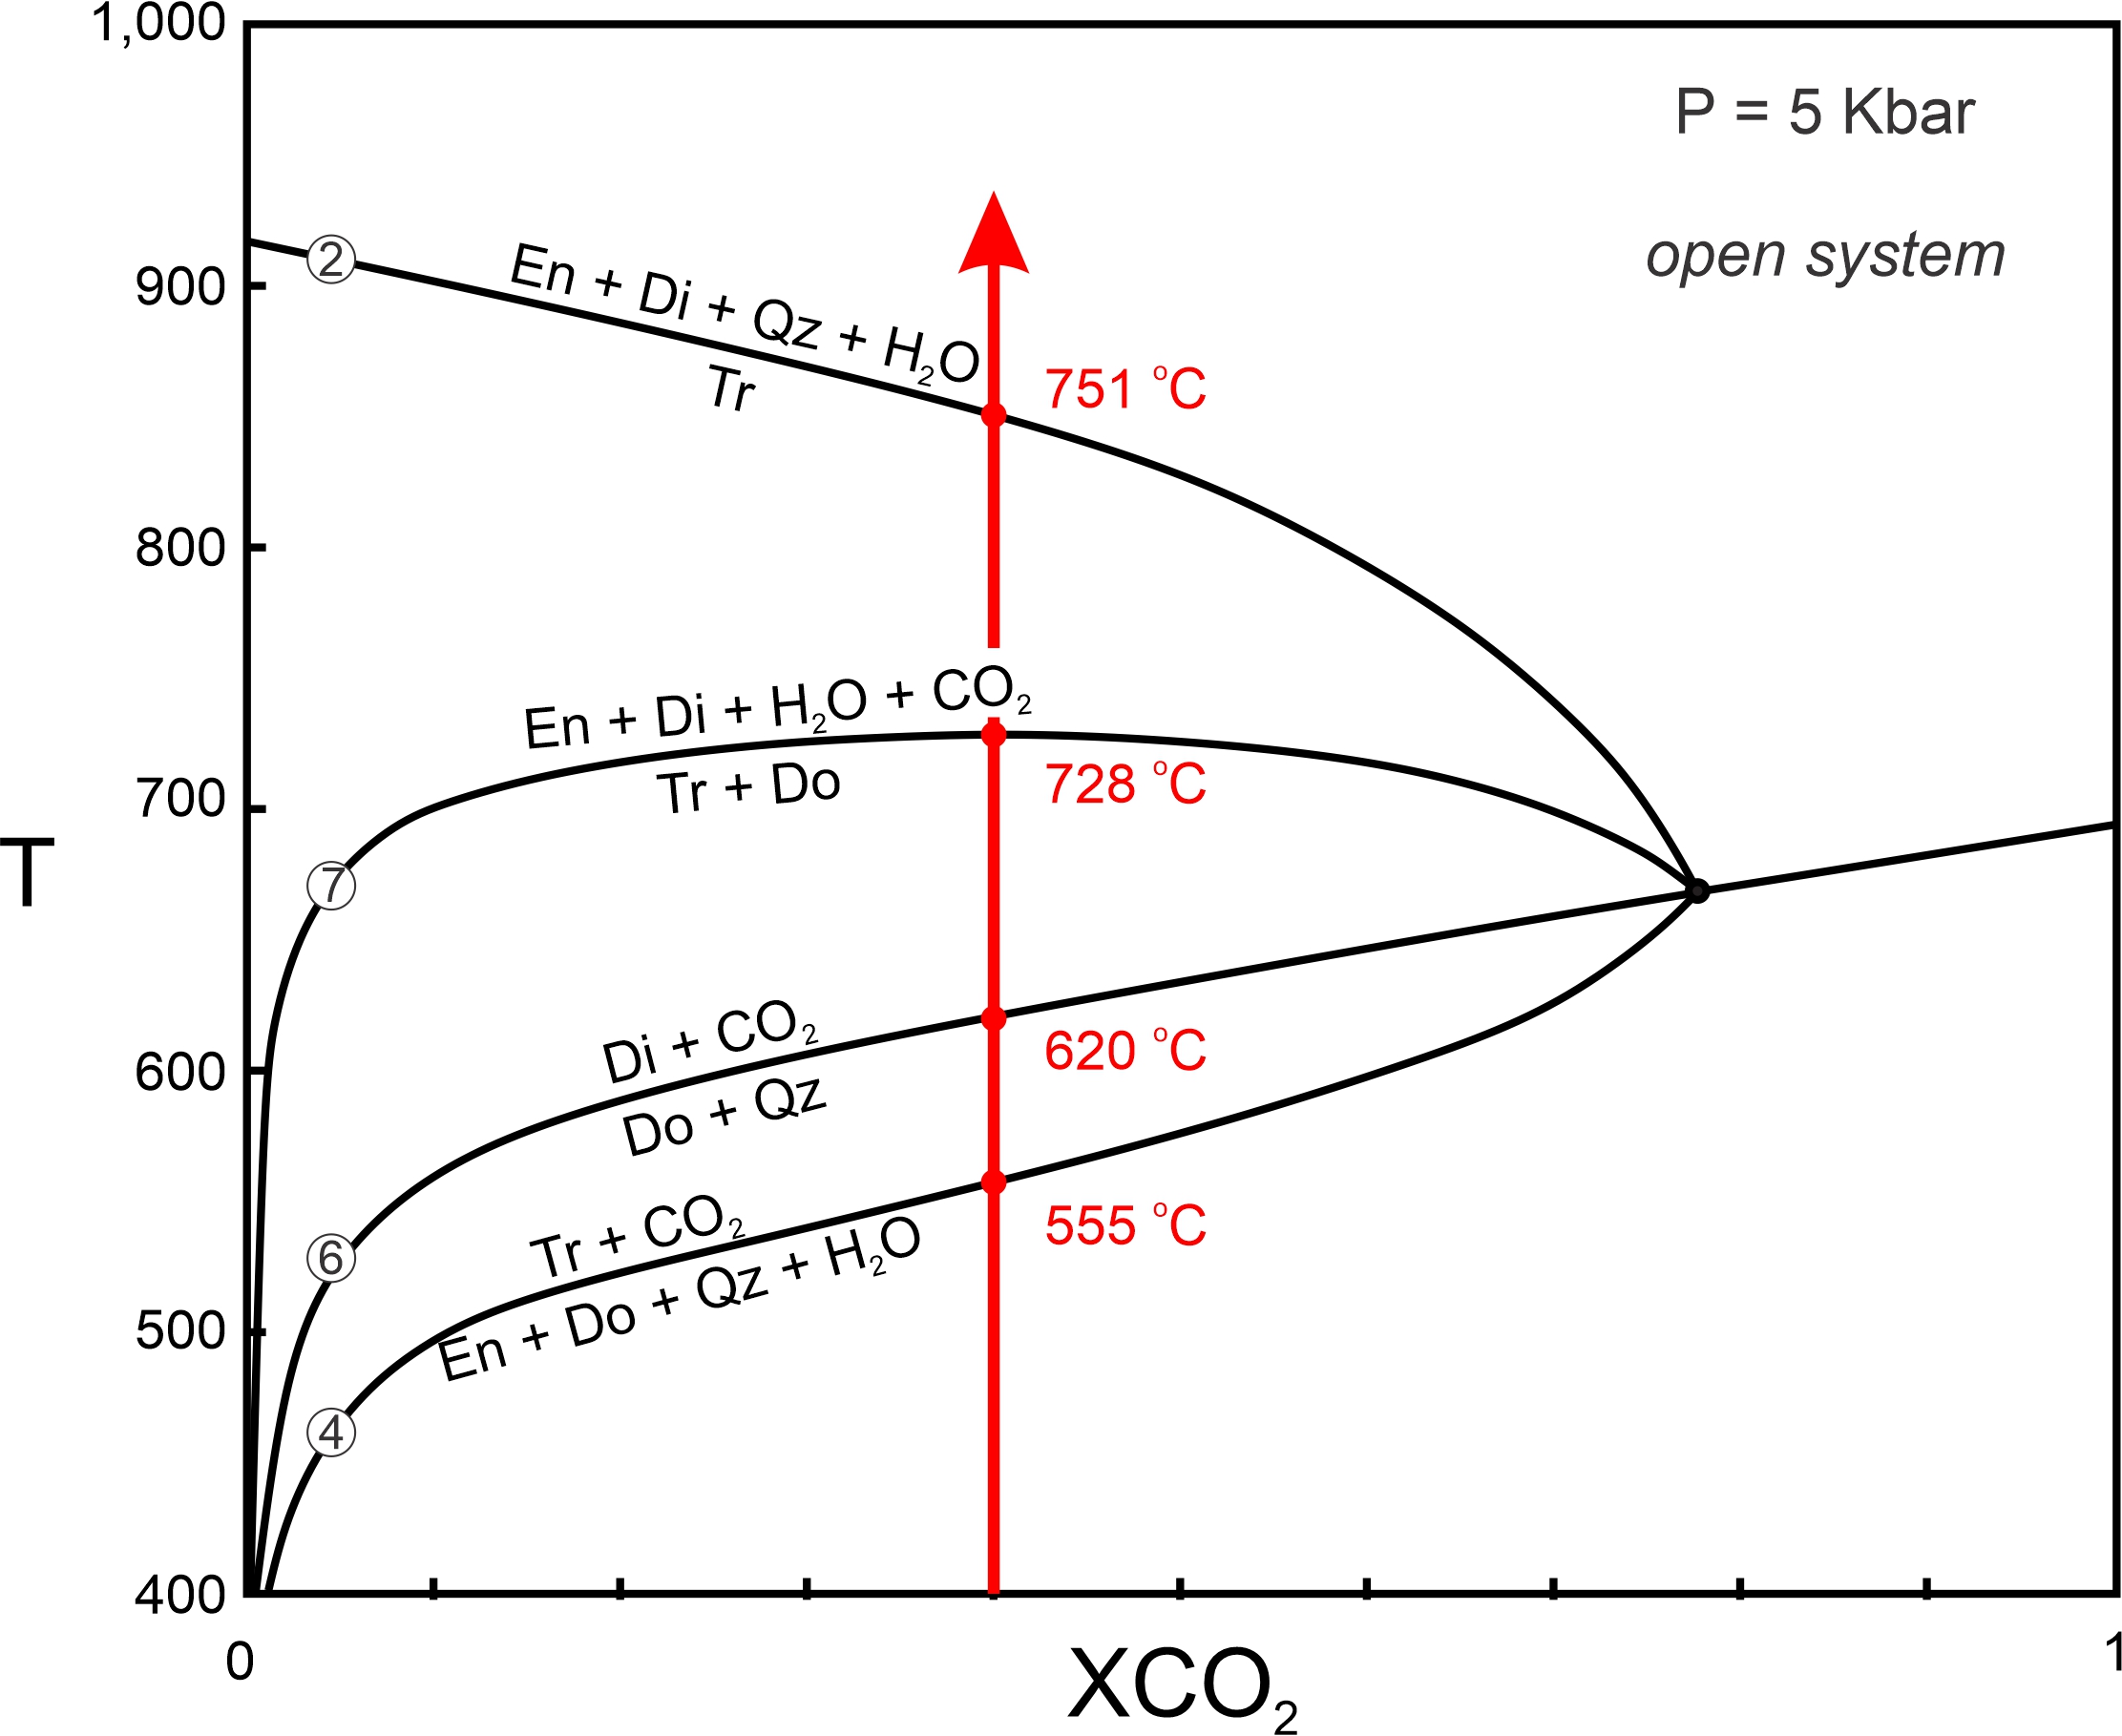
The simplest application of T-X diagrams is to use them to predict what minerals would form if fluid composition remained constant during metamorphism. In Figure 15.12, for example, if fluid remains constant at XCO2 = 0.4, reactions may occur at 555, 620, 728, and 751 oC (depending on protolith composition). Univariant assemblages will be stable at these temperatures as reaction occurs, and temperature will only increase when one of the reactants becomes exhausted.
Yet, as we have seen earlier in this chapter, most of the reactions that occur during metamorphism of carbonate-bearing rocks are decarbonation reactions that produce CO2, and some are dehydration reactions that produce H2O. Thus, the product fluids may change the composition of the fluid present in the rock. The only way fluid composition will remain constant is if the fluid to rock ratio is so high that any fluids produced by metamorphic reactions are inconsequential. Usually, this only happens if fluid composition is controlled from outside the rock – by fluids infiltrating the rock as metamorphism occurs. This scenario, open-system behavior, requires that rocks are porous and permeable. Some studies suggest that infiltrating fluids may change composition slightly during open-system metamorphism, but in all open systems, fluids produced by metamorphic reactions are of little consequence.
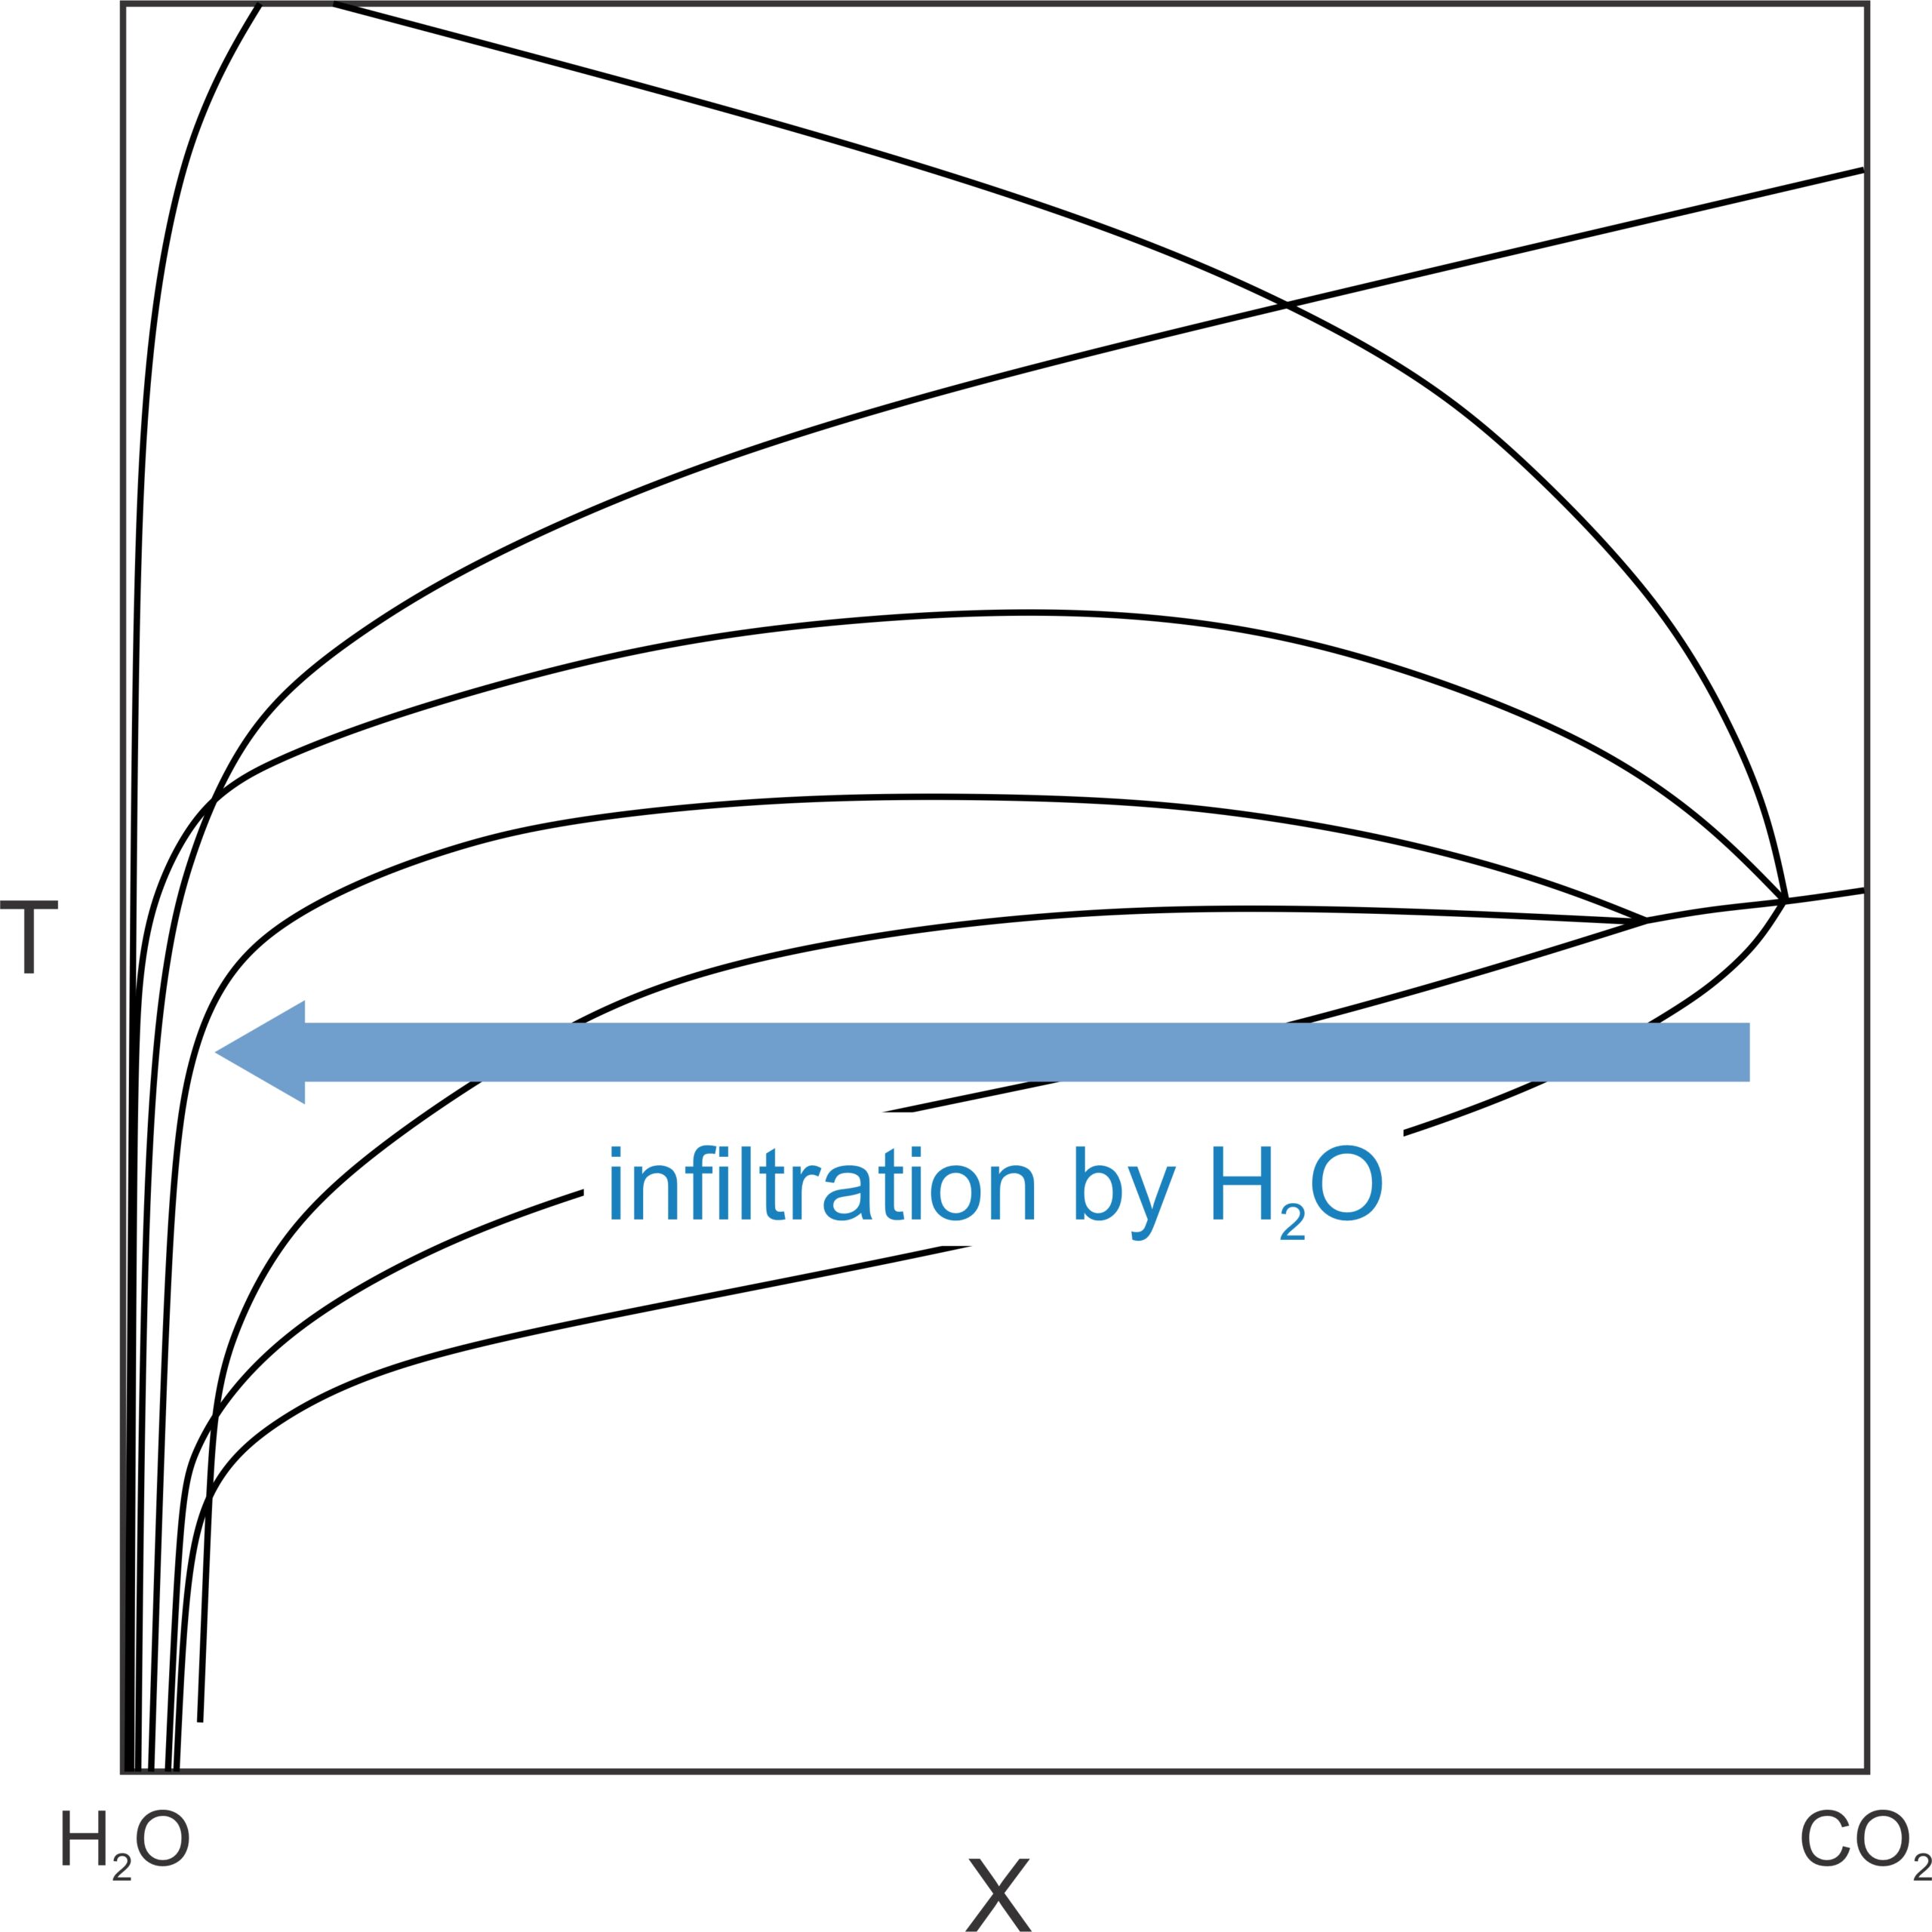
Besides controlling fluid composition, infiltrating fluids may also produce reactions without any temperature increase. If, for example, H2O-rich fluid flows into a rock, fluid composition will move toward pure H2O. If so, T-X conditions will cross one reaction after another as fluid approaches 100% H2O (blue arrow in Figure 15.13). Metamorphic reactions may occur in about the same order as they would in response to a temperature increase. This kind of metamorphism is metamorphism driven by fluid infiltration. It is very significant in some settings, especially when carbonate rocks and pelitic rocks are intermixed – dehydration of minerals in the pelites can release H2O that flows into the carbonates, causing reactions to occur.
In many, probably most, instances, metamorphic reactions do change fluid composition. This is especially true at elevated pressures where rock porosity and permeability are relatively low and rocks are less likely to be open systems. If the reactions completely control fluid composition – if the fluid composition is buffered internally — we have closed-system behavior. In some settings, metamorphism appears to have been completely open, and in others completely closed, but combinations of the two are well known and, perhaps, most common.
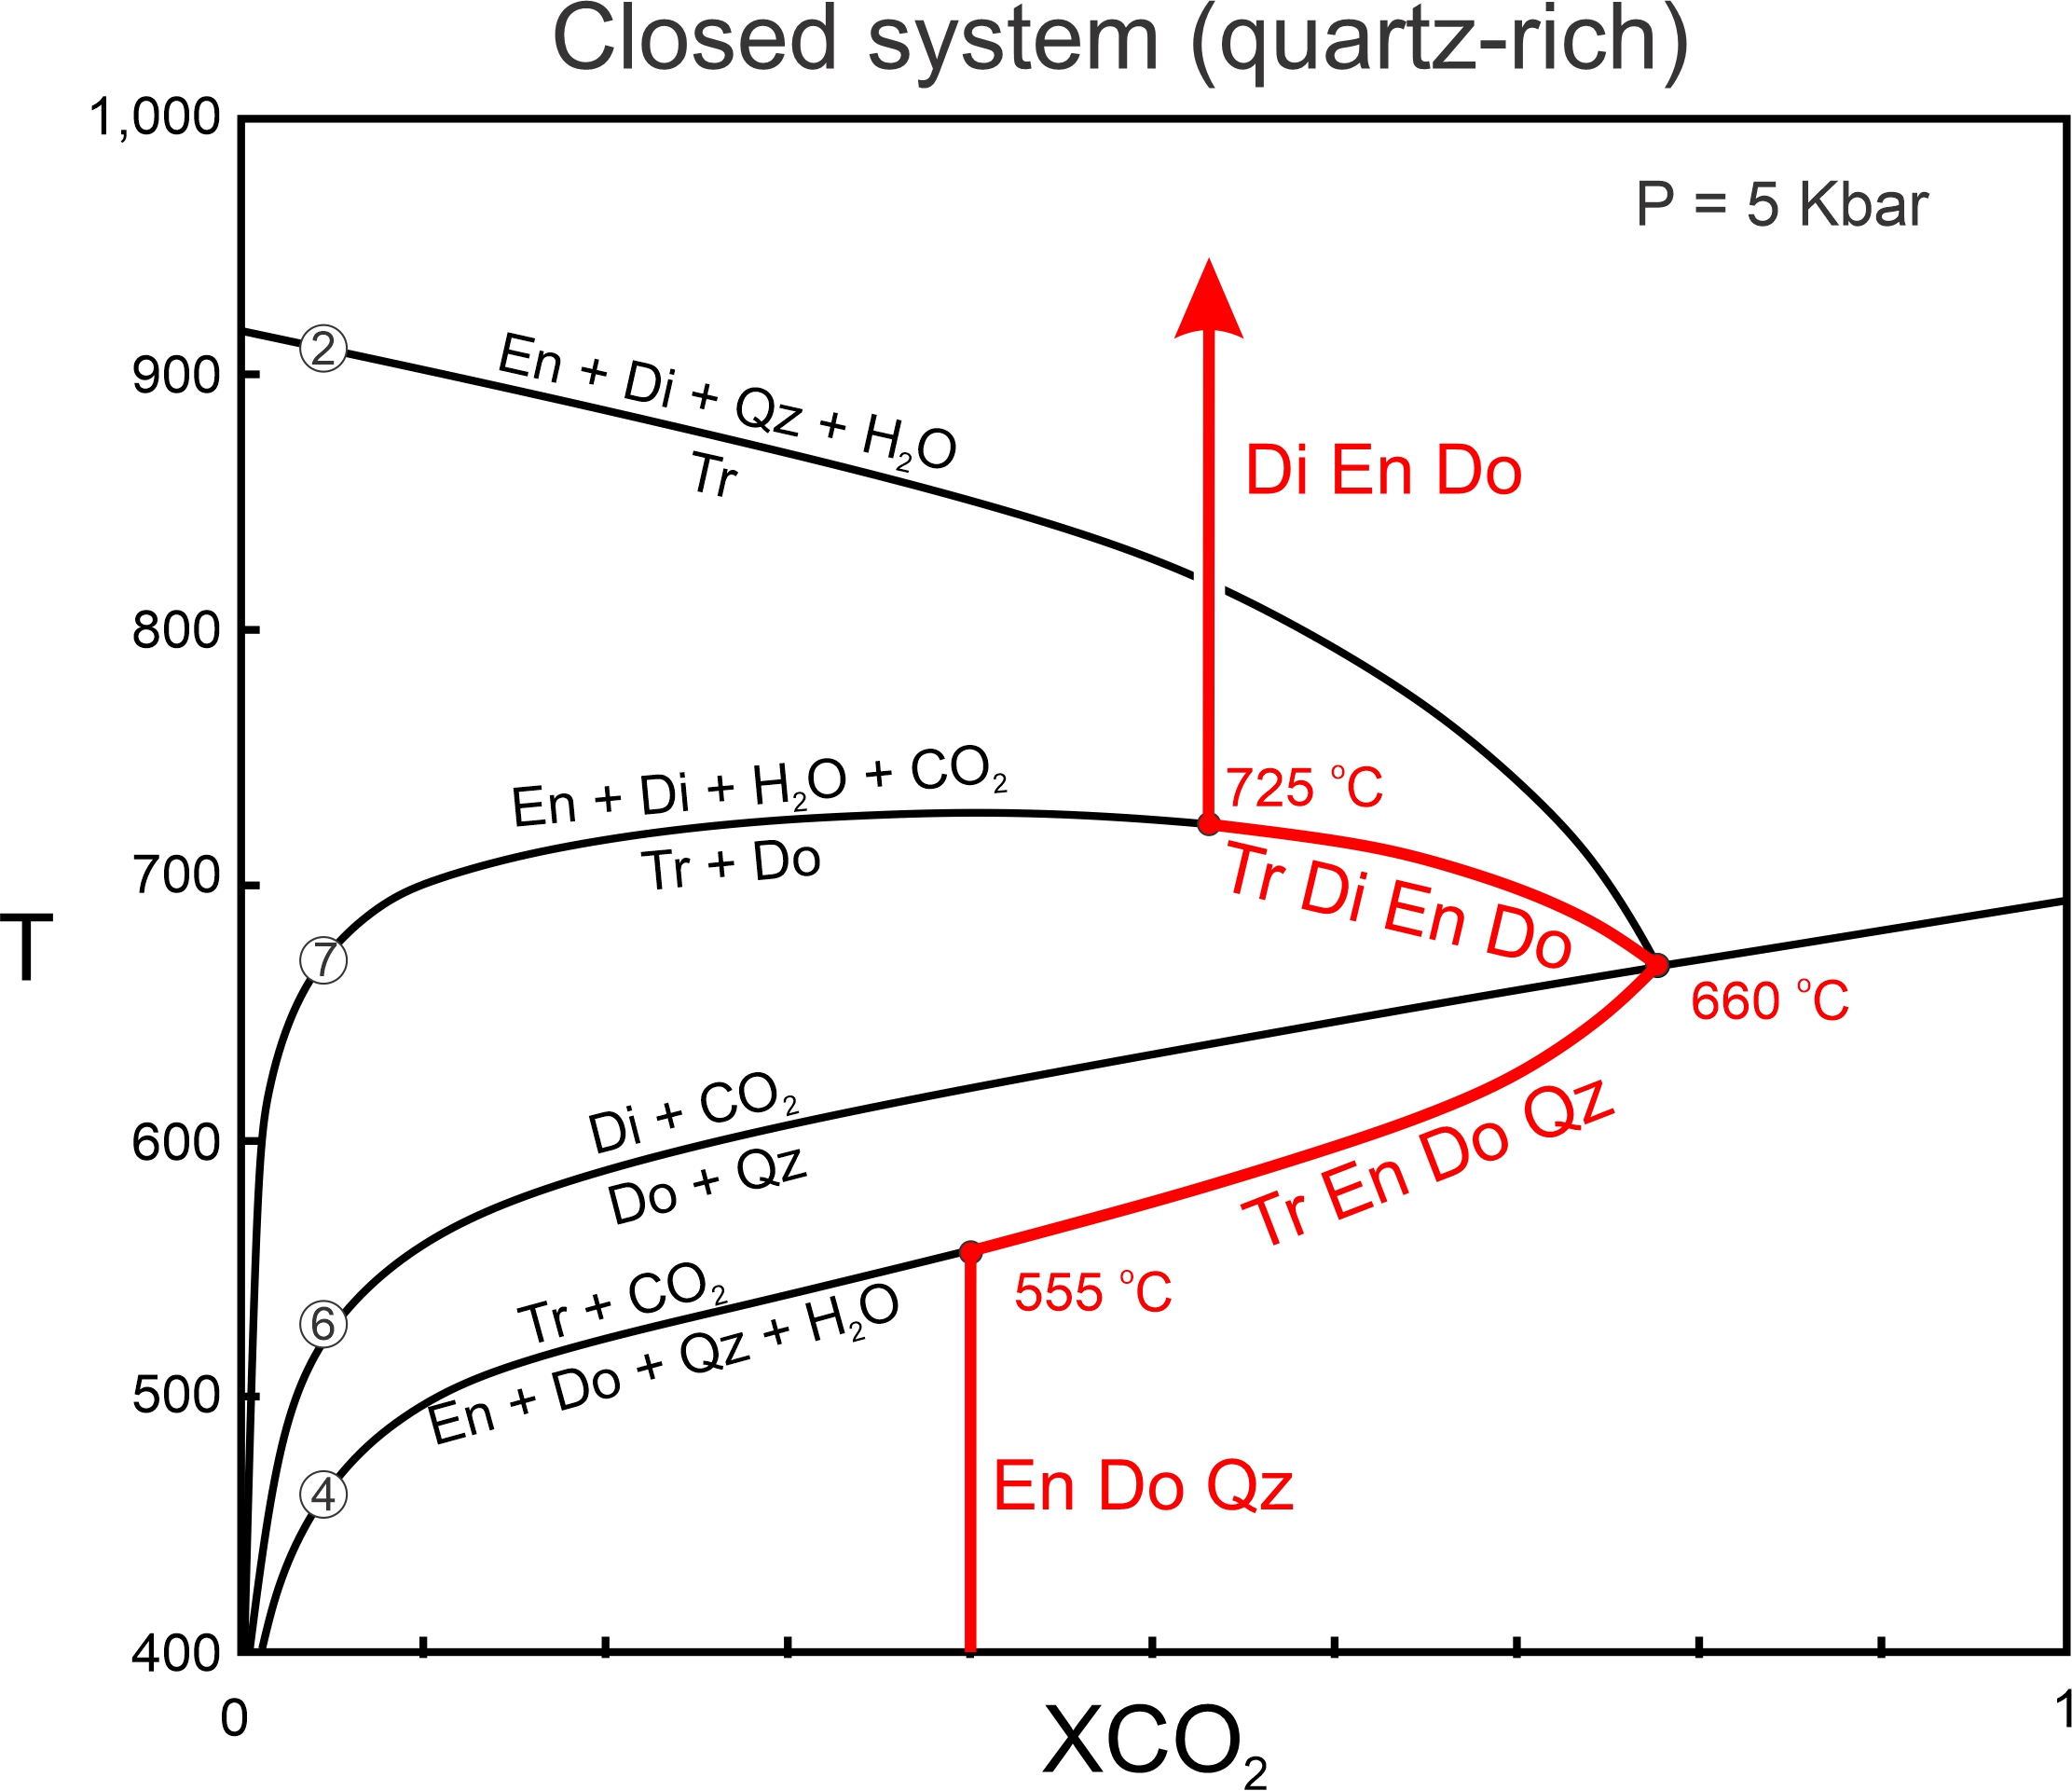
Figure 15.14, the same phase diagram as in Figure 15.9, shows how fluid composition might change during metamorphism in a closed system. A hypothetical protolith contains enstatite, dolomite, and quartz (composition Y in Figure 15.11). The red line and curves trace the path of fluid composition, and red mineral abbreviations show the minerals present as metamorphism progresses. In this figure, the metamorphic fluid starts with XCO2 = 0.4. (We could choose any starting XCO2 value and would get about the same results, but we use 0.4 to be consistent with the examples of open systems we looked at previously).
With heating, Reaction 4, producing tremolite, begins around 555 oC. As reaction progresses, tremolite, enstatite, dolomite, and quartz are present and the fluid becomes more CO2 rich (because formation of tremolite consumes H2O while producing CO2). So, as temperature increases, fluid composition follows the Reaction 4 curve to the invariant point at 660 oC. As reaction is occurring, four minerals (tremolite, enstatite, dolomite and quartz) are stable together – one more than are stable in fields between reaction curves.
At temperatures above the invariant point, dolomite and quartz are no longer stable together and react to form diopside (Reaction 6). Additionally, with further heating, tremolite reacts with dolomite to produce enstatite and diopside (Reaction 7). Tremolite, diopside, enstatite, and dolomite coexist between 660 and 725 oC as Reaction 7 occurs, and fluid composition follows the reaction curve to higher temperature and more H2O-rich compositions until all the tremolite is gone. Above Reaction 7 – above 725 oC – tremolite is gone and the stable mineral assemblage consists of diopside, enstatite, and dolomite.
One important result of closed-system metamorphism is that univariant assemblages exist over a range of temperature as reactions occur. For example, in Figure 15.14, tremolite, enstatite, dolomite and quartz (with H2O-CO2 fluid) coexist over a range of 105 oC. Tremolite, diopside, enstatite, and dolomite (with H2O-CO2 fluid) coexist over a range of 65 oC. This contrasts with open systems where univariant assemblages are only stable at one temperature.
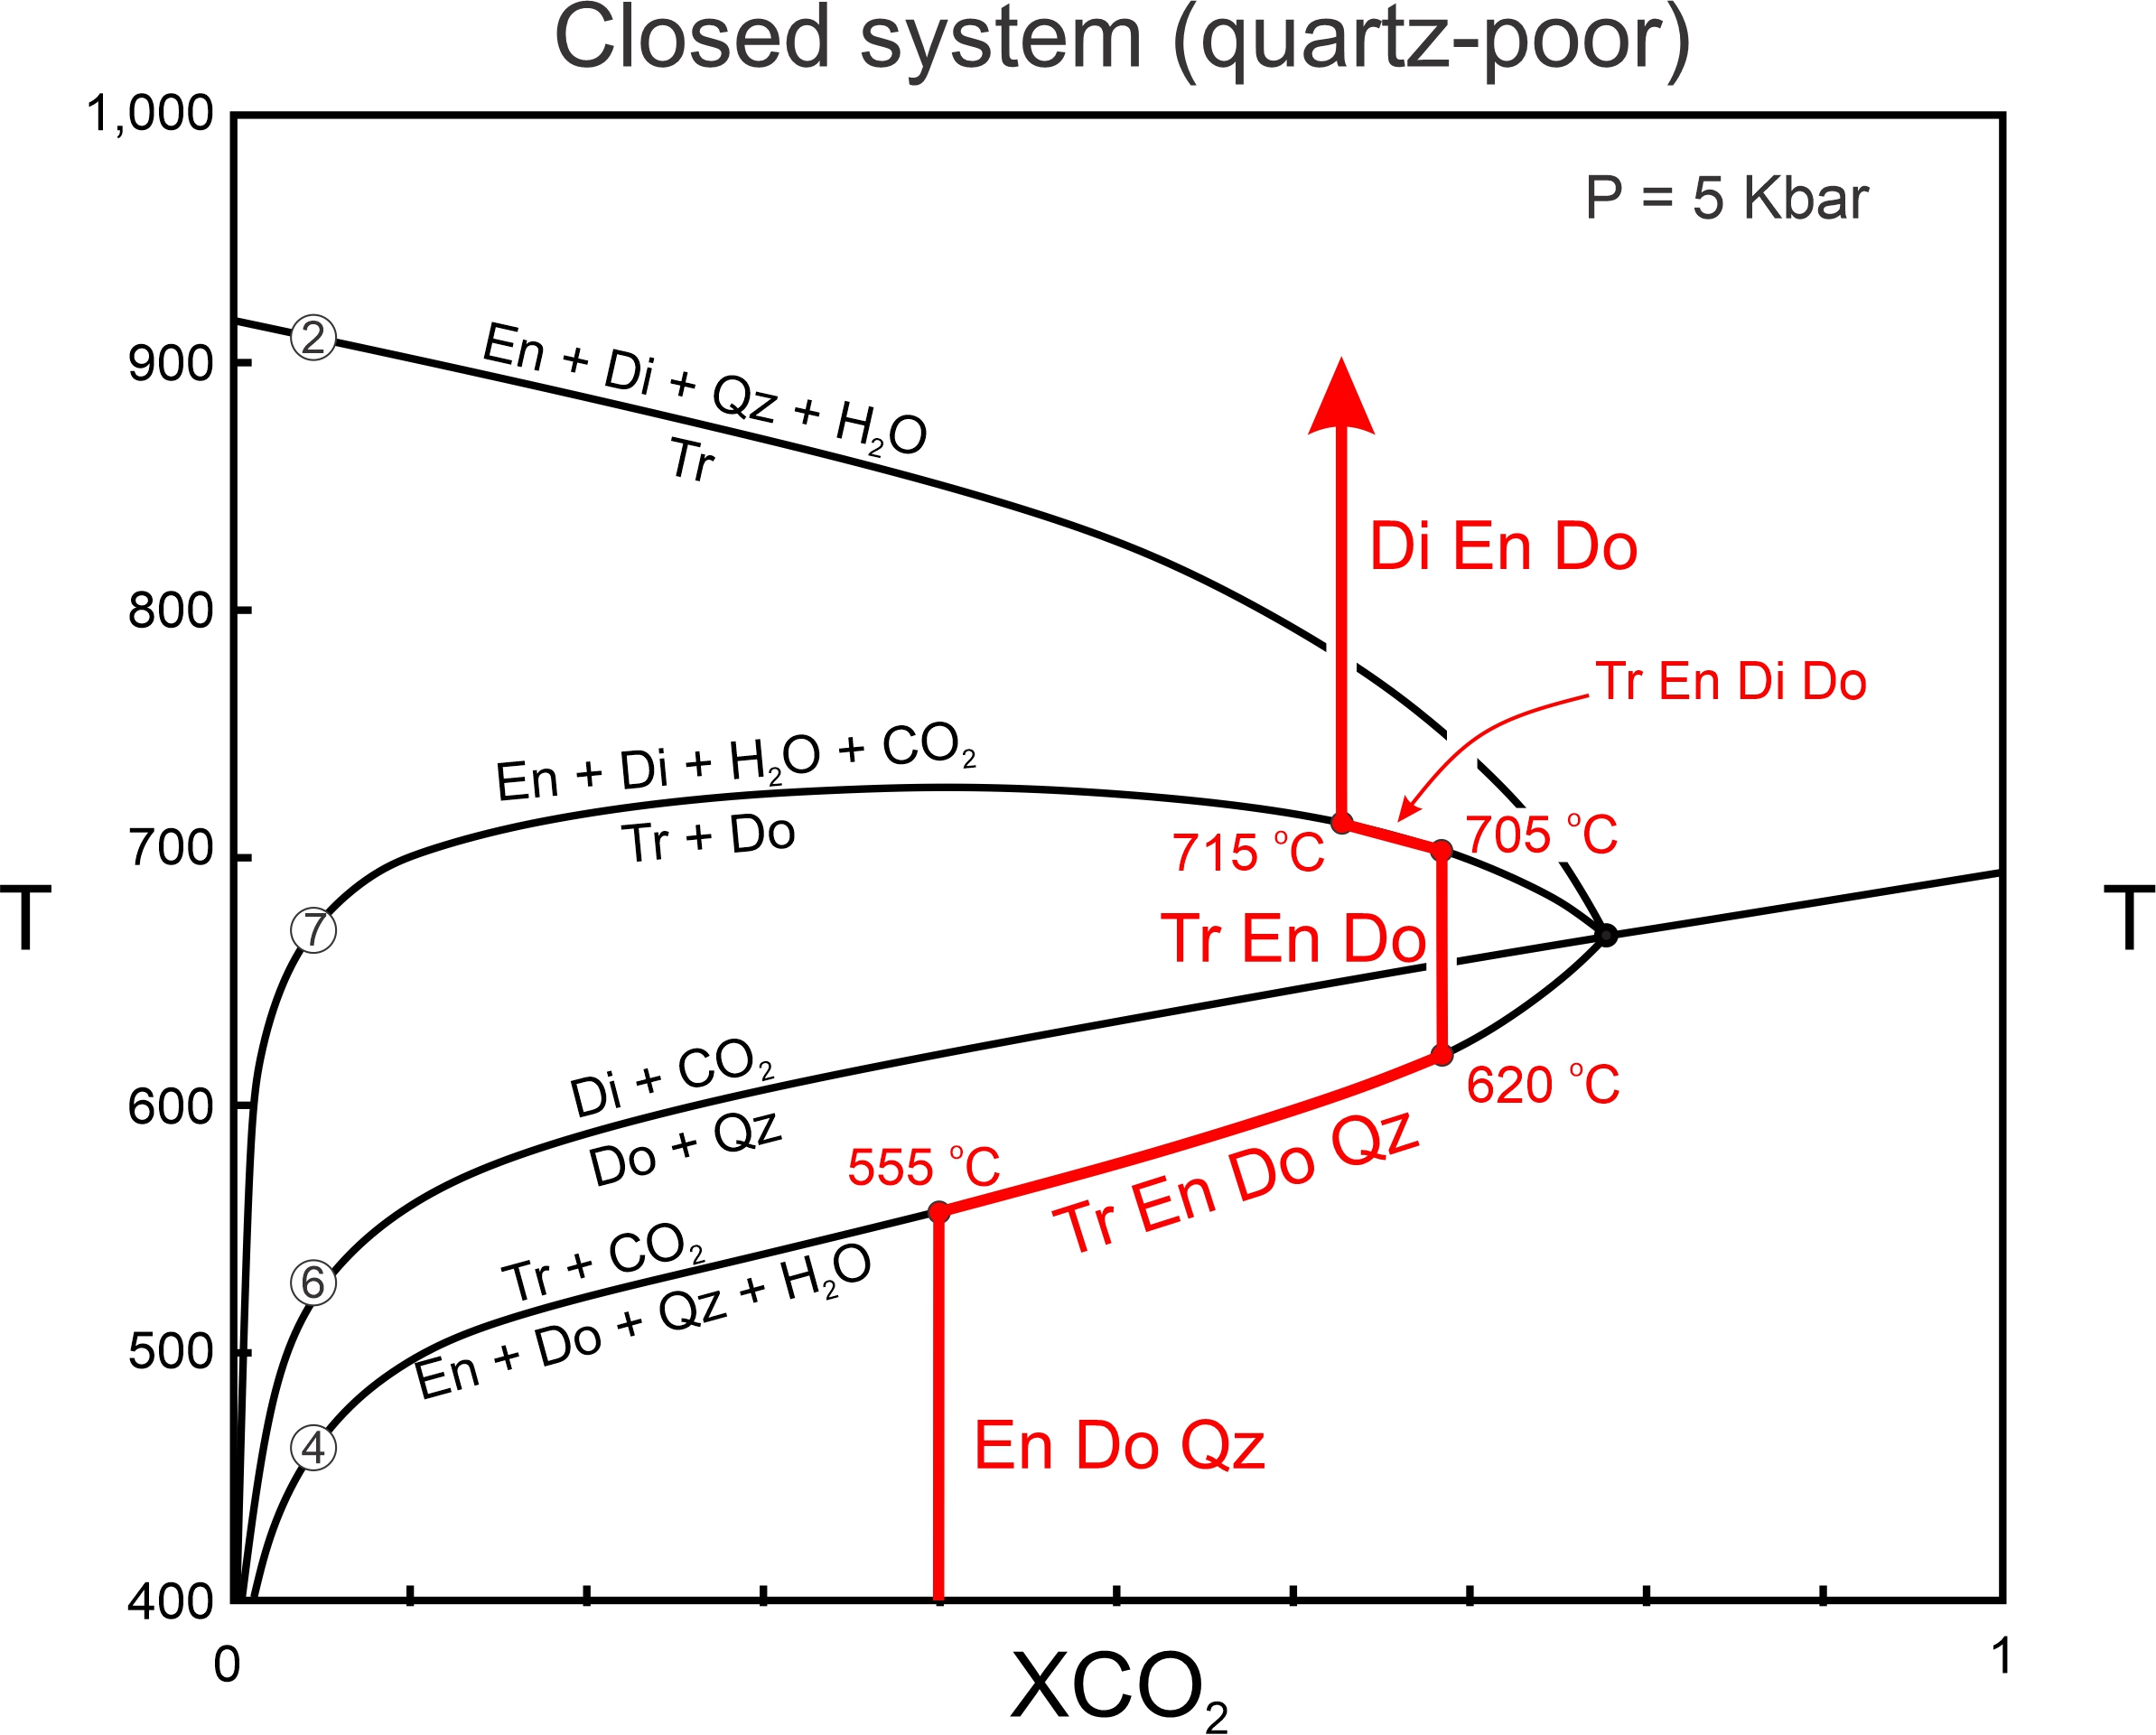
The fluid path in Figure 15.14 (in red) requires that sufficient enstatite, dolomite, and quartz are present so that Reaction 4 may progress to the invariant point. Figure 15.15 traces the fluid path for a rock that contains only a small amount of quartz. Reaction begins at 555 oC, as in the previous example, but quartz is exhausted before reaching the invariant point. At 620 oC, the last of the quartz disappears and only tremolite, enstatite, and dolomite will be present. Heating will continue from 620 to 705 oC with no change in fluid composition, so the fluid composition does not reach the invariant point. At 705 oC, the fluid path reaches Reaction 7, and tremolite and dolomite will begin to react to enstatite and diopside. Tremolite, diopside, enstatite, and dolomite will coexist between 705 and 715 oC, as the fluid become more H2O rich. At 715 oC, the last of the tremolite will disappear and the final stable assemblage will contain diopside, enstatite, and dolomite.
15.8 Metamorphism at Different Scales
15.8.1 Regional Metamorphism
|
|
|

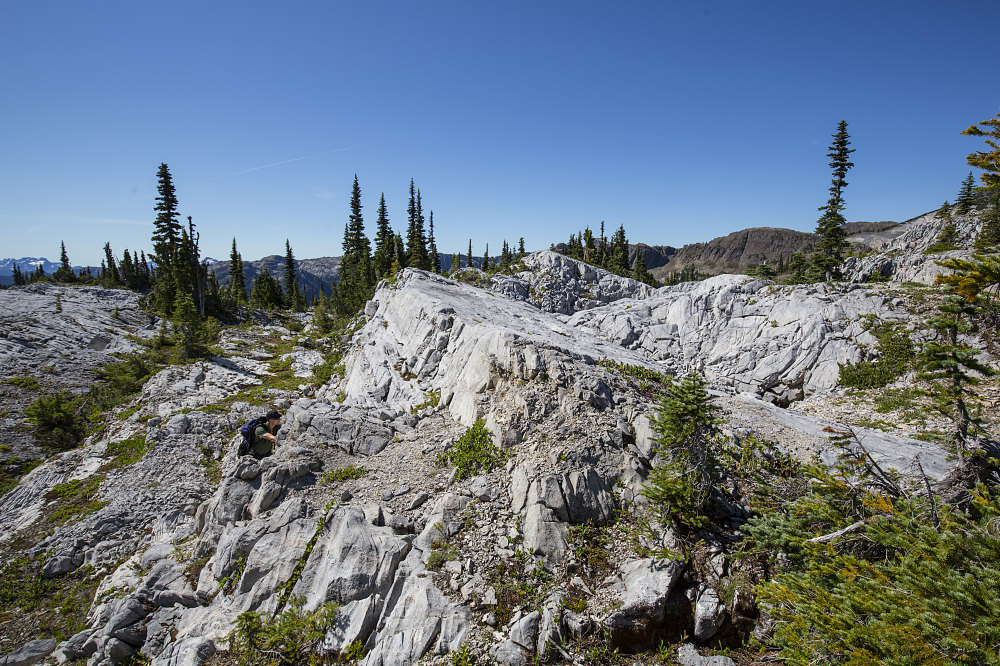
Any dolomite- or calcite-bearing limestone may be metamorphosed during regional metamorphism. The typical result is a massive light-colored marble that may later become exposed in beautiful outcrops. Figures 15.16 and 15.17 show two examples – a marble outcrop on Vancouver Island, Canada, and another on Thassos Island, Greece.
Although countless studies have documented regional metamorphic isograds based on pelitic rocks, regional isograds are often elusive in metacarbonates. This reflects, in large part, the complications introduced by variations in fluid compositions that do not apply to metapelites. Additional complications arise because variations in protolith compositions seem to have more pronounced effect for carbonates than for pelites.
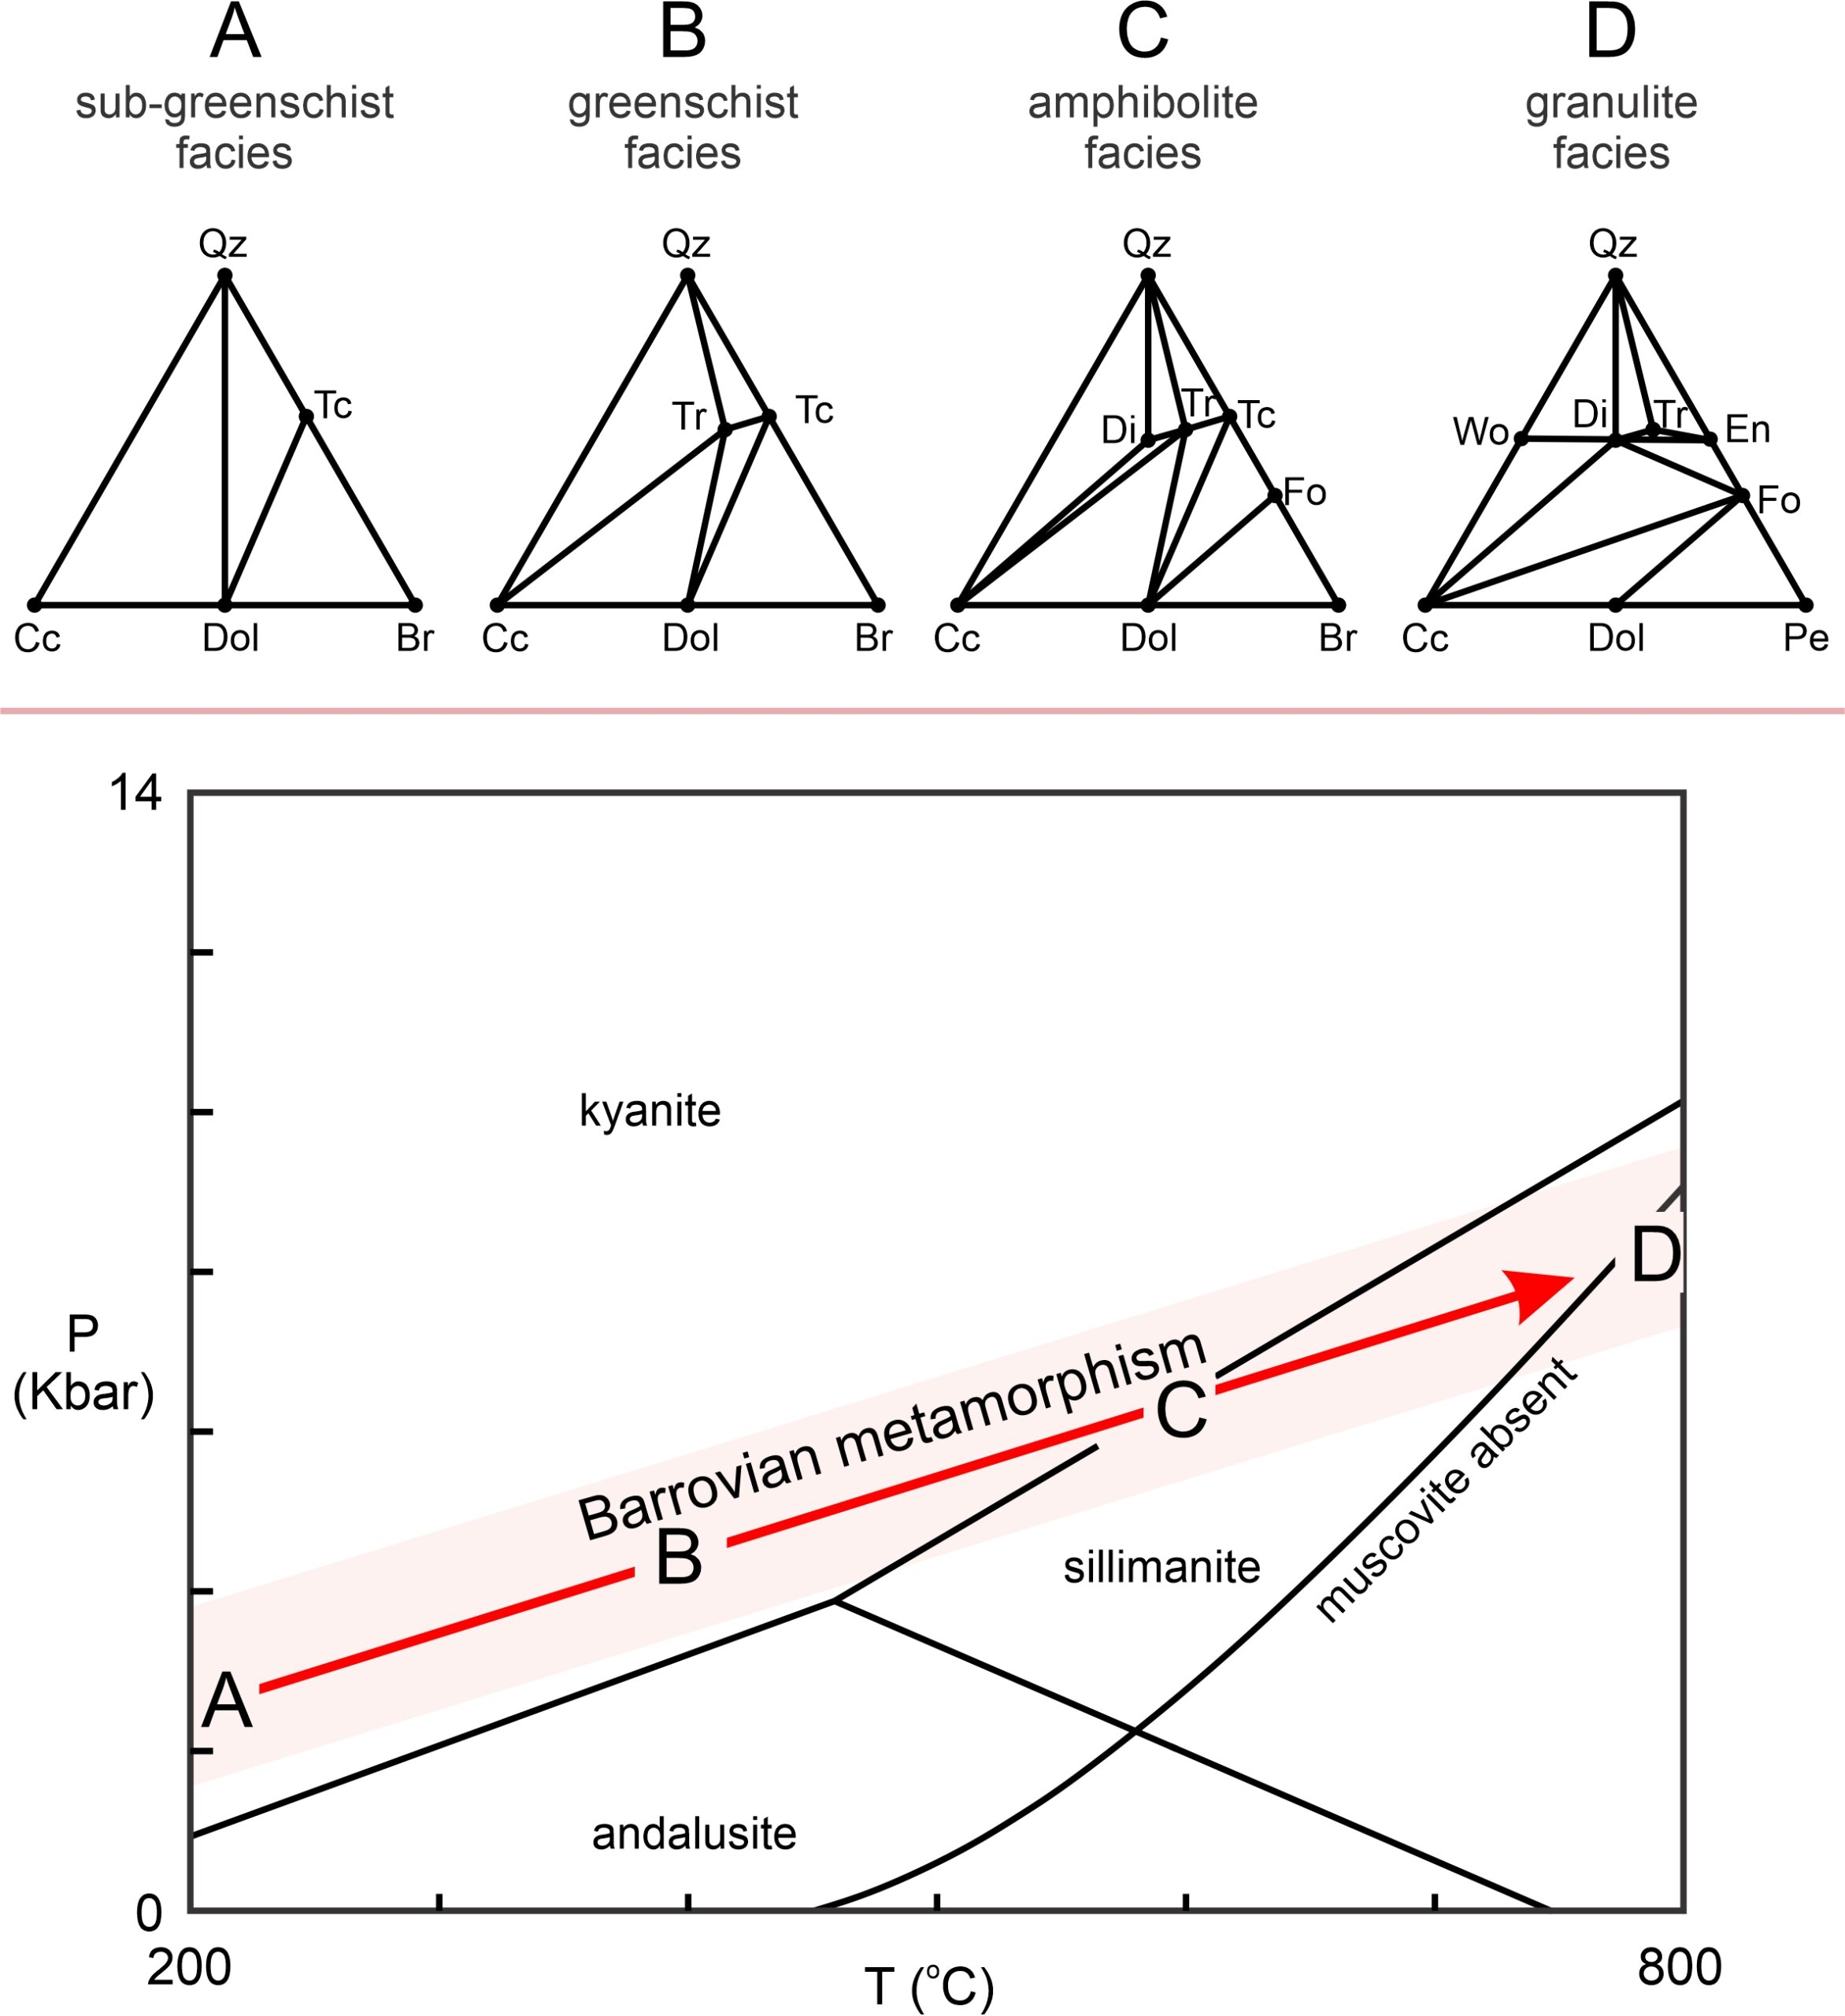
Figure 15.18 shows typical metacarbonate composition diagrams for different degrees of Barrovian metamorphism, from sub-greenschist facies (Triangle A) to granulite facies conditions (Triangle D). Many intermediate chemographies have been omitted, but some key trends are evident. Lower-grade rocks, depending on composition, may contain talc. With increasing grade tremolite, diopside, and perhaps forsterite or wollastonite may develop. It is clear from the chemographic diagrams, however, that rock composition greatly affects the minerals that are present. Different composition rocks may plot in different 3-phase triangles, meaning that a different assemblage will be stable.
In a remarkable study, Carmichael (1970) mapped isograds in both pelitic and carbonate rocks at Whetstone Lake, Ontario. He found that the most significant isograd in the carbonates cut across, and was nearly perpendicular to isograds in the pelites. He demonstrated that the isograds in the carbonates were due primarily to variations in fluid composition. Water released by metamorphism of the pelites infiltrated the carbonates causing mineral changes that did not reflect pressure and temperature changes. This kind of effect is likely significant in many terranes but few investigators have documented it the way that Carmichael did.
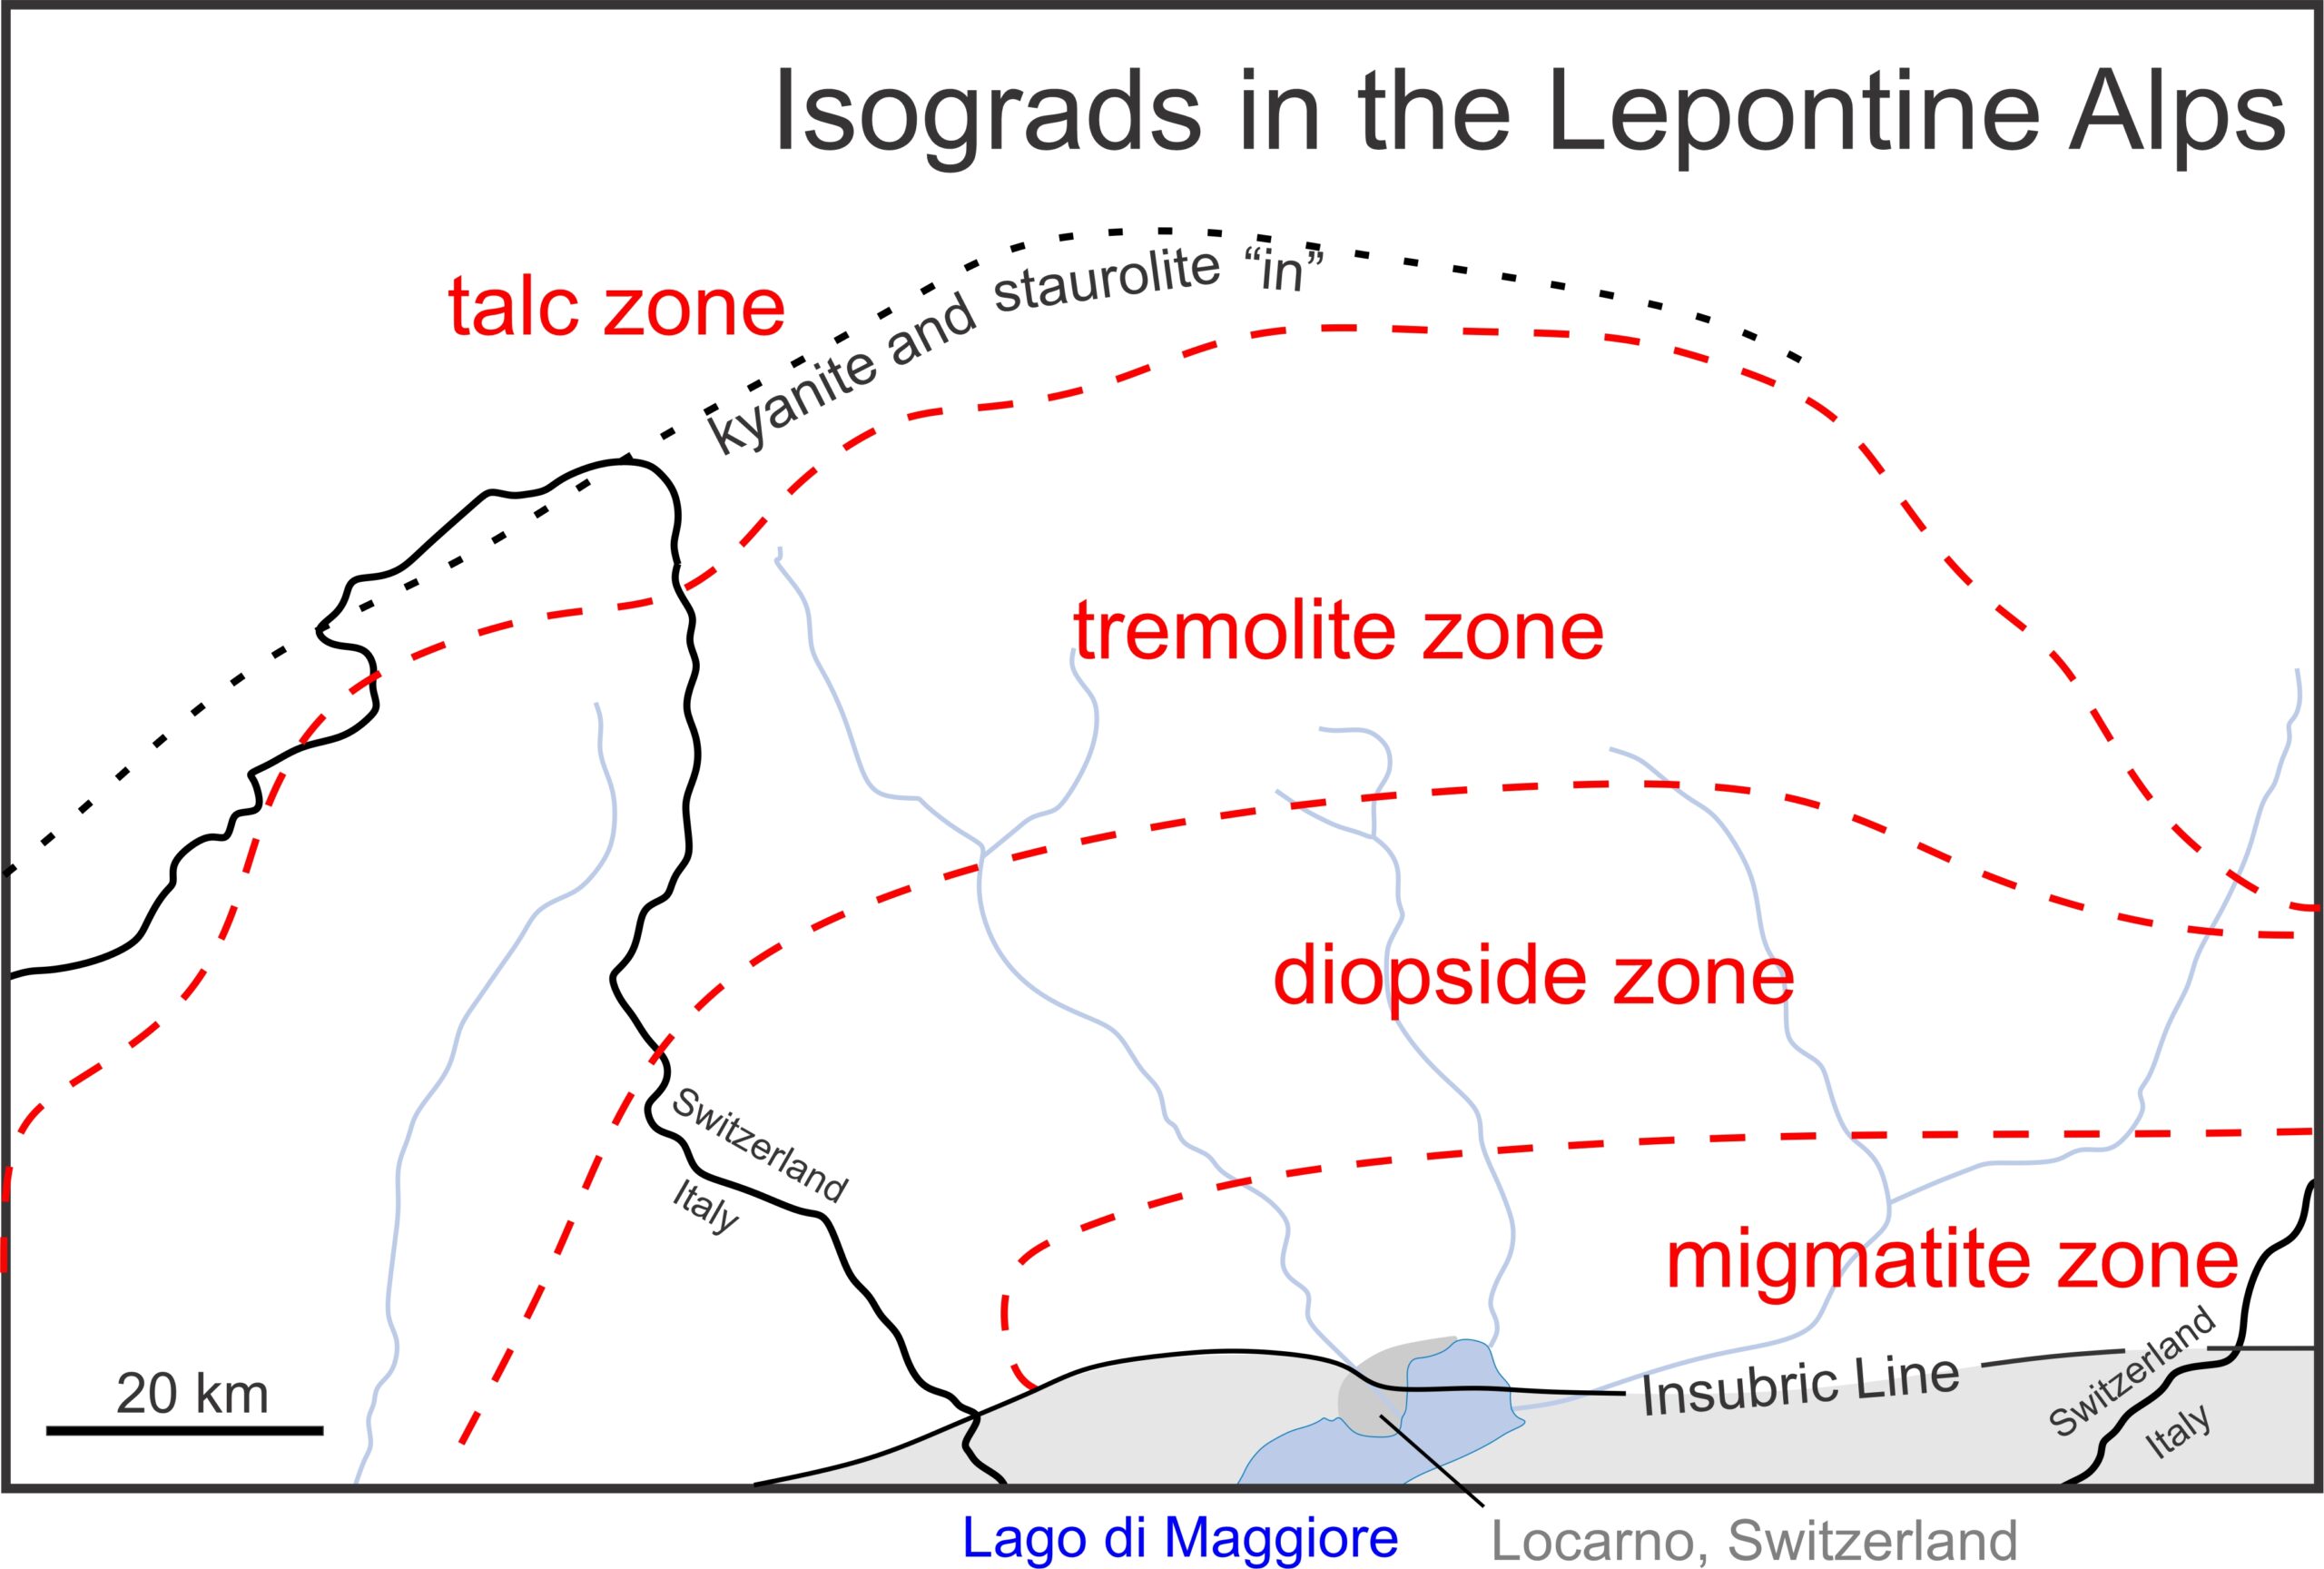
Petrologists have, however, successfully mapped metacarbonate isograds in some places. For example, Figure 15.19 is a map of isograds in the Alps along the border (black line) between Switzerland and Italy. Moving from northwest to southeast, an isograd (dashed red line) separates a low-grade talc zone, from a higher grade tremolite zone. Another isograd separates the tremolite zone from a higher-grade diopside zone. Moving further southeast, migmatites are common, suggesting that anatexis (partial melting) may have occurred. The zones are each several 10’s of kilometers across. A kyanite/staurolite “in” isograd in metapelites (black dotted line) roughly parallels the isograd between the talc and tremolite zones. A major tectonic boundary (the Insubric Line) cuts across the southern part of the map region – the region in gray on the map was originally another lithospheric plate, or perhaps another continent.
15.8.2 Contact Metamorphism
The best examples of contact metamorphism involve rocks metamorphosed at low pressure and shallow depths in Earth. Mostly, this is because, at shallow depths rocks are relatively cool and there is a great difference between country rock temperature and intrusion temperature. So, the effects of contact metamorphism may be profound. It is certain that heat from magmas contributes to regional metamorphism and that contact metamorphism occurs in high pressure rocks – rocks at greater depths – but we may not be able to distinguish it from the regional metamorphism that is also occurring. Figure 9.18 in Chapter 9 shows an example of marble in a contact aureole in the Elkhorn Mountains, Montana.
15.8.2.1 The Alta Contact Aureole, Utah
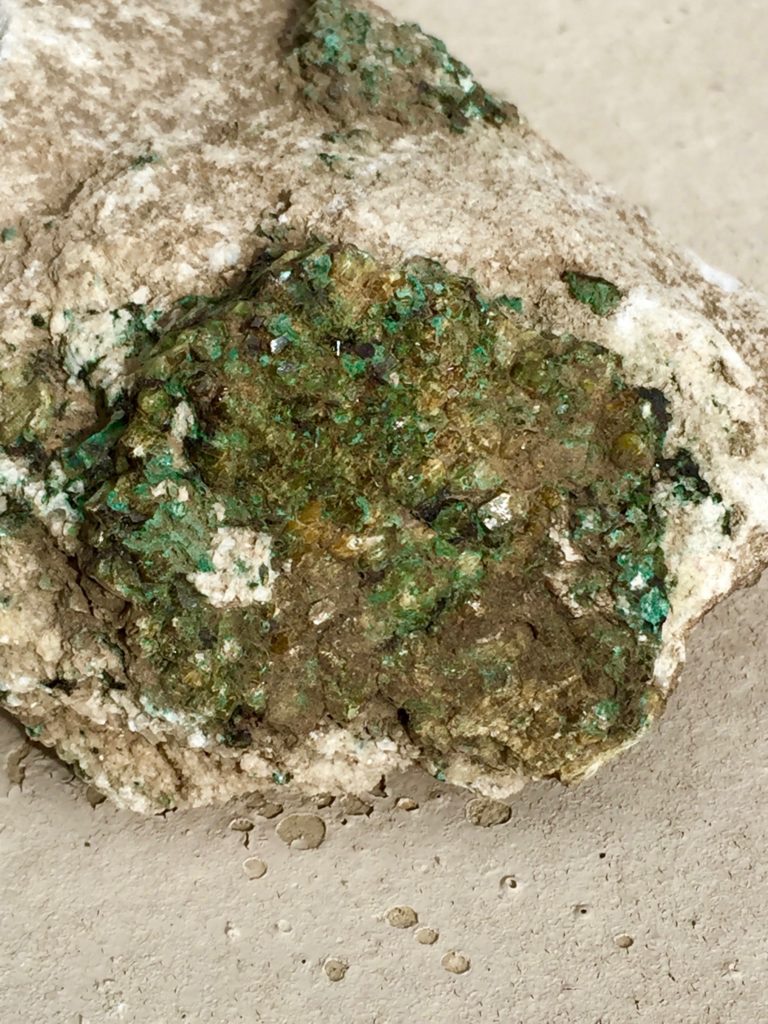
Low-pressure contact metamorphism of carbonate-bearing rocks, in particular, creates textures and minerals that are quite noticeable. Distinctive contact aureoles develop; they may be on the scale of centimeters to kilometers. Aureoles that extend over kilometers are particularly suited for study because mineral zones are often quite distinctive and isograds quite easily mapped. One of the best and most studied examples is the aureole around the Tertiary Alta Stock 40 km southeast of Salt Lake City in Utah’s Wasatch Mountains. Several studies have concluded that the stock was emplaced at temperatures of 700 – 750 oC at pressures of 1-2 Kbar. Figure 15.20 shows a marble containing green diopside in the Alta aureole.
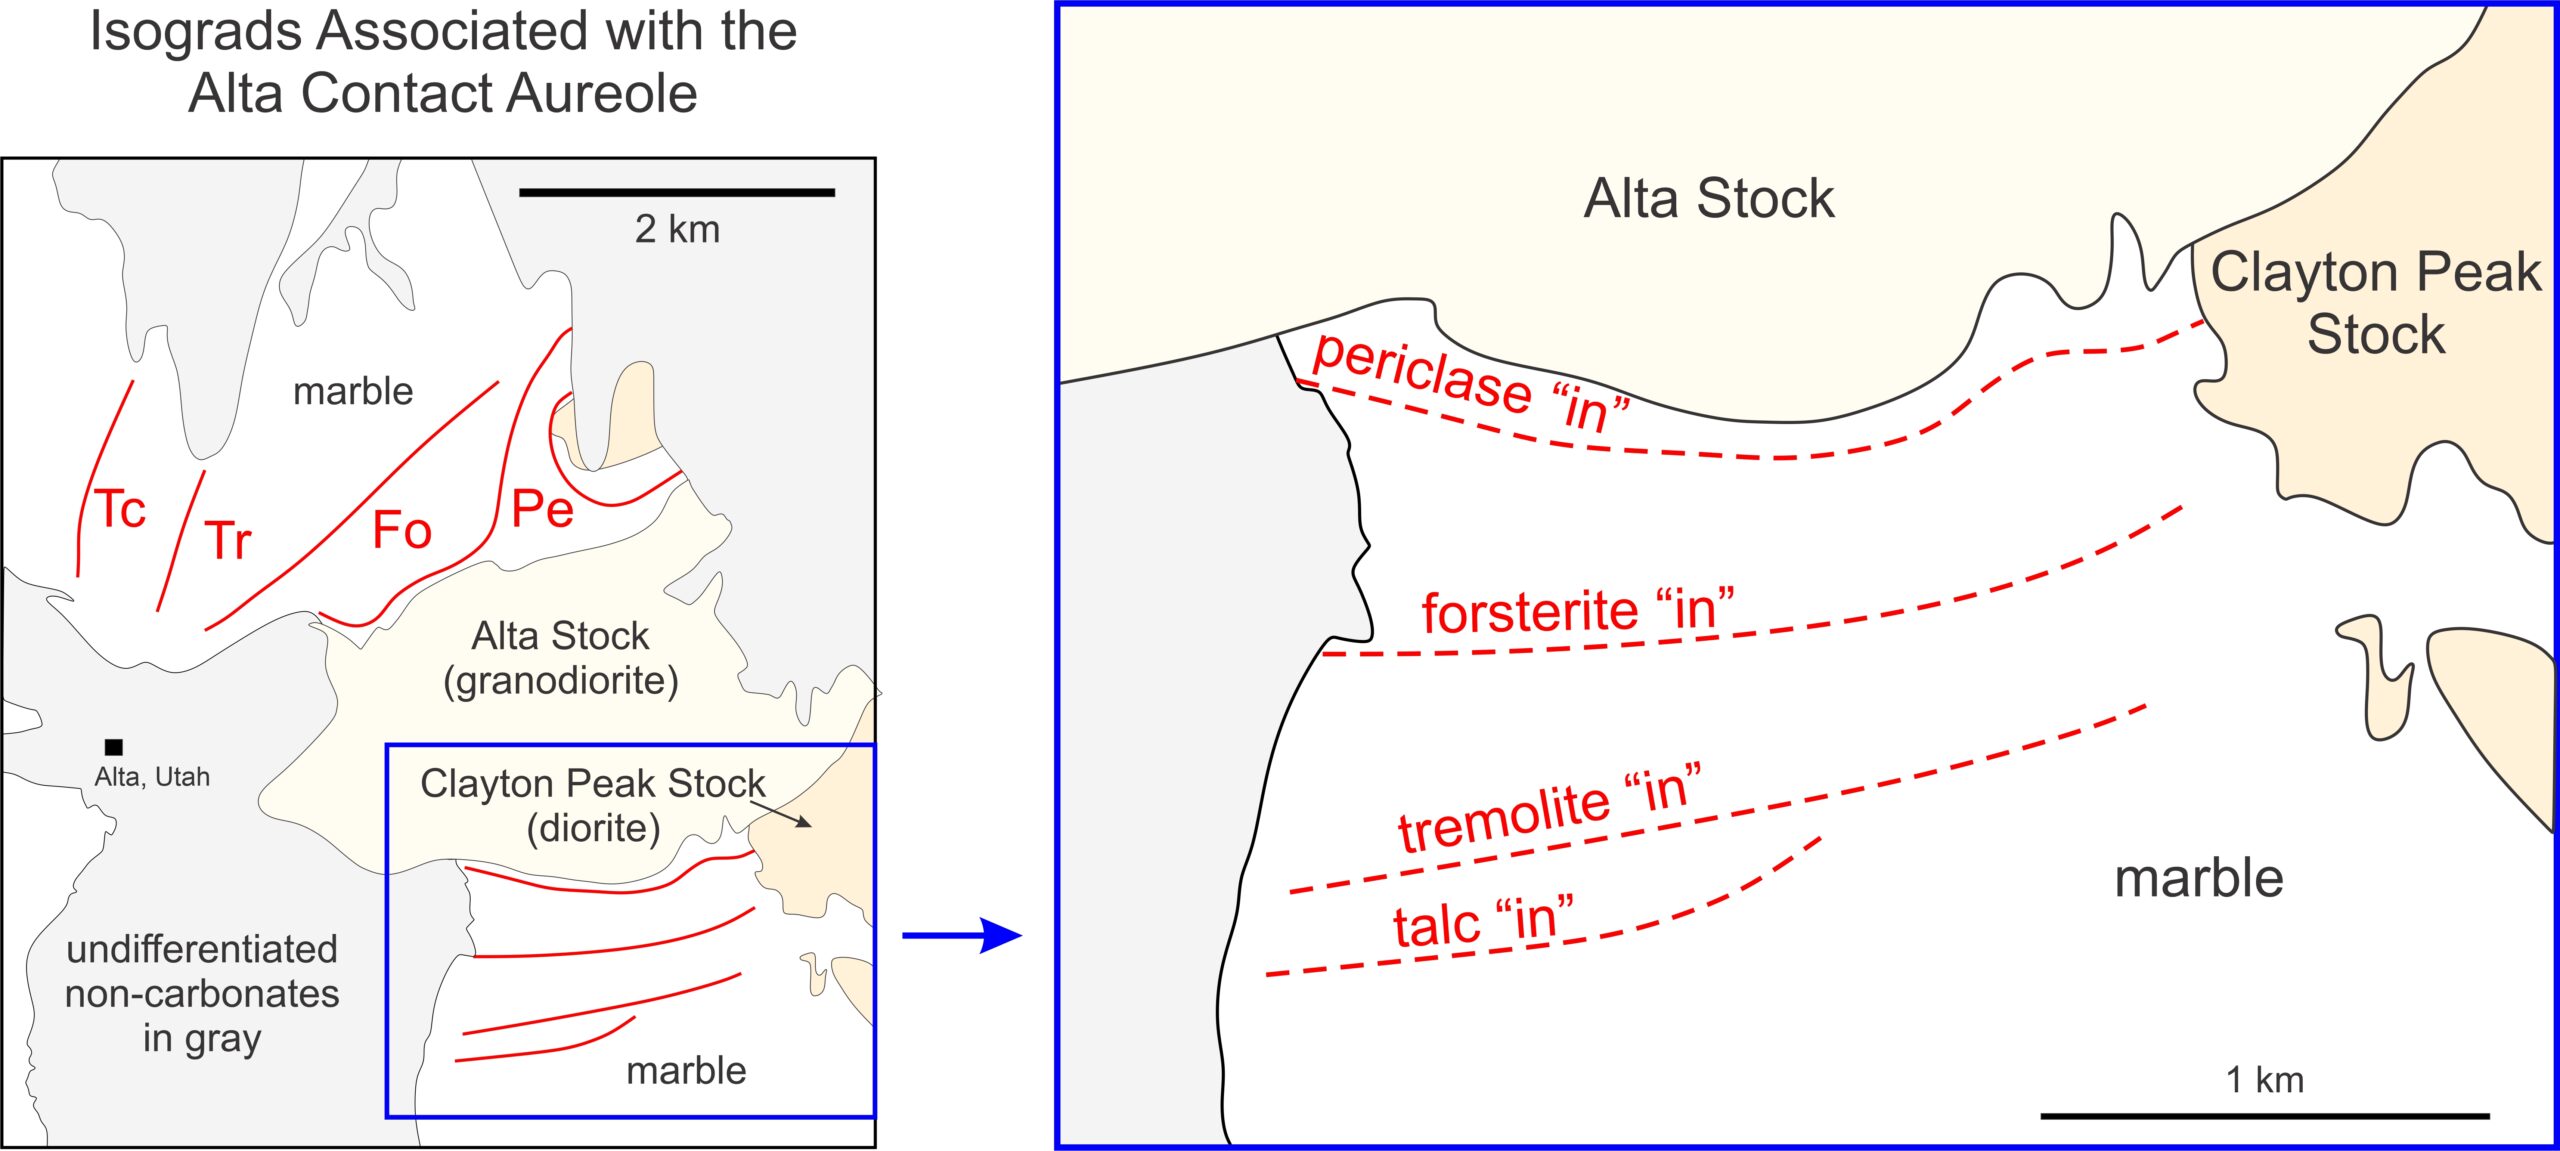
The Alta granodiorite magma intruded mostly Mississippian siliceous dolomites. As seen in Figure 15.21, mineral zones and isograds south of intrusion are roughly parallel to the granodiorite-dolomite contact. North of the granodiorite outcrops, zones are larger and more irregularly shaped. This is attributed to the irregular geometry of the stock beneath the metacarbonate rocks. Temperatures of contact metamorphism were more than 700 oC near the intrusion but lower in distal zones.
Approaching the stock from either north or south, the isograds encountered in order reflect the talc, tremolite, forsterite, and periclase “in” reactions. According to Moore and Kerrick (1976), these reactions, which occurred at about 350 oC, 400 oC, 550 oC, and 650 oC are:
| [Rxn 11] | 3 dolomite + 4 quartz + H2O = talc +3 calcite + 3 CO2 |
| [Rxn 12] | 2 talc + 3 calcite = tremolite + dolomite + H2O + CO2 |
| [Rxn 13] | tremolite + 11 dolomite = 8 forsterite + 13 calcite + 9 CO2 + H2O |
| [Rxn 10] | dolomite = periclase + calcite |
15.8.2.2 The Marysville Contact Aureole, Montana
Because the isograds are sharp lines on a map, and because few, if any, rocks contain univariant assemblages, the fluid composition during metamorphism at Alta must have been mostly or entirely externally controlled. The system was an open system. This contrasts significantly with metamorphism that occurred in the late Precambrian Helena Dolomite during intrusion of the Cretaceous Marysville Granodiorite.
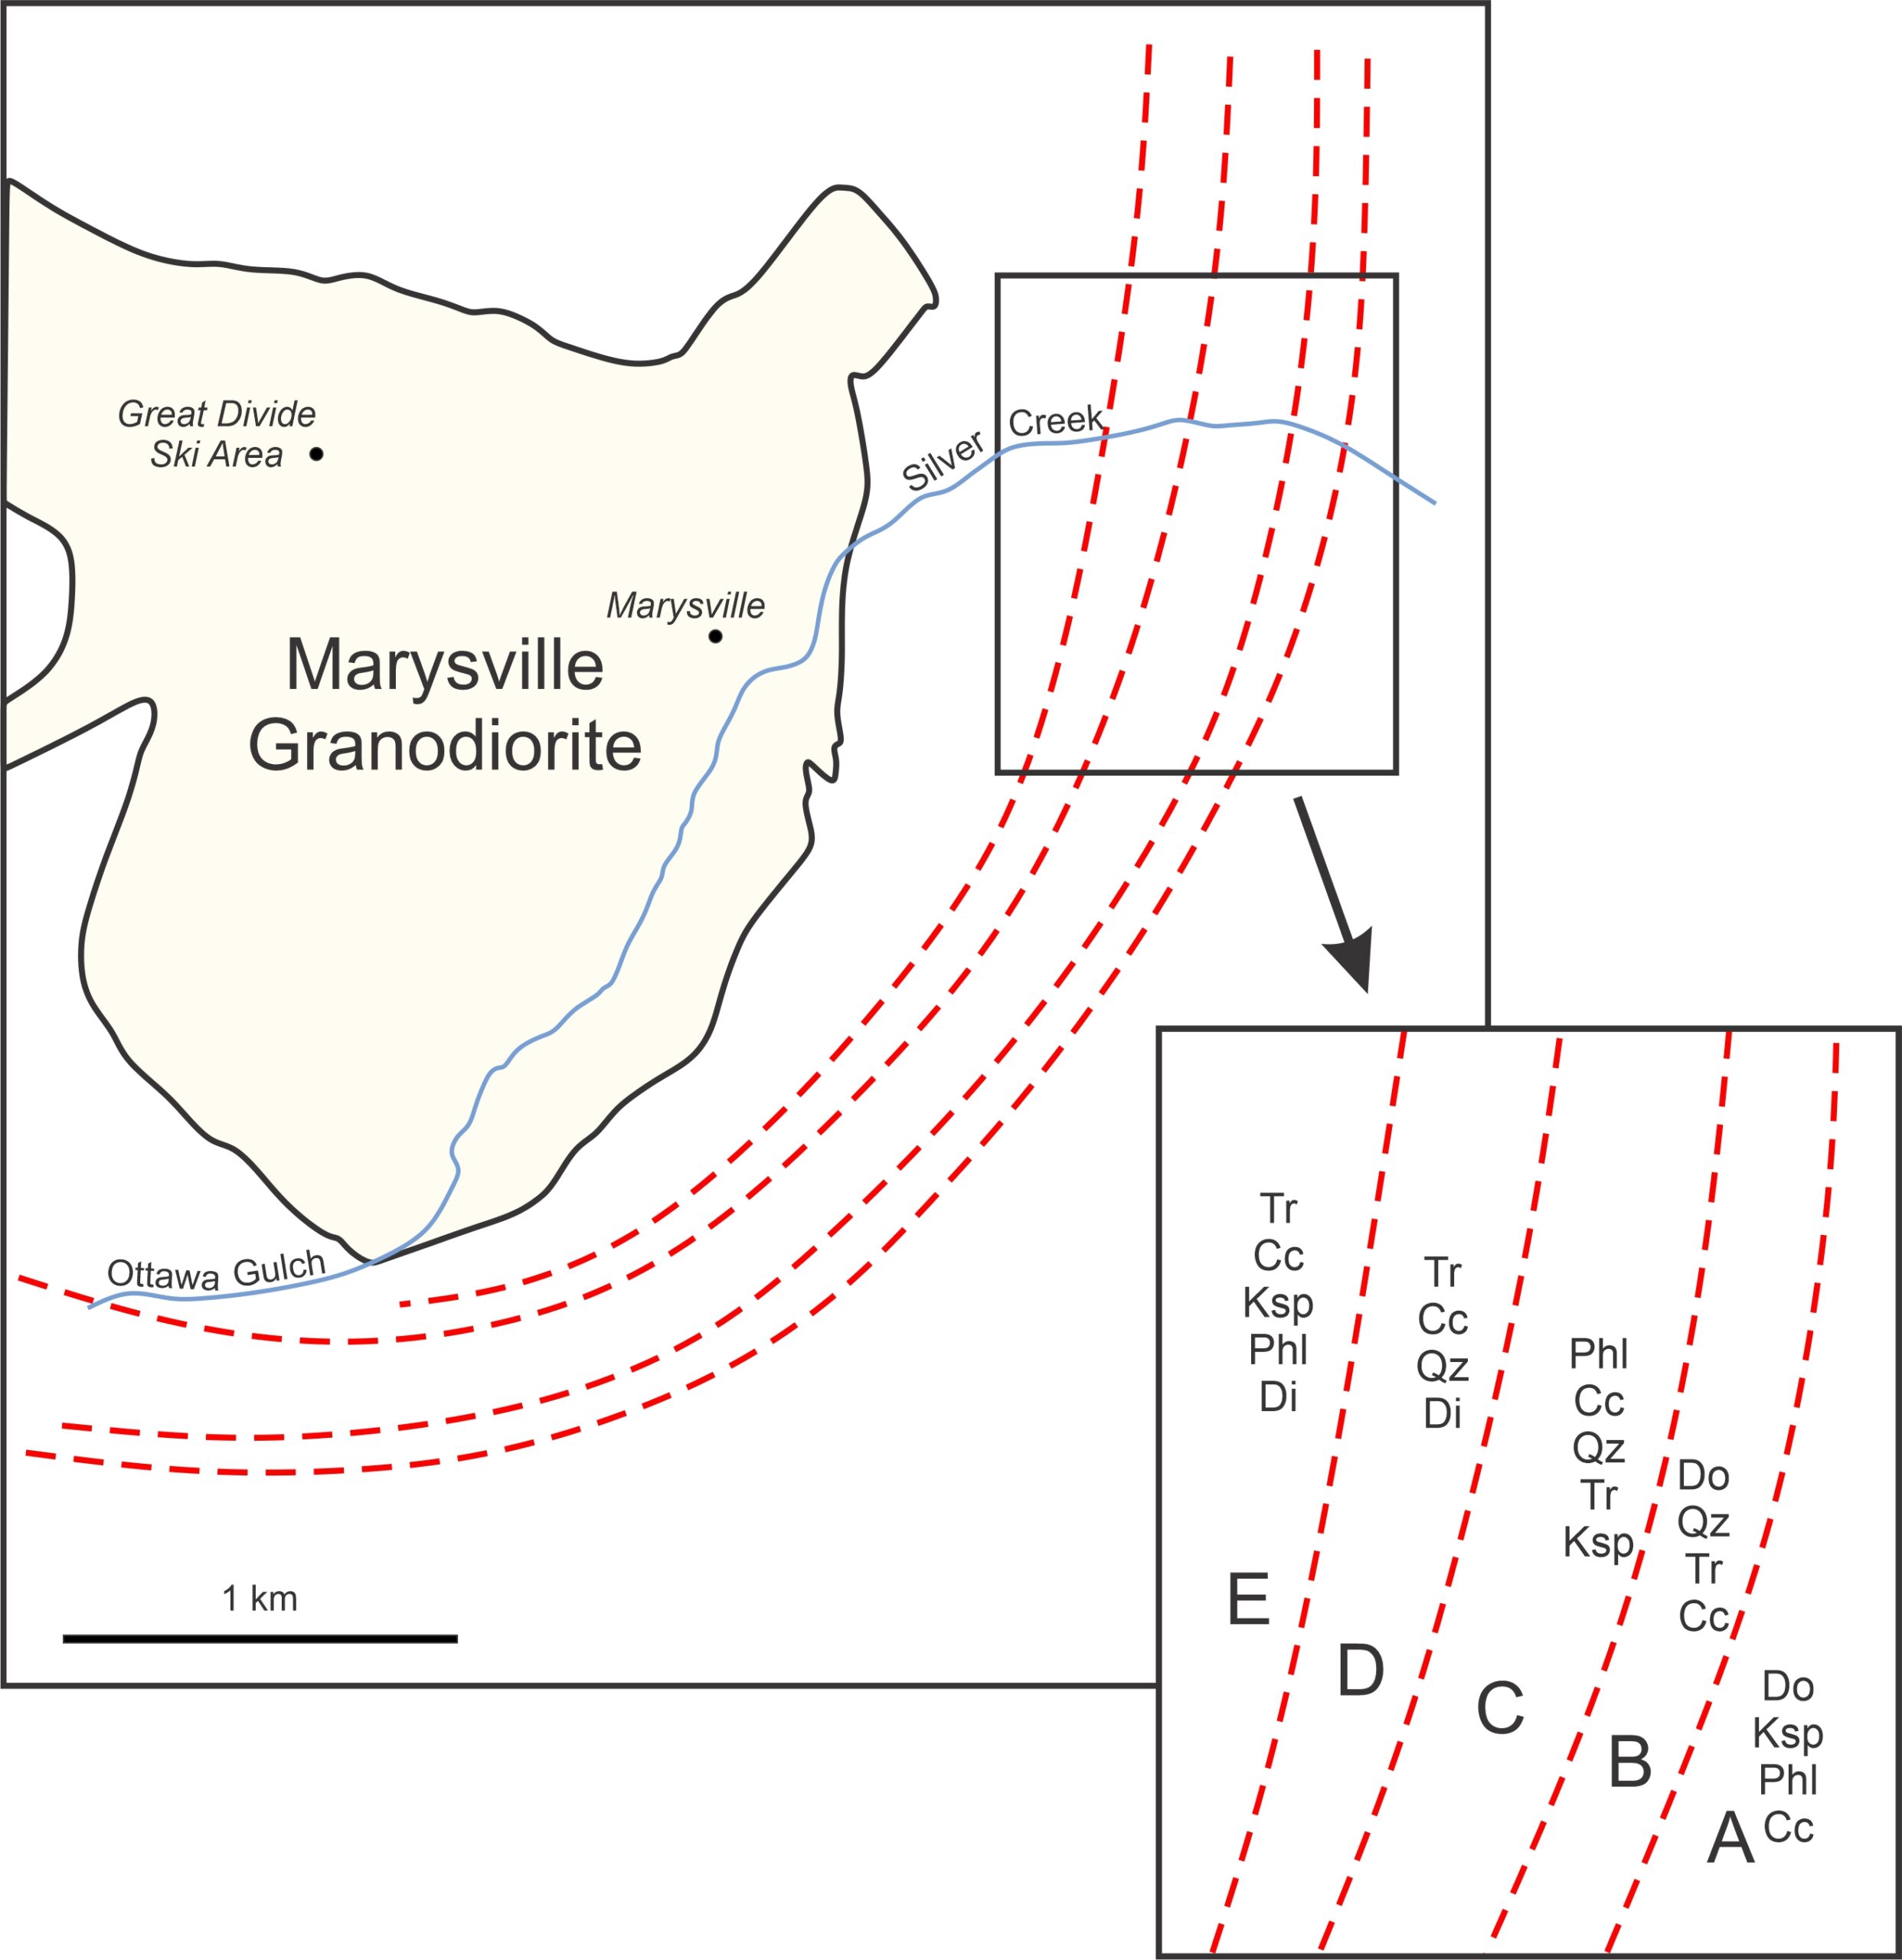
Figure 15.22 shows isograds around the Marysville granodiorite mapped by Rice (1977). Rice found that mineral zones (A through E), up to 100s of meters across that contained univariant assemblages corresponding to the following reactions:
| [Rxn 14] | A: 3 dolomite + K-feldspar + H2O = phlogopite + 3 calcite + 3 CO2 |
| [Rxn 8] | B: 5 dolomite + 8 quartz + H2O = tremolite + 3 calcite + 7 CO2 |
| [Rxn 15] | C1: 5 phlogopite + 6 calcite + 24 quartz = 3 tremolite + 5 K-feldspar + 6 CO2 + 2 H2O |
| [Rxn 6] | C2: dolomite + 2 quartz = diopside + CO2 |
| [Rxn 9] | D: tremolite + 3 calcite + 2 quartz = 5 diopside + 3 CO2 + H2O |
| [Rxn 16] | E: 3 tremolite + 6 calcite + K-feldspar = phlogopite + 12 diopside + 6 CO2 + 2H2O |
Rice concluded that the rocks acted as closed systems and that the minerals present during metamorphism buffered the fluid composition. So, each of Rice’s five zones contains a reaction (or two reactions in zone C) in progress, and rocks on the sides of zones closest to the granodiorite equilibrated at higher temperatures than those on the outer sides.
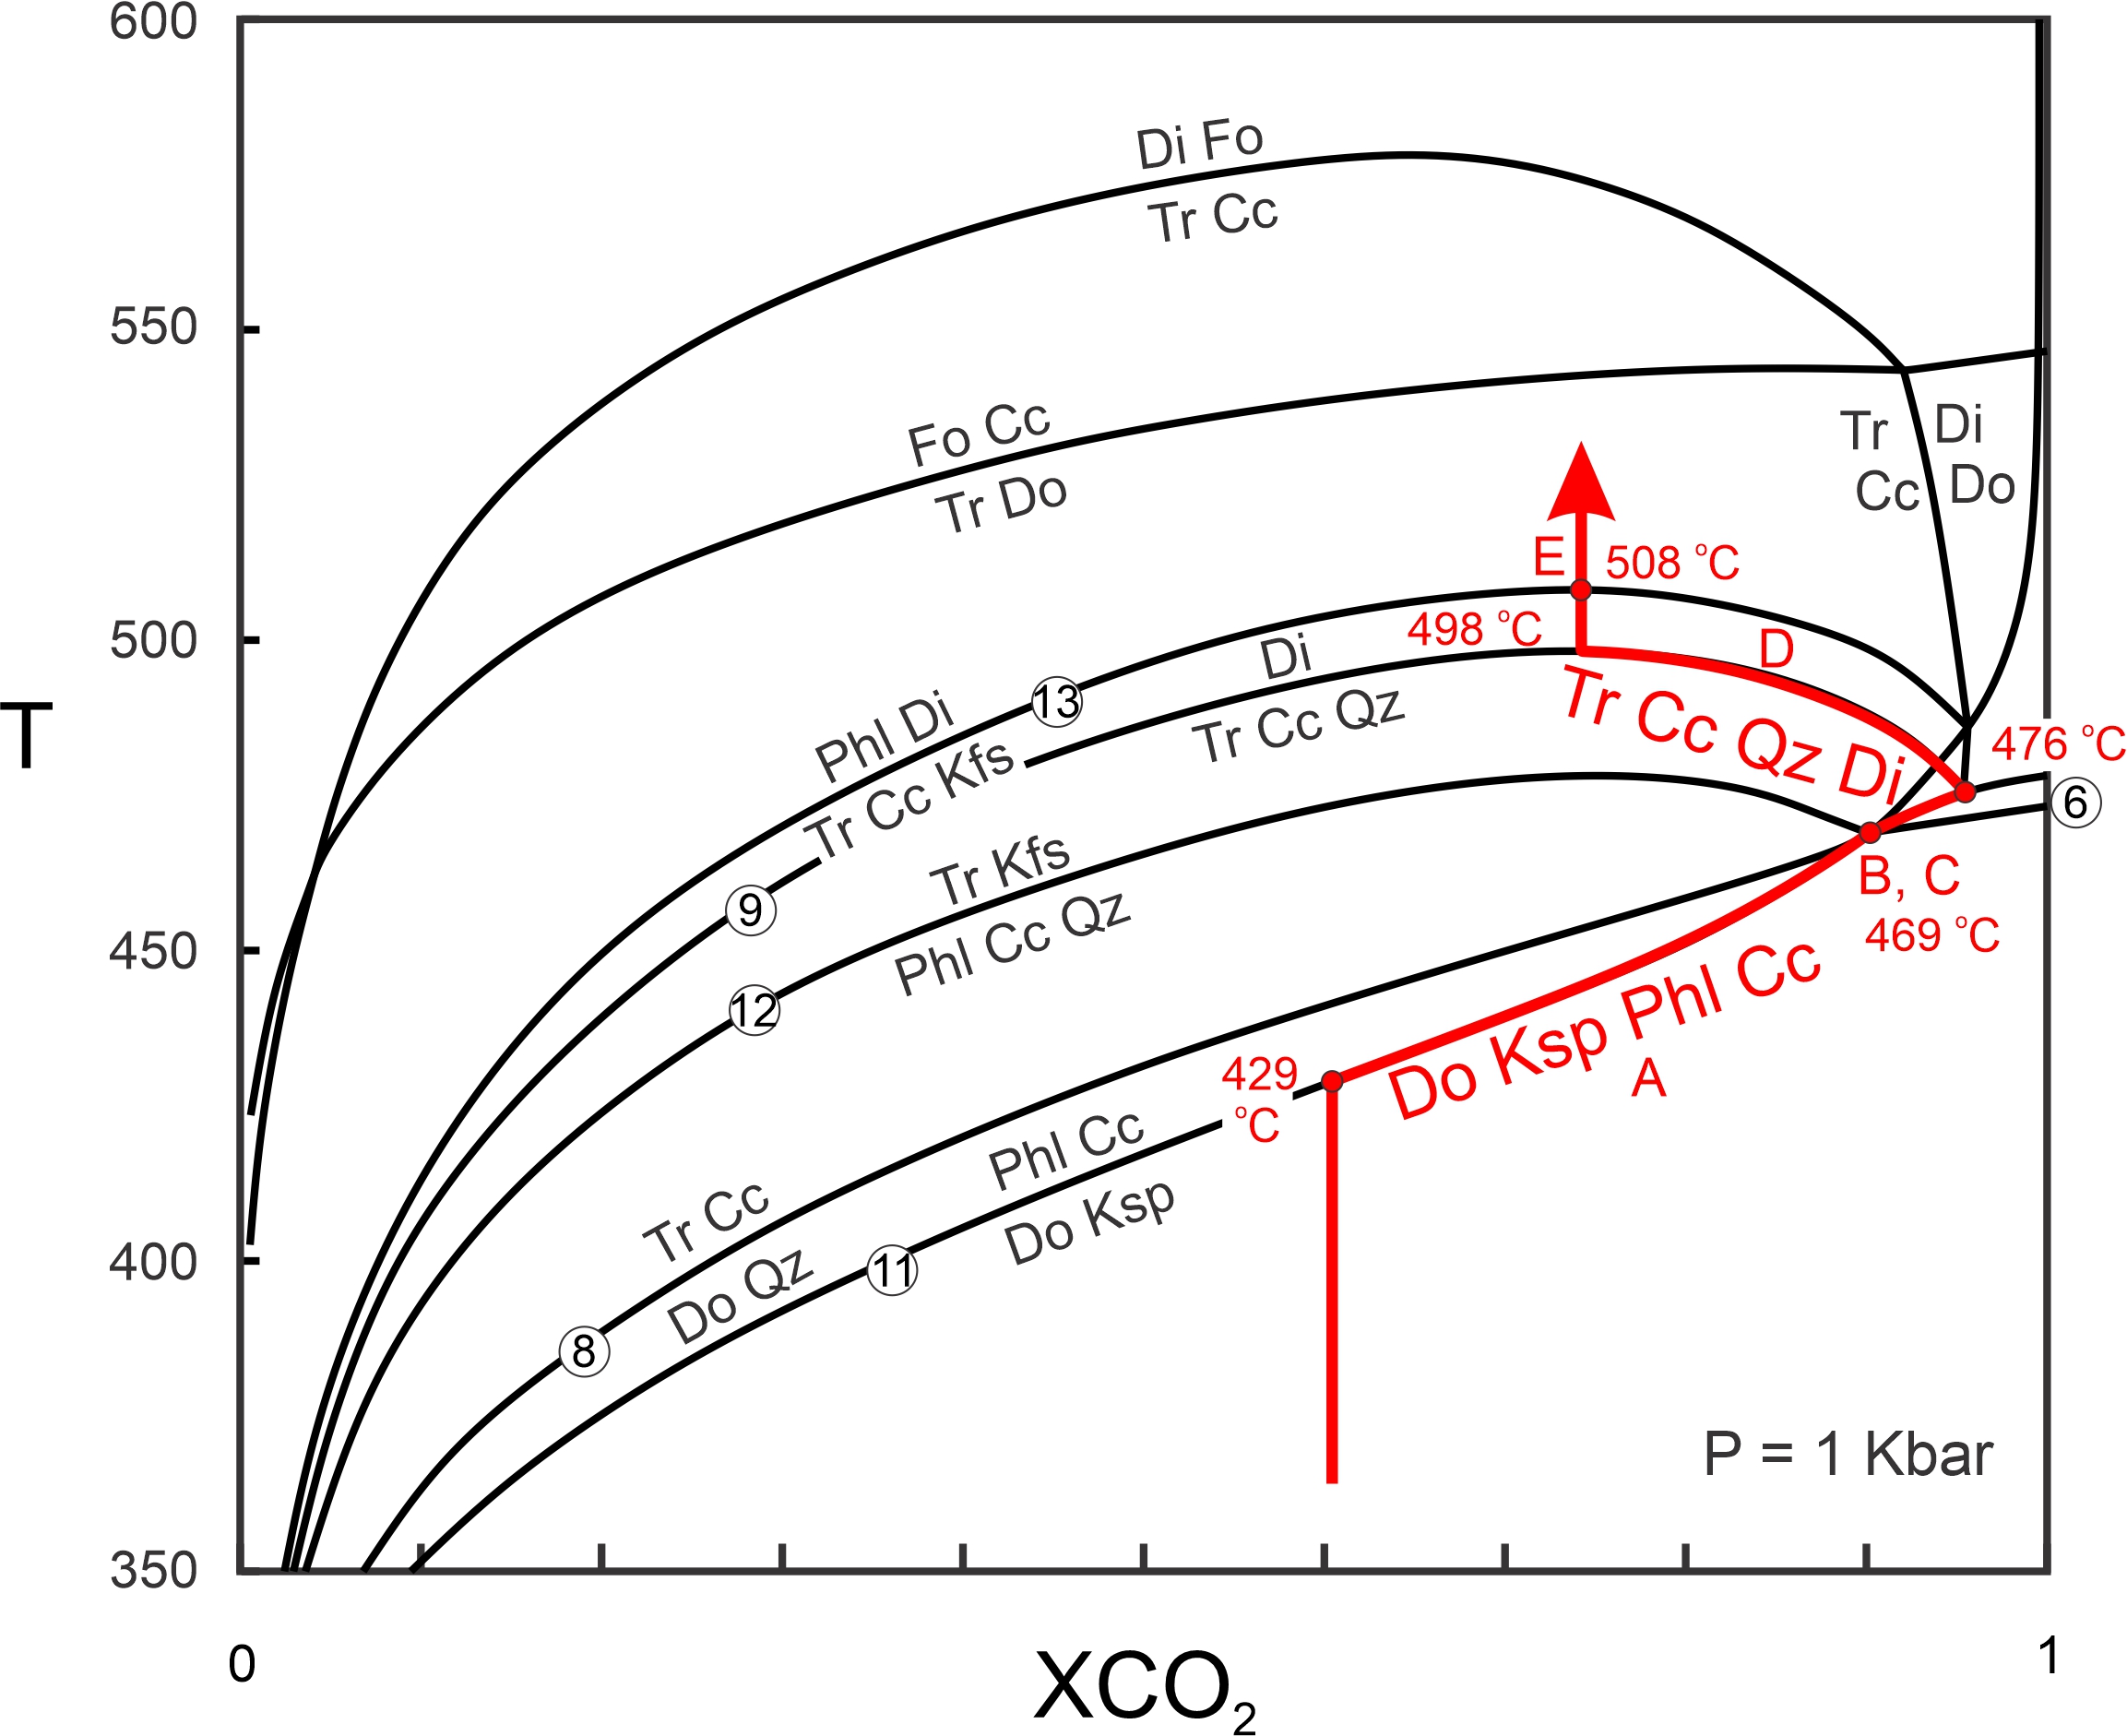
Figure 15.23 shows the path of progressive metamorphism described by Rice. The rocks were heated until Reaction 14 began at about 430 oC. Fluid composition then became more CO2-rich and followed the reaction curve (path A) to the invariant point B at 469 oC. At this point, dolomite and quartz reacted to produce tremolite and diopside. Simultaneously, phlogopite, calcite, and quartz reacted to yield tremolite and K-feldspar. Heating continued to the next invariant point (path C) at 476 oC. With further heating, tremolite, calcite, and quartz reacted to produce diopside as fluid composition became more water-rich (path D). Finally, at 508 oC, tremolite, calcite, and K-feldspar reacted to give phlogopite and diopside. Two high-temperature reactions that might have produced forsterite, never occurred because temperature did not get hot enough.
15.8.3 Skarns
A special kind of calcsilicate rock, a skarn, sometimes called a tactite, develops by hydrothermal metamorphism in contact aureoles around igneous intrusions. Fluids from the intrusion may enter the surrounding country rock, causing metasomatism that introduces significant Si, Al, Fe, or Mg, and perhaps removes other elements. This can lead to a variety of new metamorphic minerals. These minerals, mostly Ca-Mg-Fe-Al silicates, may include any of the minerals listed in Table 15.2.
15.8.3.1 The Willsboro Skarn, New York

Typical skarns have zones, parallel to the contact between the intrusion and the country rock, that contain different mineral assemblages. The zones may be anywhere from a few centimeters to many kilometers thick. Skarn minerals in these zones often form large colorful euhedral crystals that are prized as museum specimens. Figure 15.24 shows skarn zones around an anorthosite intrusion at the Lewis wollastonite mine in New York.
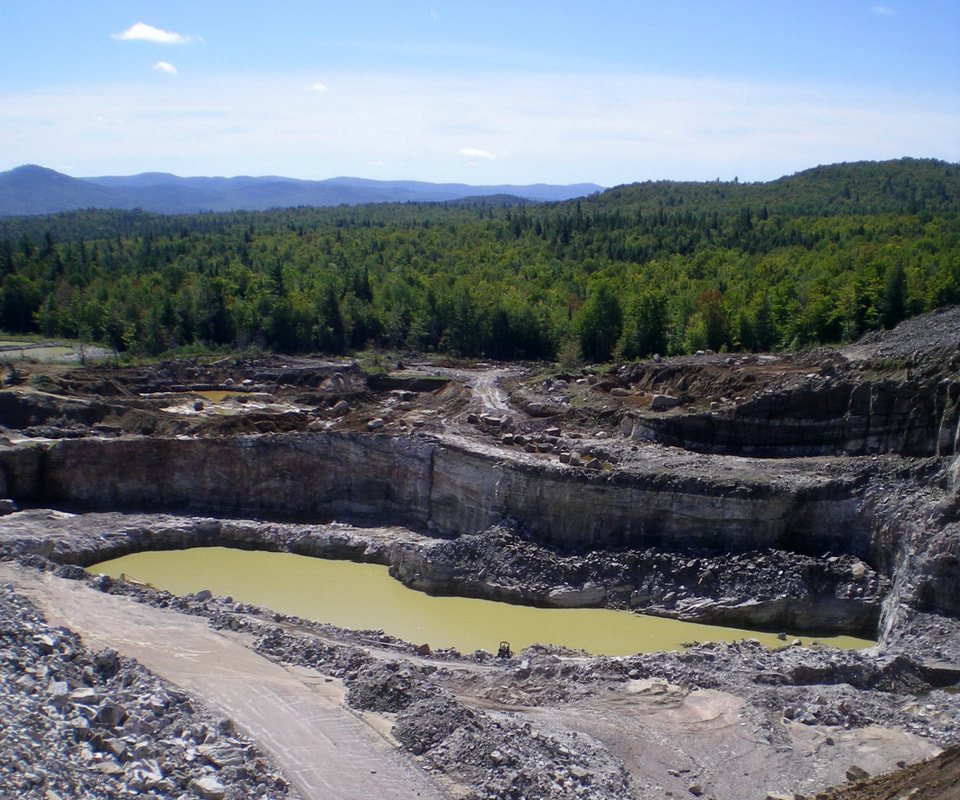
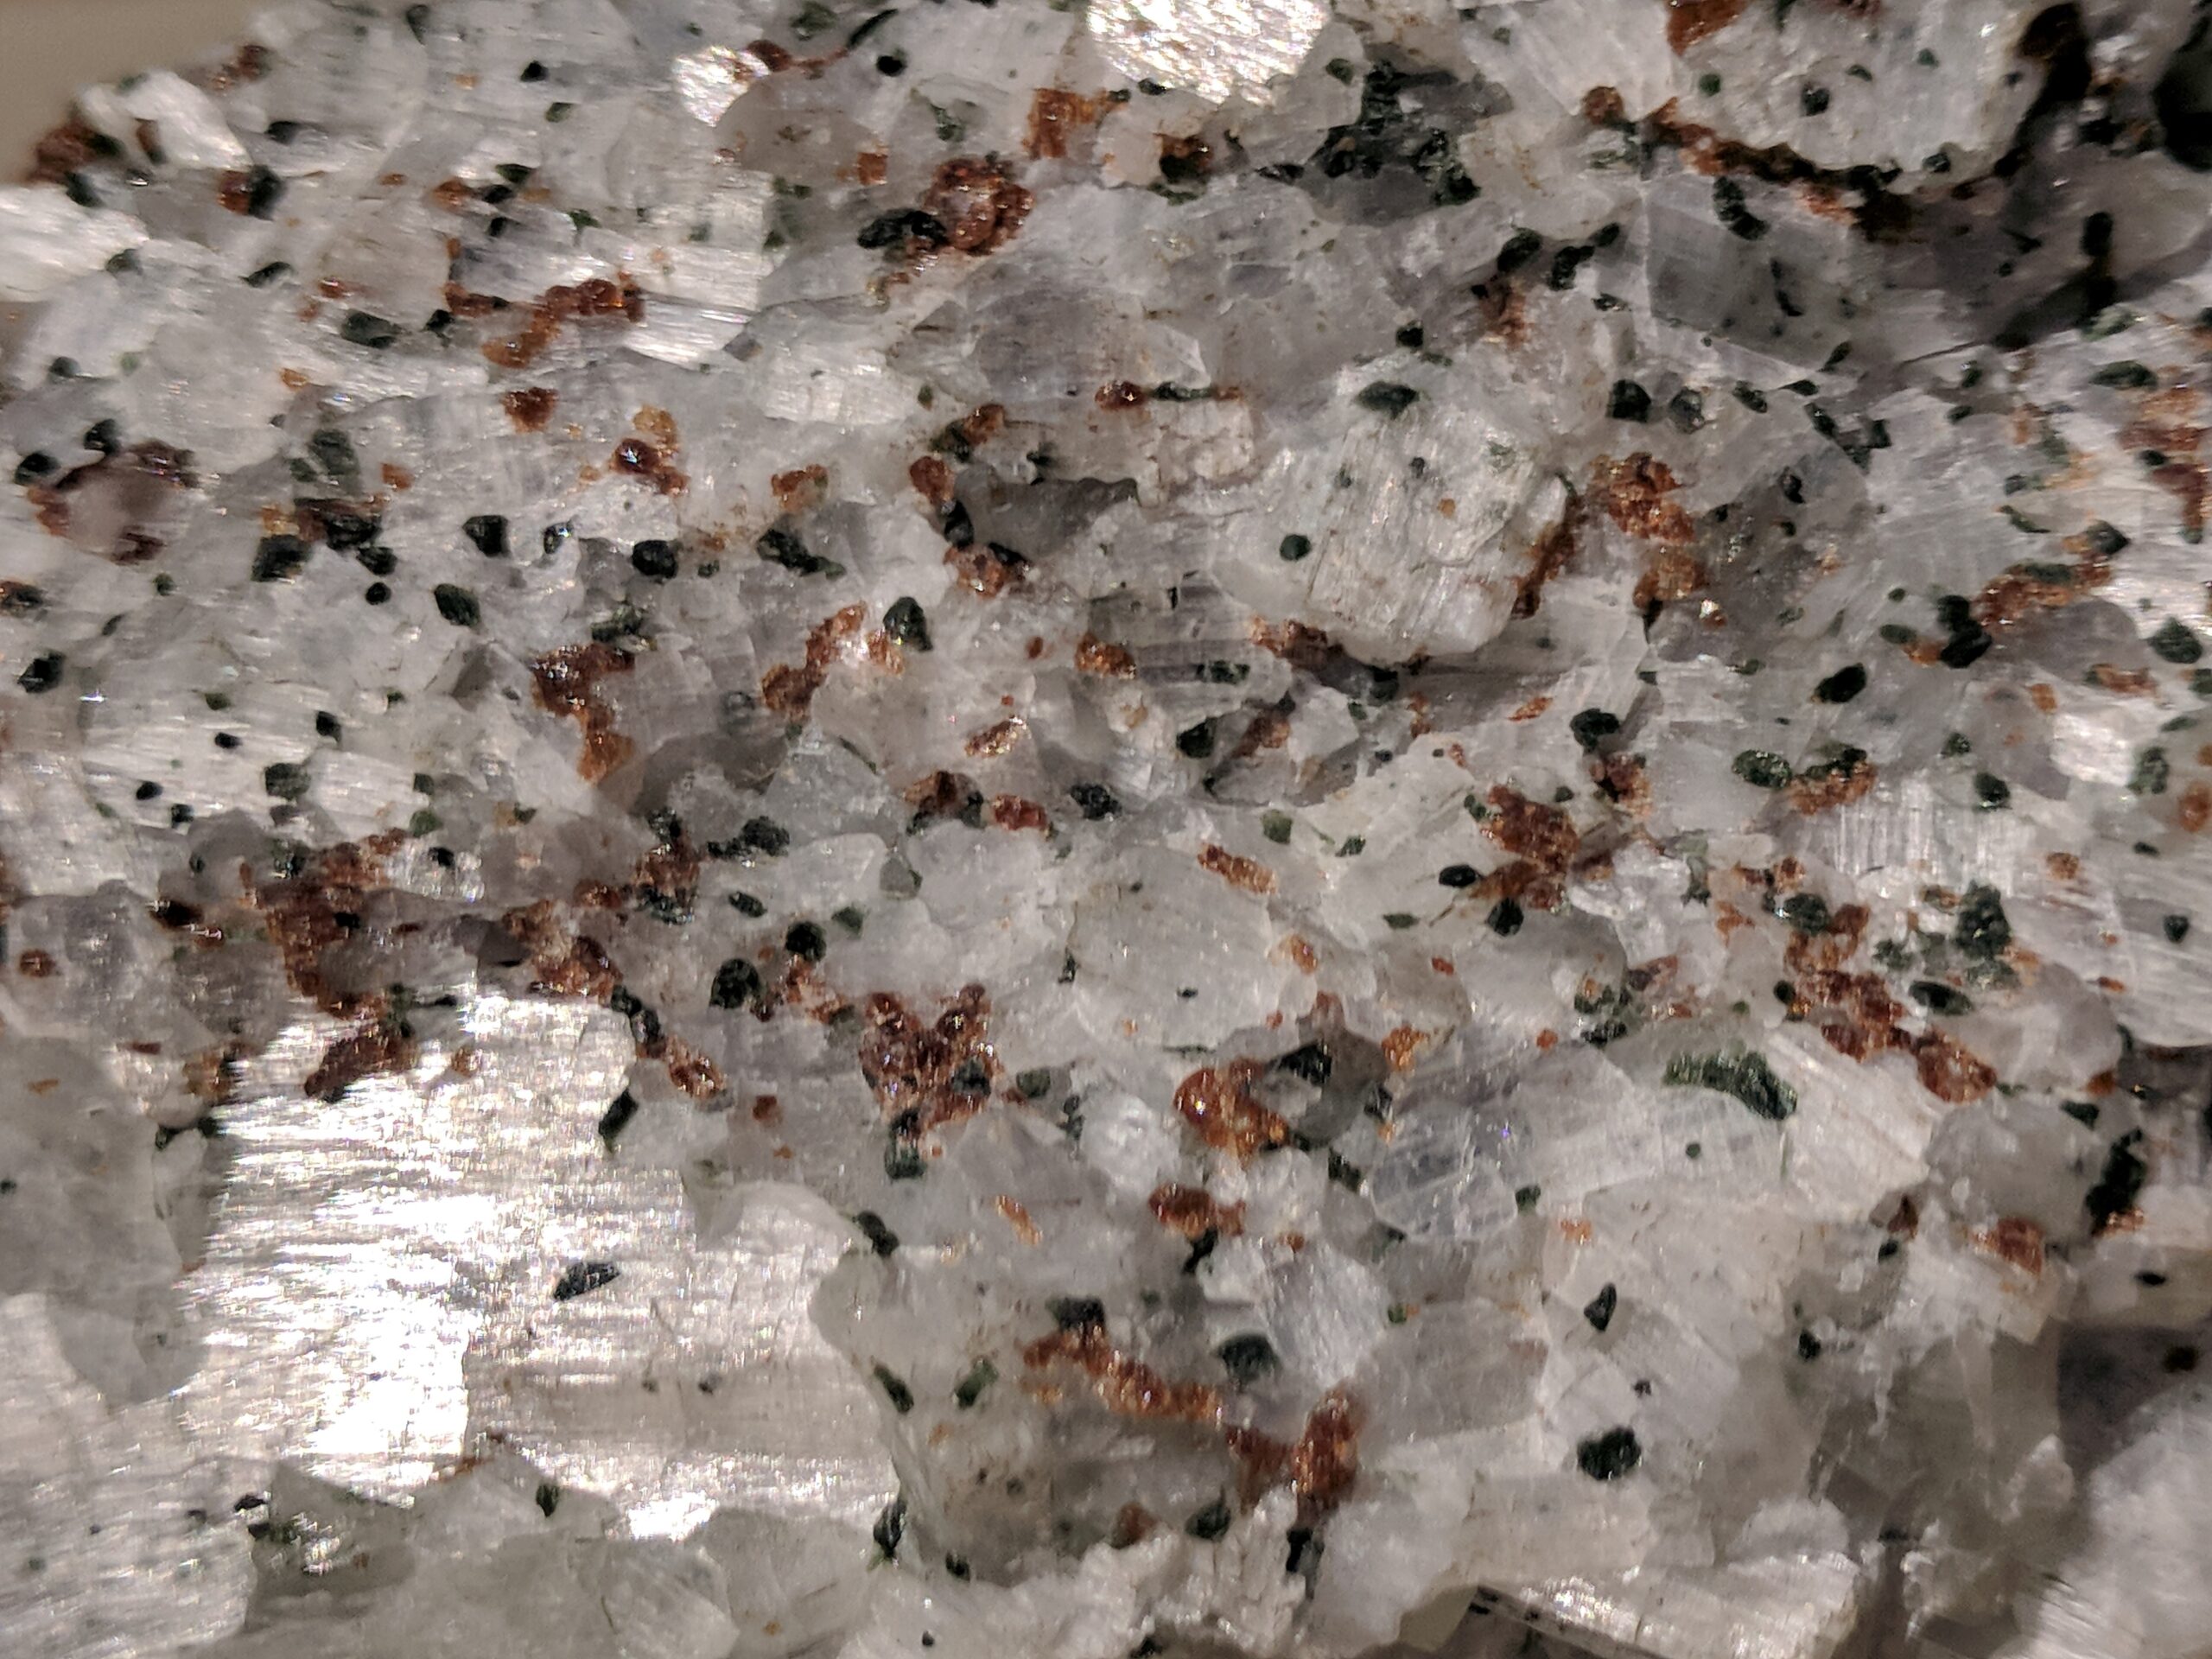
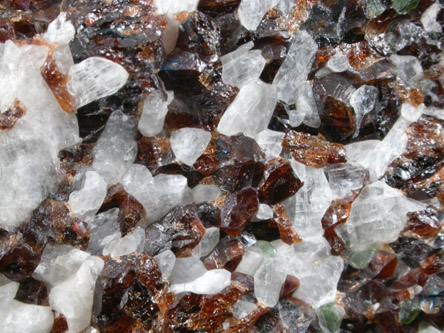
Besides providing mineral specimens, skarns also sometimes host significant ore deposits. For example, wollastonite, an important component in ceramics, paints, plastics and in a few other kinds of products, is mined from skarns. In the United States, the only active wollastonite mines are in New York, and the Lewis Mine at Willsboro (seen in Figure 15.25 below) produces the most ore. The photos In Figures 15.26 and 15.27 show samples of the skarn rock from that mine.
|
|
|
|
15.8.3.2 The Crestmore Skarn, California
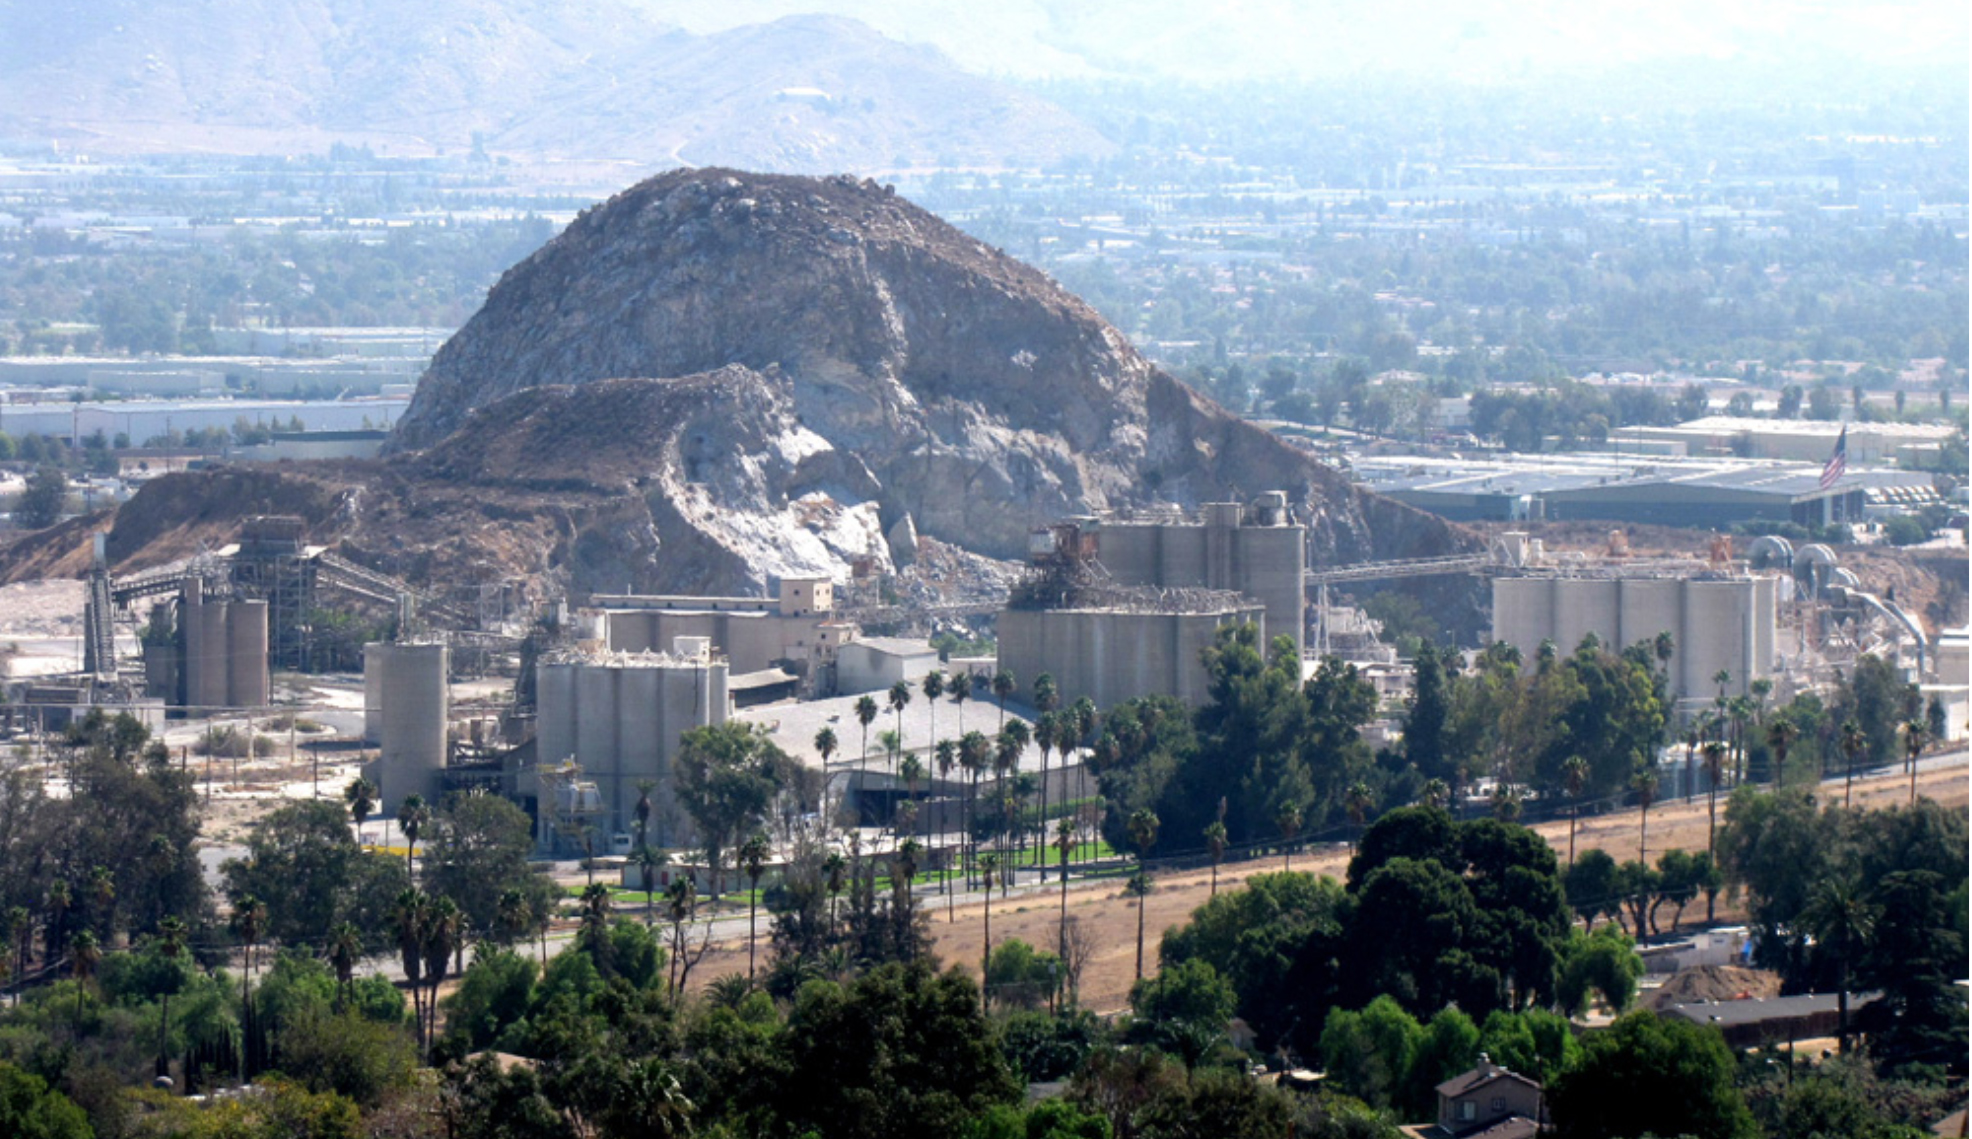
The photo below in Figure 15.28 is of a limestone quarry at Crestmore, in Riverside County, California. Quarrying for cement manufacturing, beginning in the early 1940s and ceasing in 1986, uncovered a well-developed skarn around a granitic intrusion. Figure 15.29, a vertical cross section of the skarn, shows that it has four main concentric zones containing different minerals. The thickest zone is about 15 meters across at its widest point.

blank
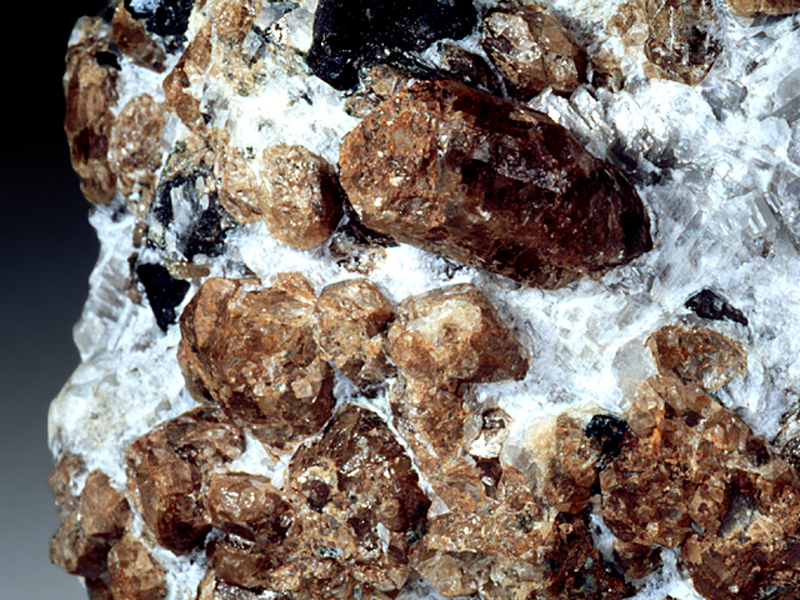
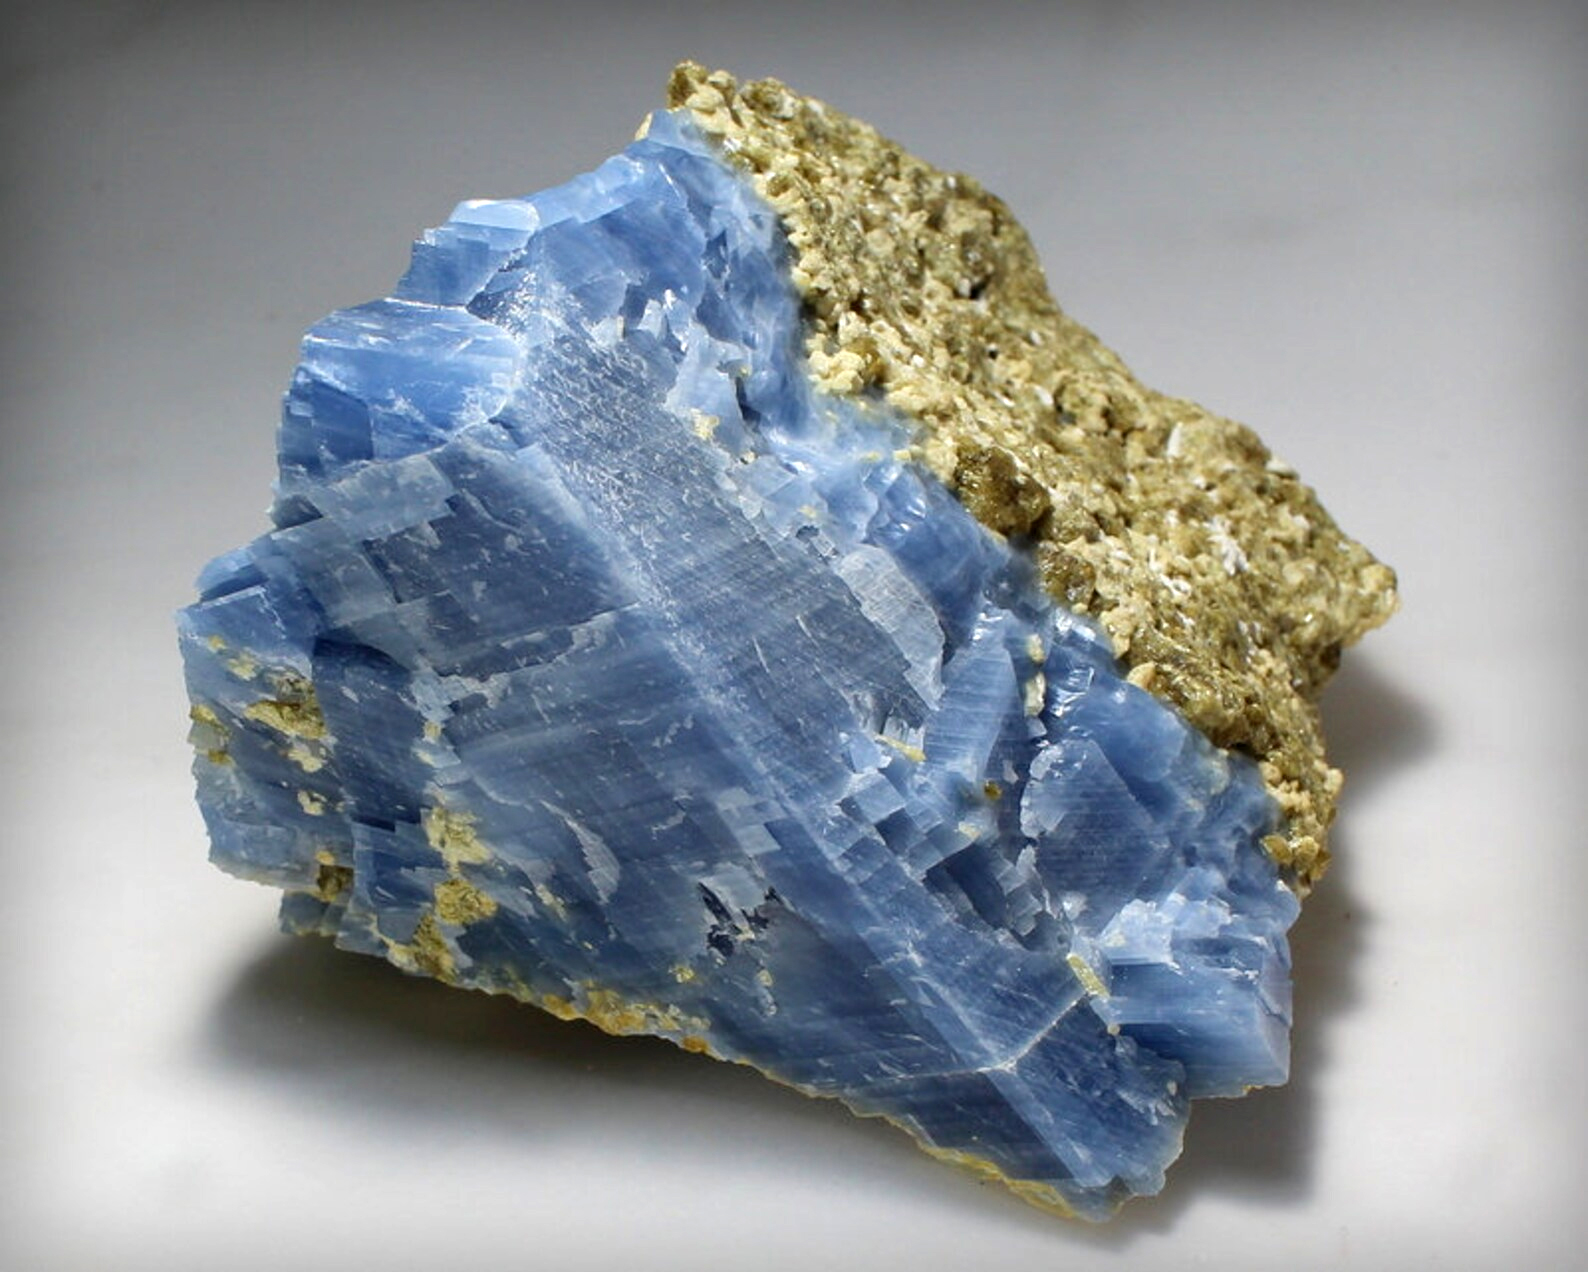
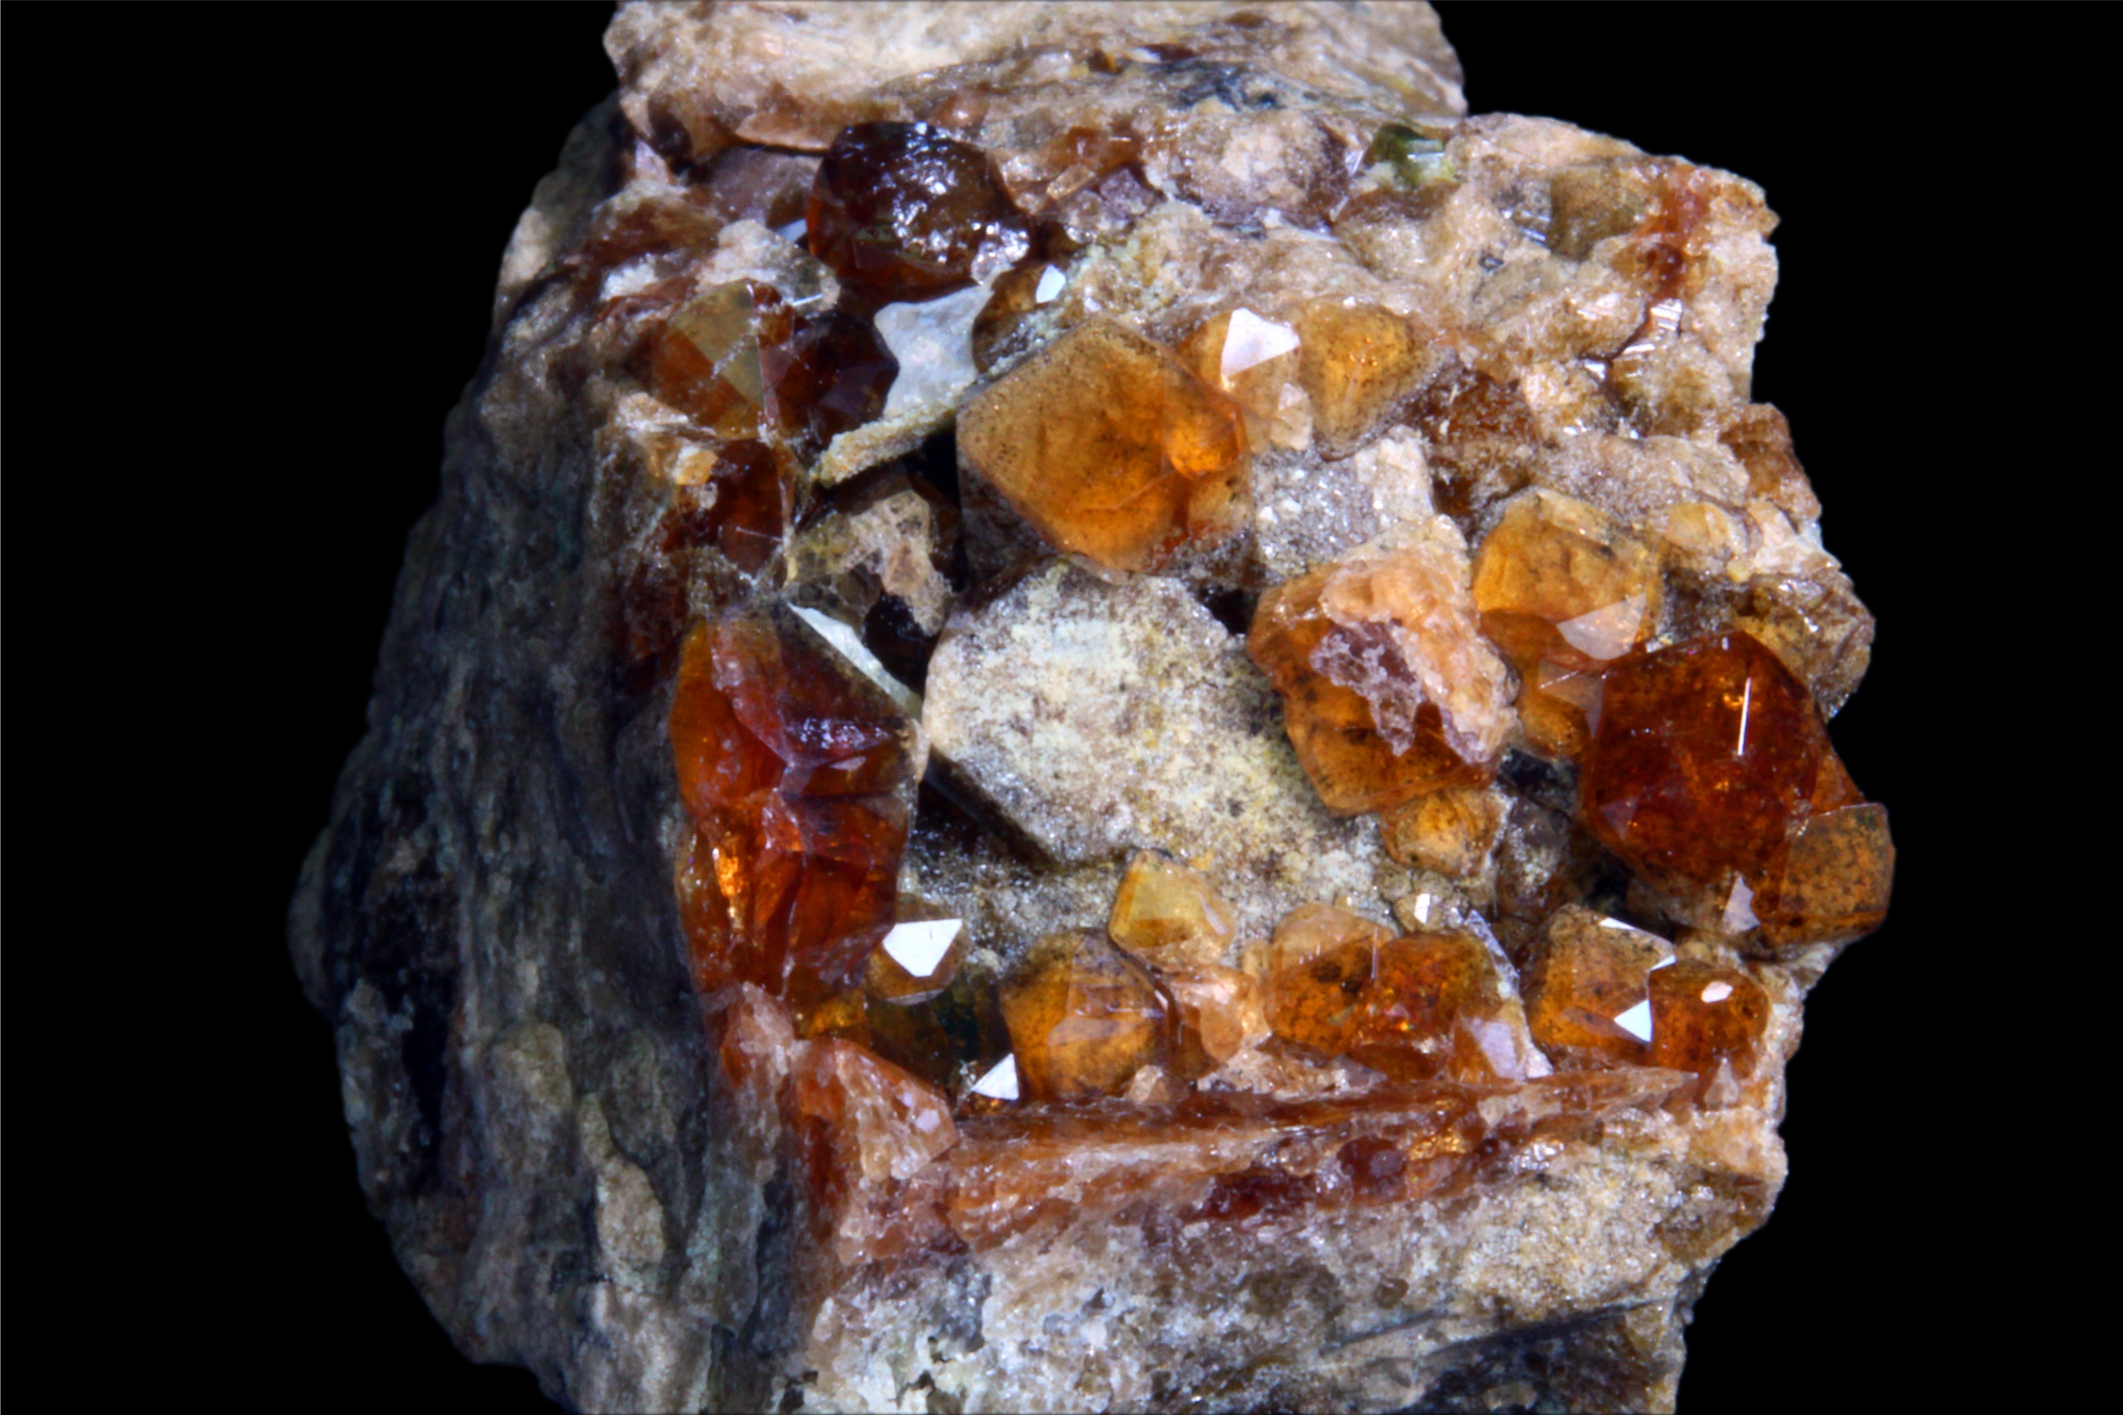
The outermost zone of the Crestmore aureole is a calcite-rich marble that, in places, contains brucite. The calcite has a spectacular blue color that can be seen in photos below (Figures 15.30 and 15.32). Monticellite (a Ca-Mg silicate), accompanied by a few other relatively rare metamorphic minerals, characterizes the next zone inward. Figure 15.31 is an example of brown monticellite with calcite. Still closer to the intrusion, vesuvianite (a Ca-Mg-Fe silicate), appears. The photo in Figure 15.32 contains brown vesuvianite with blue calcite. Closest to the intrusion, the marble typically contains diopside (Ca-Mg silicate), wollastonite (Ca silicate), or garnet (Ca-Al silicate). Figure 15.31 is an example of the garnet-bearing rock with garnet crystals up to 2 cm across. The compositions of the rocks in the four zones at Crestmore are not the same because significant metasomatism occurred during metamorphism. Thus, the different minerals are found in different zones because of variations in both metamorphic temperature and differences in rock composition.
|
|
|
|
|
|

| Chapter 16 Section 16.3.5 contains many photos of metamorphosed carbonate rocks in hand specimen and in thin section. If you want to know what they look like, go there. |
● Figure CreditsUncredited graphics/photos came from the authors and other primary contributors to this book. 15.0 (cover photo) Marble outcrop, alavigne.net |


Contents
- 15.1 Metacarbonates
- BOX 15.1 Minerals, Abbreviations and Formulas
- 15.2 Decarbonation Reactions
- 15.3 T-X Diagrams
- 15.4 A More Realistic Grid
- 15.5 The Influence of Rock Composition
- 15.6 Index Minerals in Metacarbonates
- BOX 15.2 A Cute Jingle
- 15.7 Open Systems and Closed Systems
- 15.8 Metamorphism at Different Scales
- ● Figure Credits