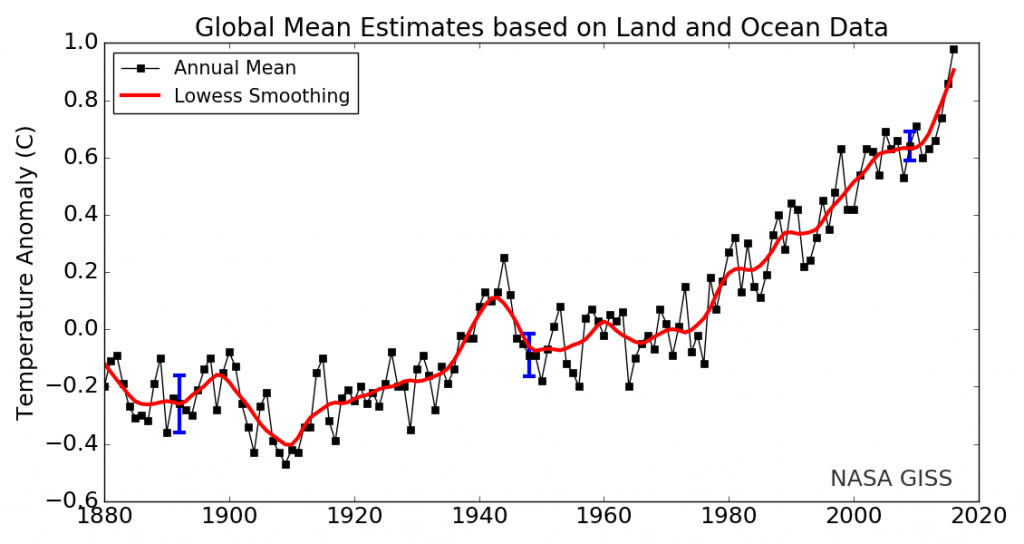
Land-ocean temperature index, 1880 to present, with base period 1951-1980. The solid black line is the global annual mean and the solid red line is the five-year lowess smooth. The blue uncertainty bars (95% confidence limit) account only for incomplete spatial sampling.
Source: https://data.giss.nasa.gov/gistemp/graphs/