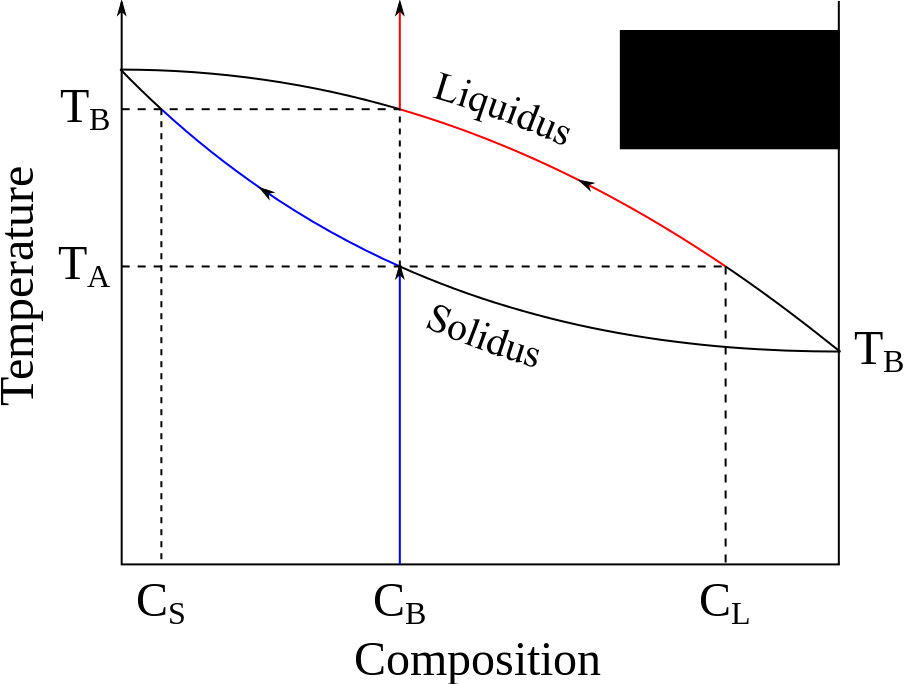
Melting of a substance exhibiting a change in composition, with a bulk composition of CB. As the temperature rises, the solid follows the blue path, and begins melting at temperature TA. The initial liquid produced has the composition CL, and its composition follows the red path. At temperature TB, the whole solid has melted.
By Solidification_1er_cristal.svg: Cdangderivative work: Fitzgabbro (Solidification_1er_cristal.svg) [CC BY-SA 3.0 or GFDL], via Wikimedia Commons