KEY CONCEPTS
At end end of this chapter, students should be able to:
- Describe the development of the use of fossils as evolutionary tools.
- Identify major patterns seen in the fossil record as a result of evolutionary change.
- Describe the basics of cladistic analysis using fossils.
- Understand the connections between speciation and extinction.
- Identify several important mass extinction events in the Earth’s past.
- Discuss the difference between background extinction and mass extinction.
“The theory of punctuated equilibrium, proposed by Niles Eldredge and myself, is not, as so often misunderstood, a radical claim for truly sudden change, but a recognition that ordinary processes of speciation, properly conceived as glacially slow by the standard of our own life-span, do not resolve into geological time as long sequences of insensibly graded intermediates (the traditional, or gradualistic, view), but as geologically “sudden” origins at single bedding planes.”
— Stephen J. Gould, “Time’s Arrow, Time’s Cycle”, 1987
Changing Perspectives on Fossils: Evolution’s Silent Sentinels
Figured Stones
Fossils are evidence of ancient life. However, they were not always seen as such. The evolution of our understanding of these figures in stone is a classic example of how science progresses with new knowledge. Since the time of the ancient Greeks, people have noticed seashells in stones far from shore and well above current sea level. Greek writers including Xenophanes, Herodotus, Strabo, and Eratosthenes interpreted them being left behind by the ebb and flow of the sea. They also viewed the Earth as eternal. Perhaps because later Christian thinkers saw this view of the Earth as too Pagan, in conflict with the Biblical account in Genesis, these views eventually fell away from acceptance in Western Europe. Still, people wondered about the odd shapes in local rocks, referred to at the time as “figured stones”. Today, we know them as fossils.
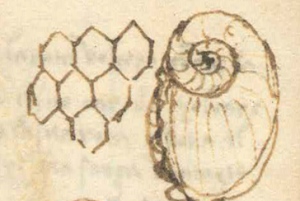
A drawing of fossil structures, Palaeodyction, from a “figured stone” by Leonardo Da Vinci, from his unpublished Paris Manuscript I.
They saw them contained within the building blocks of cathedrals, along pathways, and in the mountains. Fossils of marine shellfish, Long pulled from the limestones of the Alps, were not seen as evidence of former life despite their similar appearance with living shellfish of the time. Or if they were originally from the sea, the preferred interpretation was that they were a remnant of the global deluge, a result of the deposition of organisms along a globally flooded, and eventually inundated land surface. Others interpreted the figures in the rocks not as evidence of flood deposits but as having been placed there during creation itself. Divinely created as is, they were considered to be miraculous. Still the ultimate nature of fossils remained elusive to most, until Nicholas Steno (1638-1686), a Danish scientist, had another idea.
Steno was trained as an anatomist. He also had many other interests. Cutler (2003) recounts Steno’s life, beginning with his famed skill at dissection. These skills led him to many discoveries, including the salivary glands in mammals. This fame led him to the Medici court in Florence, Italy, where he not only found financial support, but also was given the opportunity to study anything he wanted. This freedom of curiosity and creativity would lead eventually to his geological explorations. It would be these geological discoveries, rather than anatomical insights, that would make Steno famous as the “father” of geology.
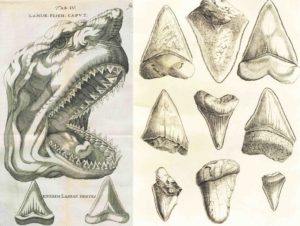
Steno was curious about the “figured stones”. Some contained what looked like seashells while still others contained structures that the local people called “tongue stones” (Figure XX). After studying in detail the head of a shark specimen reeled in by two fishermen in 1666, Steno would make the connection between the similar shape of that shark’s teeth and the “tongue stones” found encased in rocks nearby. He was the first to publish accurate interpretations regarding how such a “solid within a solid” could be possible, suggesting that these tongue stones represented evidence of ancient life: tongue stones were the teeth of long-dead sharks! He argued that the encased solid (the shark tooth in this case) had to first exist on its own, prior to being encased. This line of reasoning is an early form of his “principle of relative dating by inclusions”, that is still utilized today. His recognition of these “figured stones” as fossils would lay the groundwork for a rebirth of thought about Earth’s past that would carry into the minds of enlightenment thinkers just decades later. As scientific understandings of observation and experimentation would advance, so too would our appreciation of fossils as evidence of the history of life itself, including our species’ own backstory.
Figured Stones to Fossils: Evolutionary Foundations
Other scientists of Steno’s time would fully accept fossils as being evidence of ancient life. One such contemporary was Robert Hooke (1635-1703), who studied fossils under the microscope. While conducting this work, he noticed similarities between features in certain fossils and extant organisms. He noted that mineralization could occur between wood fibers, producing permineralized wood. He also determined that shells could be turned into fossils after being filled with mud or clay. After Steno, two key individuals would emerge whose work and ideas would lay the groundwork for the use of fossils toward understanding past life.
The first was Carl von Linné (a.k.a. Carolus Linnaeus; 1707-1778). Linneaus was interested in fossils, and while he did not recognize them yet as evidence of prior life, he did acknowledge they were distinctively different than other kinds of rocks and minerals. Linnaeus’ original classification system included three kingdoms. These were Regnum Animale (Animal), Regnum Vegetabile (Vegetable), and Regnum Lapideum (Mineral). While these labels are still used today, our current classification schemes for animals, plants (vegetable), and geological materials (rocks and minerals) are very different. In Linnaeus’ Mineral Kingdom, he did take pains to do what others before him struggled with. He separated fossils out as being different from rocks. He did not call them evidence of ancient life, but he recognized that they were different in some way.
The second important paleontologist of this time was George Cuvier (1769-1832). He fully accepted fossils as being evidence of ancient life. Because Cuvier saw fossils as ancient life, he was the first to include them in the Linnaean system along with living forms. During his life he collected a massive amount of fossil material from the New World. Using this collection, he would eventually argue for the existence of extinction through his study of megafaunal fossils, in particular. The extinction of an entire species was not thought to be possible, or at least common, in nature. Cuvier’s revolutionary ideas surrounding extinction, supported by the fossil record, represent a paradigm shift in how fossils were viewed. Not only were they evidence of ancient life, but they were also evidence of wide-scale ancient death. And, extinctions make way for evolutionary change.
Evolutionary Patterns in the Fossils
Pattern 1: Inherently Biased Data
Evolution is well supported in the fossil record. Even so, the limitations of this record create significant challenges for understanding the history of extinct life. For instance, using cladistics to organize known fossils into clades based upon shared and derived characteristics is very useful. However, only a small percentage of life is fortunate enough to come down to us as a fossil, allowing its story to be told. Significant gaps, or missing data, occur in the record. This bias in the record tends to be against taxa with no hard skeletal parts, those that are generally fragile, and those that live in habitats where rapid burial is unlikely or other circumstances are not ideal for fossilization. Within the time range of a species, there are great uncertainties about its origination and its extinction, when it appears and when it dies off. In fact, these exact moments in the life of a species are entirely impossible to determine. The cause of this effect is a sampling bias, related to a variety of causes, but most critically to the overall problem that not everything gets fossilized and, what has been fossilized is not all that has been found. Philip Signor and Jere Lipps (1982) described this sampling bias, now referred to as the Signor-Lipps Effect, because the oldest appearances of a given taxon appear to come on gradually just as the youngest appear to die away gradually, even if the extinction (or origination) itself was actually quite sudden.
The Cretaceous/Paleogene extinction event that ended the reign of reptiles is an excellent case study for this challenge (Alvarez et al., 1980; Signor and Lipps, 1982). Until Walter and Luis Alvarez identified an asteroid as a cause of this geologically sudden extinction, mass extinctions were thought to come on quite gradually because of the apparently slow disappearance of fauna in uppermost Cretaceous strata. The Signor-Lipps Effect signal in the rock record below the extinction boundary suggested that it was gradual – a matter of relative appearance. Their work showed otherwise and so proved that such events can happen suddenly, despite what the record of fossils might appear to be showing.
Pattern 2: Fossil Succession
Because the fossil record shows evolution occurring through time, we can reconstruct the story of life. Cladistic analysis, the discovery of transitional fossils, and the abundance and variety of organisms that have been discovered all support the evolutionary story of descent with modification. Because of this, when we find a rock with a particular fossil in it, we can assign a relative age to it because we have a good understanding of the succession, or sequence, of organisms in the record. Biologist J.B.S. Haldane (purportedly in a conversation with Paul Harvey in 1970), once asked how his confidence in the theory of evolution could be challenged, replied, “fossil rabbits in the Precambrian”. There is little concern that such an outlandish discovery would, however, negate evolutionary theory. Rather, such a radical change in our understanding of fossil succession would merely cause scientists to re-evaluate timelines, originations of species, and other associated evidence toward a recasting of the theory in the light of such new knowledge.
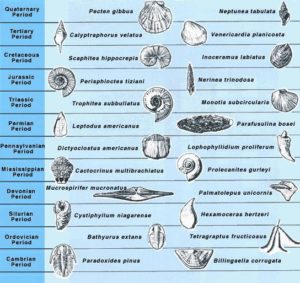
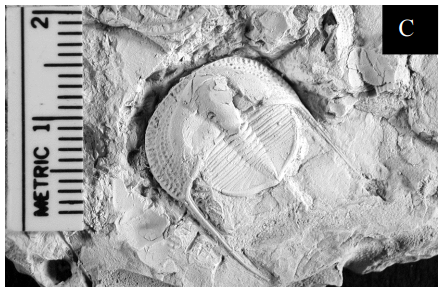
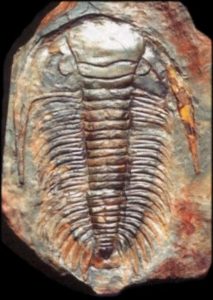
One excellent example of how succession works is with trilobites. These classic and important fossils among invertebrates were a key part of the “Cambrian Fauna” (Sepkoski, 1984). Originating most abundantly in the Cambrian and truly flourishing through the Ordovician Period, they went extinct at the end of the Permian Period, victims of the largest mass extinction in Earth’s history. Because of this, we find no examples of trilobites prior to their origination during the latest Precambrian and none after the start of the Triassic. Knowing the time of their origination and the time of their extinction and the ability to reconstruct the clades within this fossil group’s phylogeny provides a variety of key index fossils that can be used to identify rocks of particular ages, all because scientists have been able to reconstruct their evolutionary history. For instance, Paradoxides pinus is a trilobite typical of the middle Cambrian while the Isotelus maximus is characteristic of the middle to late Ordovician. The presence of these specimens in a rock is key evidence that the host rocks were deposited during these periods of time.
Pattern 3: Transitional Fossils
Transitional fossils are fossilized remains that share ancestral characteristics and those of the derived group of descendants. By this definition, and considering how rapid cladogenesis can occur, there can be a wide interpretation of exactly what constitutes a transitional fossil. Some workers would say that all fossils are transitional fossils! Generally the idea is invoked only between major groups. Table 1 illustrates a wide variety of these, but the classics that come to mind most rapidly for most are Archaeopteryx sp., an organism that is transitional between non-avian dinosaurs and birds (Dengler, 2018), Pakicetus sp., a transitional organism between land mammals and whales (Gingerich et al., 2018), and Tiktaalik, an organism that shares the characteristics of lobe-finned fish while also displaying the derived characters seen in later terrestrial vertebrates (Carroll, 2016).
Fossil Group or Clade | Organism | Features | Image | Between: | Period |
Avialae | Archaeopteryx lithographica | Jaws with sharp teeth, Long bony tail, Feathers |  | Non-Avian Dinosaurs and Birds | Late Jurassic (150 Ma) |
Stegocephalia | Tiktaalik roseae | Scales, Gills, Flattened head, Sturdy interior fin bones, Ears capable of hearing in both air and water |  | Fish and Amphibians | Late Devonian (375 Ma) |
Hominin | Ardipithecus ramidus | Grasping big toe, Reduced canine tooth size, bipedal features in the pelvis and base of skull |  | Common ancestor of chimpanzees and humans | Late Miocene (4.4 Ma) |
Epicynodontia | Thrinaxodon liorhinus | Possibly had hair, secondary palate, Nasals pitted with foramina, inner ear bone |  | Synapsids to Mammals | Early Triassic (250 Ma) |
Cetacea | Basilosaurus cetoides | First fully aquatic mammal, nearly complete loss of hindlimbs |  | Land Mammals to Whales | Late Eocene |
Pattern 4: Paleobiogeography
One of the major factors in fossilization that is important to consider when contemplating the record is that not all organisms lived in every environment and everywhere around the world. As is true of most organisms today, even humans, geographic distribution of organisms is determined by the environments to which they have adapted. There have been fossils, such as the Glossopteris sp. ferns
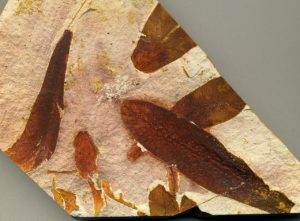
and Paradoxides sp. trilobites that have been found in myriad locations, apparently far apart from one another. These far flung fossil sites have helped reconstruct paleogeography (positions of continents) because of the abundance of specimens and similarity of environment.
Because of our understanding of modern ecology and evolutionary principles, we can go beyond just describing fossils and organizing them by appearance, we can also apply biogeographic understandings to place them within ecosystems and, sometimes, even describe communities within those ecosystems. At times, there are very interesting stories that emerge when examining the paleobiogeography of an organism or group, when epiboles or outages (sudden appearances and disappearances) occur, giving us insights into the stability and resilience of long-extinct organisms and environments.
For further exploration of paleobiogeographic material, the Paleobiobology Database Navigator is an amazing tool.
Pattern 5: Homology, Analogy, and Vestigiality
Humans are tetrapods, a trait we share with all four-legged organisms going back to the earliest amphibians and fish. Such homology, or similarity in structures, supports cladistic analysis. Organisms with similar developmental biology, or embryology, will tend to develop the same structures. However, through evolutionary change, or descent with modification, these same structures can be adapted for different uses.Structures within a lineage, such as the arm bone sequence within tetrapods (one upper arm bone, two lower arm bones, many hand bones), are considered to be homologous structures. These shared characteristics, derived from a much earlier ancestor, are key identifiers within a lineage. For our own species, the arm bone sequence is a classic case that connects us to the earliest tetrapod, Tiktaalik rosaceae, the earliest freshwater organism to carry this trait onto land that we know of from the fossil record. Homology provides critical insights into how heredity works. Thus, as Pierre Belon noticed in 1555, humans and birds have similar structures in their arms. Birds being adapted to flight, their wings are otherwise useless for the manipulation of tools, climbing trees, or some of the other uses for which a primate descendent might use them. Homology implies divergent evolution, or the splitting off of lineages through the processes of speciation, because advantageous traits develop in different ways for different organisms.

Not all similar structures are homologous. Some structures are analogous. Wings are an excellent example, for while birds have wings as mentioned above, so do butterflies. The reason bird and butterfly weeks are analogous is that these structures evolved independently of one another. These analogous structures are examples of convergent evolution, or the independent evolution of similar structures among different taxa that, can also share a similar adaptational purpose, such as wings assisting with flight in the case or birds and butterflies. There are many other examples of convergent evolution and analogy. Consider the similar torpedo-shaped swimming forms of tuna, icthyosaurs, dolphins, and penguins. Some of the best examples occur among plants, such as the over 60 independent instances of C4 photosynthesis, one of several photosynthetic pathways for producing sugars, that evolved among 19 different families of plants over time (Osborne and Sack, 2012), wind-blown seed dispersal, and carnivory.
Vestigial Structures
Finally, it is worth considering vestigial structures. These are anatomical features, cladistically shared with ancestral taxa, that serve little to no function purpose or can even be maladaptive. Such structures can be hard to identify but are not uncommon. They are the result of a lack of positive selective pressure, meaning that the structure no longer provides a function that leads to an evolutionary advantage. These structures, sometimes also referred to as vestigial organs, can be found in an atrophied, or reduced form, in many instances. A classic example is the loss of sight in blind cave fish. Living a life in total darkness, these fish no longer have need to expend energy maintaining a sensory organ evolved for light detection. While they retain eyes, they are no longer functional. Other examples of organisms retaining structures that are mere vestiges of their past usefulness are wings in some island-dwelling birds, such as penguins or Galapagos cormorants, or hindlimbs that are retained in whales and snakes.

Care must be taken in labeling structures definitively as vestigial for the reason of exaptation (Gould, 1982), a kind of re-adaptation of an evolved structure for a different purpose. Feathers are an example of a feature that could have become vestigial but instead was the subject of exaptation. Having originally been evolved to aid in thermal management, feathers eventually became just as important for purposes of display.
Chimpanzee right forelimb
Snowy egret right forelimb
Pattern 6: Origination as an Evolutionary Mechanism
Origination is speciation. It is the process by which new species evolve from ancestral forms. As this evolution occurs, phylogenies grow. Though often visually depicting a sense of gradual change, phylogenies are anything but gradual in the way they develop. They branch out as they develop over time, but off-shooting branches tend to occur pretty suddenly in the fossil record. Speciation, which ultimately creates new groups, does not occur at a constant rate over time. Rather, it is most typically quite choppy. Much like a real tree, the tree of life has branches leading out from a trunk and smaller branches popping out quite suddenly. To analyze evolutionary relationships among groups, Huxley (1959) introduced the concept of a clade, or group of related organisms, including a common ancestor and all its related descendants. Cladistic analysis provides insights into relationships between organisms through character analysis–studying the observable features of organisms in order to establish whether they are shared or derived from an ancestral taxon. Shared characters are traits that evolved early in a clade and are visible among the entire group. All primates, humans included, have opposing thumbs, for example. These are also called synapomorphies. Derived characters are traits that distinguish a taxon within its clade. They are also called apomorphies. While shared traits define an entire clade, derived traits represent evolutionary innovation that leads to the formation of new clades through speciation. Distinguishing these traits among a population of organisms or fossils is often done using a character matrix, where traits of taxa are listed one one axis and the tax themselves on the other.


Such character analysis makes it possible to create cladograms (Figure XX) by organising taxa first by shared characters and then through the identification of derived characters over time.The cladograms used to represent evolutionary relationships very intentionally imply a sense that most of the time, life is enjoying a kind of stasis but that, every once in a while, is punctuated by a major event, called species origination, that creates a new branch off of the tree. This more modern view of speciation, or cladogenesis, as the generation of a new clade through speciation is called punctuated equilibrium (Gould and Niles Eldredge, 1972). This set of ideas relies on the idea that environments retain a sense of stability unless changed, such as through major environmental upheavals. Punctuated equilibrium predicts that groups of organisms will otherwise remain in periods of stasis with little evolutionary change through most of their existence. Cladogenesis is, then, a rather geologically sudden process.
Within a cladogram, groups of organisms are ordered according to time across the horizontal axis, and evolutionary change along the vertical axis. There are three ways organisms can be grouped in a cladogram, based upon how they are related to one another. A monophyletic group is a clade, or a group of organisms that all share common traits derived from a common ancestor and all of its descendants. Such groups include not only the ancestral organism from which all shared characters are derived, every organism included across time and evolutionary change beyond that. Paraphyletic groups are not defined as clades. In contrast with monophyletic groups, these groupings of organisms retain common characteristics among related organisms, but not all of the descendent groups of organisms. The lemurs, lorises, and tarsiers below are examples, but so are reptiles, with regard to other amniota. While they contain a great many of amniotic organisms within their paraphyletic group, they do not contain the mammals or birds, which are also amniotes. The final situation is that which results from convergent evolution, or homoplasy. Polyphyletic groups are situations where organisms may have evolved similar characteristics but these characters are not derived from a common ancestor. In the case of lorises and tarsiers, both groups are nocturnal, a behavioral trait that is not shared with or derived from any other primates and must have evolved independently of one another. Another example would be mammals and birds, who are both haemothermic, or warm-blooded, a characteristic not derived from a common ancestor but also evolved through homoplasy.
Cladogenesis and Anagenesis
Cladistics is the exploration of speciation, defined as the splitting off of a clade (Figure XX). Speciation in this context is called cladogenesis. During cladogenesis, a parent species branches off, forming one or more new species. All of these organisms may also still live among one another, though they can no longer interbreed. Such episodes represent the visible norm of evolutionary trajectories and are consistent with punctuated equilibrium, as such events are preceded and followed by periods of stasis.
Another form of speciation occurs within a clade and is called anagenesis. Anagenetic change occurs more gradually, eventually leading to a new species, as heritable changes accumulate within a population through small episodes of natural selection. At this point, the originating species no longer exists, giving way to the new, derived species. One example of potential anagesis still discussed occurs within our own genetic lineage, Homo, where one earlier species may have evolved directly into subsequent species (Clee and Gonder, 2012).

Phylogeny of Homo sapiens across time and place through anagenesis.
This may have been the case as Homo heidelbergenesis anagentically evolved into Homo neanderthalensis and then into modern humans, Homo sapiens. One possible support for this thinking is that, in the case of the last two species, we have ample evidence that there was at one time interbreeding populations but that this ended with the extinction of Neaderthals.

Just a few “Highlights” in the Story of Origination
Abiogenesis
Abiogenesis is the development of life from non-living matter. At one point in Earth’s past, there was no life. Because of the development of a series of processes that eventually led to the eventual emergence of cell membranes, life began. How this occurred is still a subject of some uncertainty. The mechanisms of abiogenesis are poorly understood. In 1952, the Miller-Urey Experiment attempted to address the question of abiogenesis. Through this classic experiment, combining inorganic compounds with a source of energy, the experiment demonstrated that it was possible to synthesize proteins important for organic life. This result would only be the beginning of a chain of processes that would need to include the ability to self-replicate, self-assemble, leads to a rudimentary cell membrane, all through a series of self-perpetuating reactions. However this occurred on Earth, the earliest known such life dates back at least 3.5ba. These early life forms provide the foundation of all subsequent life and are our most distant ancestors.
An excellent example of prokaryotic life billions of years ago come in the form of stromatolites. Still around today, these algal mounds are most commonly made up of single-celled cyanobacteria. Cyanobacteria are photosynthetic. Photosynthesis is a later evolutionary pathway that will be discussed below, but the need to produce food using sunlight means that cyanobacteria would need to be living within ready access to sunlight. Stromatolites are still around today.
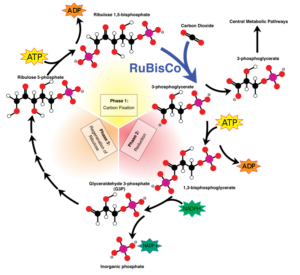
Evolution of Photosynthesis
Photosynthesis is one of the most important energy production pathways that primary producers use in the biosphere. The ability to change sunlight and water into glucose allowed for major evolutionary advances. Before photosynthesis, a form of chemosynthesis was most prevalent. At mid-ocean ridge hydrothermal vents, at a depth where sunlight does not penetrate, organisms still use this pathway today. Tube worms use symbiotic bacteria to help them fix carbon, using hydrogen sulfide (energy source), to produce the sugars and amino acids they need.
Organisms that use photosynthesis for energy production have evolved to do so in a variety of ways. Ultimately, the basic chemistry is the same. Cells take in carbon dioxide, water, and light energy to produce carbohydrates, such as glucose, which they can store to be used right away or at a later time. Photosynthesis may have evolved as early as 3.4 Ga.
Endosymbiosis
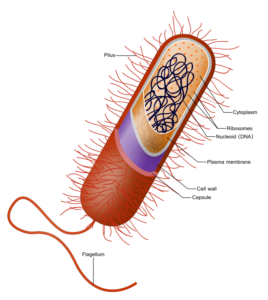
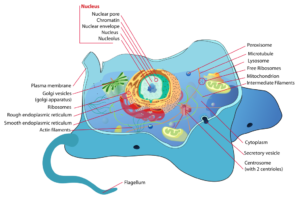
For most of life’s history, it existed in single-celled prokaryotic forms. Of the three domains of life today, two of them are made up of these kinds of organisms, the archaebacteria and eubacteria. Prokaryotic cells contain no organelles, but simply DNA, ribosomes, and the containment structure consisting of a cell wall, plasma membrane, and capsule. Scientists think that the process of endosymbiosis between some of these prokaryotes led to the first eukaryotic cells. Endosymbionts are organisms that live within the body or cells of another, sometimes mutualistically, sometimes parasitically. Within eukaryotic cells, several of the organelles are thought to have a direct bacterial origin. These include the mitochondria, plastids, and chloroplasts. Endosymbiotic bacterial forms may have evolved to live directly within other bacteria, took on specific roles as a part of that tiny community, eventually leading to fully eukaryotic cells. This evolution took place nearly 2 billion years after life began, around 1.6-2.1 Ga. Since then, eukaryotic cells have evolved into many forms, most notably from two main structures, plant cells and animal cells.

Vendian Radiation
About 560ma, some of the earliest soft-bodied organisms that would come down to use as body fossils existed. Variously referred to as “Vendian”, after the Period in which they evolved, or “Ediacaran”, for the hills in Australia where they were first discovered, their forms are enigmatic and like nothing we see today. They have been described in many ways, but some only appear to be blobs of matter, leaving great challenges to interpretation. Some of them look like worms, others like sponges, others trace fossils. It is very likely that they are ancestral to arthropods. In any case, they are important because they are the first animals in the fossil record!
Origination is Critical for Evolution
More of the story of “Wonderful Life” will be explored in another chapter of this book. These few examples from the Precambrian time highlight the importance of origination. While we know a great deal about how some organisms originated because of the fossil remains that have come to us in the rocks, we also have many gaps yet to fill. Nevertheless, the fossil record has helped inform our understanding of how species originate today.
Pattern 7: Extinction as an Evolutionary Mechanism
Extinction is the opposite of origination. It is the permanent termination of an organism or a group of organisms. At this moment in time, 99% of all species that have ever existed have been subject to extinction. In actual numbers, about 5 billion species are thought to have succumbed to such a demise. The lifespan of some species is certainly longer than others, and geographic distributions also vary. Because of these two factors, it can be very challenging to determine the actual moment of extinction. Nevertheless, extinction is very common and perfectly normal. At any given moment in the geologic past, species are going extinct. It is the rate of extinction that varies. Background extinction rates are much different from the rate of extinction during mass extinction events.
Background Extinction
Normal background extinction rates vary because species life spans vary. Estimates for the life spans of various taxa range from a high of 11 million years to as short as 0.5 million years for all fossil groups (Lawton and May, 1995). This means that some species, not individual organisms of course, could be around for as long as 11 million years. Our own species, Homo sapiens, has been around for about the last 300,000 years (0.3 million years). Comparing this span of time to the low end average estimate, it could be said that we have a long way to go before our species becomes extinct. But, such a numerical comparison does not necessitate such a reality!
In terms of background extinction rates, estimates hover between 0.1 genera per million genera year for fossil taxon and 1 extinction per million species per year for living taxa. This translates to about 10-100 species per year going extinct, globally. The fossil record estimates are coarse, due to preservation bias (favorite marine organisms with mineralized skeletons) and inherent destruction in the record over time (the near-present is better represented than the ancient past). Modern estimates are difficult also due to the fact that so many species are not yet known and because the challenge of taking species census data is quite large. The modern numbers, when parsed more simply, suggest that for birds we would expect one extinction every 400 years or one mammal every 200 years. These estimates take into account the lifespan of species. Mammals, as a group, are thought to have an average species lifespan of about 1 million years.
Mass Extinctions and their causes
When extinction rates increase sharply above background rates for a geologically short period of time, the event is referred to as a mass extinction. Mass extinctions are rare, but when they happen they make huge adjustments to the patterns of life on the planet. Traditionally, there five really large mass extinctions that are set aside as special. In order, they mark the end of the Ordovician Period, the end of the Devonian Period, the end of the Permian Period, the end of the Triassic Period, and the end of the Cretaceous Period. Very recently, a sixth ancient mass extinction is being discussed that would directly precede the End-Permian event. Called the end-Guadalupian extinction, it would have occurred just 8 million years prior to the traditional end-Permian event. Ultimately, Raup and Sepkoski (1982) first identified the “Big Five”.
Mass Extinctions of The Past and Possible Causes
| Age (Ma) | Percentage of Genera Lost | Hypothesized Trigger or Cause | Affected Groups |
|---|---|---|---|
| Ordovician/Silurian - 439 Ma | 86% | The shift in continents closer to poles caused glaciation, low sea levels; too many plants removed too much CO2 from the air which reduced temperature causing an ice age; falling sea levels due to huge ices sheets in the southern hemisphere; climate changes; ocean chemistries changed; the Appalachian Mountains forming | Marine species (most organisms were marine at this time) such as some bryozoans, reef-building brachiopods, trilobites, graptolites, and conodonts |
| Devonian - 364 Ma | 75% | Flourishing of land plants released nutrients in the oceans causing algal blooms that depleted oceans of O2. Bacteria flourished, Volcanic ash cooled the Earth’s temperatures. Sea levels changes; asteroid impact; climate change; | Life is shallow seas such as corals, other shallow marine organisms including brachiopods, and single-celled foraminiferans; Terrestrial species such as spiders, scorpion-type creatures; Elipistostegalians; helped with vertebrate evolution. |
| Permian - 251 Ma | 96% | “The Great Dying” Volcanic activity in Siberian Traps released lava flows the size of the United States and over 1,000 feet thick. Emitted large amounts of CH4. Global warming and atmospheric changes; oceans warmed and became acidic. Pangaea also taking shape, changing ocean currents; meteorite may have hit too. Climate change | 96% of all marine species 70% of all land vertebrates The only mass extinction event that significantly impacted insects; Earth’s largest extinction event, decimating most marine species such as all trilobites, plus insects and terrestrial animals; life descended from the 4% of surviving species; |
| Triassic - 200 Ma | 48% | Volcanism leading to flooding basalts and a tremendous amount of sulfur dioxide and carbon dioxide in the atmosphere, causing climate change; an asteroid impact | Many types of animals died, including marine reptiles, large amphibians, reef-building creatures, cephalopod mollusks; plants were not affected. This extinction allowed for the evolution of the reptiles |
| Cretaceous - 65 Ma | 76% | Most famous event; a.k.a. “K-T Extinction”; Astroid imact hypothesis - asteroid impact in Yucatan Peninsula; Deccan Trap flood basalts were also erupting in India, but while they may have been a contributor, were likely not the ultimate cause | Extinction of many species in both marine and terrestrial habitats; ammonites, many flowering plants including pterosaurs, mosasaurs, many other dinosaurs, and other marine reptiles, many insects, and all non-Avian dinosaurs. This extinction allowed for the evolution of mammals. |
When extinction rates increase sharply above background rates for a geologically short period of time, the event is referred to as a mass extinction. Mass extinctions are rare, but when they happen they make huge adjustments to the patterns of life on the planet. Traditionally, there five really large mass extinctions that are set aside as special. In order, they mark the end of the Ordovician Period, the end of the Devonian Period, the end of the Permian Period, the end of the Triassic Period, and the end of the Cretaceous Period.
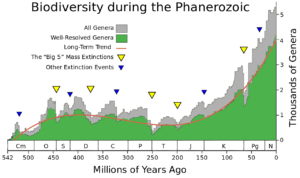
Our understanding of these events changes as time and research themselves evolve. Compared to one another, the “Big Five” certainly vary in intensity, with the end-Permian being the most intense of them, often being referred to as “The Great Dying” because of the loss of an estimated 95% of all life on Earth. Many scientists feel that today we could be in the midst of a sixth mass extinction, caused by human activity. There are challenges in comparing today’s biodiversity loss to what we see in the fossil record. Whether or not today’s extinctions make the cut and join the other five is still an open question. Eventually, as things in the science progress, so will our conclusions about these events.
Mass extinctions are caused by powerful natural events. Every mass extinction contains similarities in their story lines. There is usually a significant element of climate change, whether as the main driver or a secondary result of the primary cause. There is massive loss of life, though how this plays out on land and in the sea can vary by event.
Ordovician Extinction
The end-Ordovician event is described as being caused by global cooling. More extreme cooling events during the Proterozoic Eon, referred to as “Snowball Earth” events, certainly occurred. But, there is no record of mass extinction. Most life was single-celled and it did not fossilize well. The end-Devonian, accompanied by massive black shale deposits, is unusual in that it actually happened over millions of years. The evolution of vascular plants on land may have been a factor, as the increase biomass to waterways could have caused mass eutrophication across large sections of the shallow epeiric (inland) seas that existed.
Cretaceous/Paleogene Extinction
The 3D model below illustrates the famous K/T boundary extinction event in the rock record. This event, caused by the Chicxulub asteroid impact, caused the extinction of the dinosaurs. Located near Gubbio, Italy, this is the very outcrop where Walter Alvarez collected samples to analyze for microfossils across the boundary. He noted that below the boundary, they were abundant, diverse, and some were very large. Above the boundary, they were sparse and tiny. Enlisting his Nobel-prize winning physicist father, Luis Alvarez, they determined that the boundary clay (the inset area in the model that looks like a gap) was unusually rich in iridium. Many such similar boundary clays rich in iridium have since been identified globally.
Are we currently in the midst of a sixth (or seventh!) mass extinction? In order to see the rate of species loss we see in the record over the last century, between 2,000 and 10,000 years should have been necessary. Given a conservative estimate of the background, pre-human extinction rate of about 0.1 extinction per million species years, the current observable rate is about 1,000 to as much as 10,000 times higher, at a bout 100 extinctions per million species years or more. These rates are quite alarming. Causes of current biodiversity loss include a wide variety of factors. Climate change, overhunting, habitat destruction, and habitat fragmentation are some of the largest. These are all directly related to human activity. At this point, this would be be the only mass extinction in geologic history caused by a single species.
Extinction as Opportunity
Extinction leads to origination. While it is certainly a way organisms fade into the memory of the rock record, these events also create opportunity. With extinction comes new niches, into which species can move. These new niches provide new environments, food sources, and habitats. They also provide new opportunities for evolutionary change. Organisms that survive extinctions and that move into environments that are changed or even marginal for their current life mode may adapt well enough to pass on their genes to another generation who may be better adapted to the new environment. While extinctions on various scales are certainly tragic for those groups or organisms that experience them, they can also provide the foundation for success stories. As humans, we have inherited the successes of our evolutionary ancestors.
Chapter Contents
- 1 Changing Perspectives on Fossils: Evolution’s Silent Sentinels
- 1.1 Figured Stones
- 1.2 Figured Stones to Fossils: Evolutionary Foundations
- 1.3 Evolutionary Patterns in the Fossils
- 1.3.1 Pattern 1: Inherently Biased Data
- 1.3.2 Pattern 2: Fossil Succession
- 1.3.3 Pattern 3: Transitional Fossils
- 1.3.4 Pattern 4: Paleobiogeography
- 1.3.5 Pattern 5: Homology, Analogy, and Vestigiality
- 1.3.6 Pattern 6: Origination as an Evolutionary Mechanism
- 1.3.7 Pattern 7: Extinction as an Evolutionary Mechanism
- 2 Mass Extinctions of The Past and Possible Causes
- 3 The Fossil Record: Making Sense of Evolution’s Past
- 4 Further Reading