Diversity vs. abundance
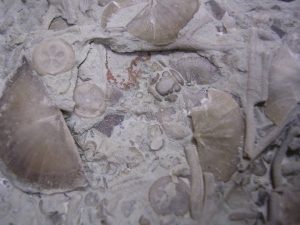
Photo by K. Layou
The fossil record is full of different characters that provide rich details about the story of Earth’s story–multiplying bacteria, scuttling trilobites, darting fish, stomping T. rex, flowering plants. Certain taxa follow one another through time and the vertical sequence of strata in a principle defined by William Smith as faunal succession. Major appearances and disappearances of vertebrate groups were used in part to create the first versions of the geologic time scale. But a deeper consideration of the fossil record can yield many fascinating questions about the history of life.
Counting taxa
First, there is the consideration of diversity–typically this is defined as the number of taxa present within some defined timeframe, geographic area, or stratigraphic layers. Let’s break that down a bit. Recall a taxon is one level of the Linnean taxonomic hierarchy–domain, kingdom, phylum, class, order, family, genus, or species. Paleobiologists can ask questions at a variety of levels–when did the major phyla originate? Why do some genera have more species than others? All of this is dependent on the traits that place an organism within the hierarchy. At higher taxonomic levels, key traits are relatively easy to identify. For example, all arthropods have a segmented body, or all echinoderms exhibit 5-fold (pentameral) symmetry. But as you dig down deeper into the lower taxonomic levels, defining criteria become less clear, particularly at the species level.

The species concept is a long-discussed, little-resolved aspect of biodiversity. There are numerous ways taxonomists, biologists, paleontologists, and evolutionary scientists have defined a species–we will only highlight a few of the most common here. The biological species concept, which most people are familiar with, is based on reproductively isolated populations of individuals–for example, fish in mountain lakes at high elevations. However, this definition is highly biased toward sexually reproducing eukaryotes. There are many eukaryotic organisms, and entire domains of prokaryotes that reproduce asexually. This definition is also problematic for the fossil record, as we cannot directly observe which fossil organisms were able to successfully lreproduce with each other. Paleobiologists, therefore, commonly apply the morphological species concept, using fossilizable characteristics of shape and form to define species. Some specimens in museums are often described as the “type” specimen of species because that fossil was used to formally describe the species. Can you think of any issues with this method of defining a species? There are definitely a few–consider the issue of sexual dimorphism (difference in males and females of a species, say in size, presence of antlers), or individual age (size of juveniles versus adults), or even ecophenotypic variation (variation in shell thickness in calm vs. rough currents). There is also the tendency of the taxonomist at work to be a “lumper” or a “splitter” in terms of recognizing nuances of specimens. Some organize specimens into fewer, more inclusive groups (lumpers), while others default to defining a greater number of more exclusive groups (splitters). The evolutionary species concept focuses on a clade, or single lineages of a population and its descendants that are distinct from others. Again, this is challenging to directly apply to the fossil record, and will still be dependent on fossil morphological analysis and rRNA molecular clock data.
Counting individuals
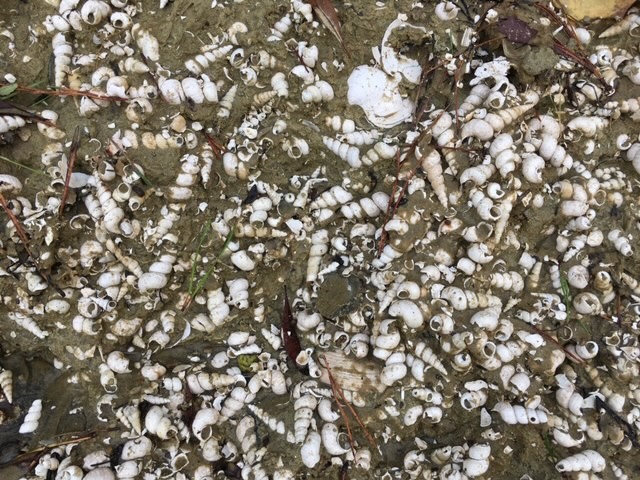
Photo by K. Layou
Another consideration of understanding life in the fossil record is fossil abundance. While thinking about diversity provides a list of all the species present in a sampling unit, paleobiologists may also want to consider how many individuals of each species exist as well. There are many ways to collect abundance data and the method used is typically dependent on the hypothesis being tested. In some cases, relative abundance counts are appropriate. This is often done using the terms rare, common, and abundant, but these terms should be given some guideline amounts. For example, rare might be 1-3 specimens; common 4-10 specimens; abundant, more than ten specimens. The number of specimens using this method will vary from study to study though. In many cases, quantitative analyses of ecological paleocommunities require absolute specimen counts. Once again, depending on the fossils, the study needs to define how counts are made. For whole individuals, like a snail, it is pretty easy to say one shell equals one individual. But for bivalved shells like clams, or complex vertebrate skeletons, it may be impossible to say if two shell or bone fragments are from one or more individuals. Additionally, many arthropods like trilobites molt their exoskeletons as they grow, so one individual could leave behind many exoskeletons! Therefore, attention to details like the number of right vs. left valves or individual skulls may be helpful.
Counting diversity in shells and bones
Sepkoski’s Phanerozoic diversity curve
Fossil diversity throughout the Archean and Proterozoic is challenging to track because of the lack of hard parts for most of the organisms alive during these times. Once paleontologists recognized the shift to skeletonized animals during the Cambrian at the beginning of the Phanerozoic, many big questions bubbled to the top of paleobiological research. Has diversity constantly been increasing through time? If periods of mass extinction (intervals when many genera or even families die off simultaneously) exist, are there similar periods of diversification, or origination, when many species or higher taxa appear at once? How long is the average species around on Earth? To tackle some of these questions, Jack Sepkoski, a paleontologist at the University of Chicago, developed what is now one of the most famous graphs in the world of paleobiology, his Phanerozoic diversity curve.
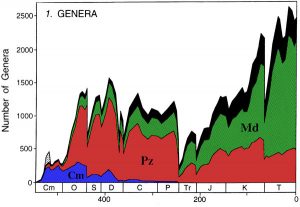
This graph shows the number of marine genera through the Phanerozoic. It is important to note this graph does have a subtle taphonomic bias to it, as it focuses on marine animals after the development of a shelly exoskeleton. When looking at the curve, several major features can be identified: 1) the Cambrian Explosion, a time of significant diversity increase through the Cambrian; 2) the Paleozoic Diversification and Plateau, a time of extensive radiation of invertebrate groups followed by relatively stable diversity from the Ordovician through Permian; and 3) the Cenozoic Rise, a time of exponential diversity growth from the Triassic to today. The five major mass extinctions are also quite noticeable as rapid, sharp declines in diversity at the end of the Ordovician, Devonian, Permian, Triassic, and Cretaceous.
After Sepkoski’s work was published, a new question arose—is the diversity curve a true representation of biological diversification through time, or is the pattern influenced by taphonomy and the quality of fossil preservation? For example, some researchers suggested that the Cenozoic Rise is simply due to the “Pull of the Recent”, meaning that there are more well-preserved, Cenozoic-aged rocks and sediments on Earth simply because there hasn’t been enough time for them to go through the geologic wringer of the rock cycle yet. In the late 1990s, a large group of paleobiologists got together to begin developing the Paleobiology Database.
Checking the data: the Paleobiology Database
The Paleobiology Database (PBDB) is an online clearinghouse of occurrence data of fossils around the world for most of the Phanerozoic. Researchers scour published scientific literature for reports of fossil occurrences at described localities. The PBDB is an amazing resource because it includes taxonomic lists from a variety of spatial scales (sample within a bed, outcrop) but also typically pairs detailed sedimentary, stratigraphic, and taphonomic descriptions with the fossil occurrences. Want to know more about Jurassic bivalves in limestones within 200 miles of Paris? The PBDB has you covered. Since 1999, the PBDB has continued to grow as researchers have added data on marine microfossils, invertebrates, and vertebrates, terrestrial reptiles, birds, mammals, and plants, and more.
After a few years of PBDB data accumulation and analyses, a consensus group of paleontologists examined the data to see if Sepkoski’s Phanerozoic diversity patterns were replicable. Even after correcting for variations in sample preservation, and chunking the geologic time scale into standardized 10 million year sections, these researchers were able to show the increase in taxonomic diversity during the Cenozoic is indeed a true biological signal in the fossil record.
Marine cohorts: the evolutionary faunas
When Sepkoski was gathering his data, he recognized another fascinating set of patterns in his Phanerozoic diversity curve. Doing some basic analyses, he was able to identify groups of marine taxa with hard skeletal material that tend to originate at the same time, co-exist for a few geologic periods, and then go extinct at relatively the same time. He called these groups evolutionary faunas. The Phanerozoic diversity curve is divided into three of these evolutionary faunas: the Cambrian fauna, the Paleozoic fauna, and the Modern fauna. It is important to recognize that these groups of organisms are not mutually exclusive, and indeed, throughout much of the Phanerozoic, they coexist. The idea is that, typically, one of the groups is most dominant in ecosystems at particular points of time. Therefore, if you have a general sense of which fossil groups “hang out together” you will be able to make quick deductions about the age of the rocks containing the specimens.
The Cambrian fauna

The Cambrian fauna is responsible for the incredible increase in diversity seen in the fossil record, known as the Cambrian explosion. Some major taxa included in the Cambrian fauna are trilobites, inarticulate brachiopods, and early representatives of echinoderms. Trilobites are a superphylum (Trilobitomorpha) of arthropods that are a hallmark fossil of not only the Cambrian, but also much of the Paleozoic. Many of the taxa of the Cambrian fauna, particularly the trilobites, were hit hard by the end-Ordovician mass extinction, and trilobites are one of many taxa that go extinct during the end-Permian mass extinction.
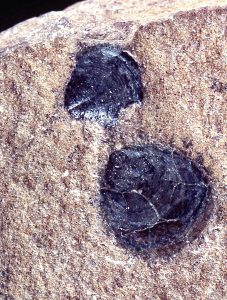
Photo courtesy of Encyclopedia of Alabama
Inarticulate brachiopods are rather distinctive and typically fossilize with flattened, dark-colored shell with distinctive curved lines on the shell surface. Some genera, like Lingula sp. possessed a long, fleshy stalk to burrow into shallow marine sediments. While still alive today, inarticulate brachiopods are much less common than they were in the early Paleozoic.
The Paleozoic fauna
_(44702899525).jpg)
Creative Commons Attribution 2.0 Generic license
The Paleozoic fauna includes many of the taxa that are responsible for creating and maintaining the Paleozoic plateau of diversity from the Ordovician to the end of the Permian. These groups developed during the Great Ordovician Biodiversification Event (GOBE) as noted from the steep incline on the graph at the onset of the Ordovician. The GOBE is a summation of many increases in diversity among planktonic, benthic, and reef communities during the Ordovician. The Paleozoic benthic seas were dominated by a wide array of relatively abundant invertebrates, including trilobites, articulate brachiopods, bryozoans, reef building tabulate and rugose corals, crinoids, and blastoids. Interestingly, after initial bursts of species diversity of benthic organisms, there are also increases in the use of ecospace through the Paleozoic. Many of the taxa that evolved during the GOBE were filter feeding organisms, and despite diversification and abundance of phytoplankton and other prokaryotes and unicellular eukaryotes at the base of the food web, there was an increase in competition for resources. Therefore, as the Paleozoic continues, there is an increase in the number of organisms burrowing deeper under or growing taller (e.g., stalked crinoids and blastoids) above the seafloor. These adaptations also aid in maintaining diversity as sediments eroding into epicontinental seas from tectonic activity increase turbidity. Fish also became dominant during this time, including sharks and other groups of armored fish. These armored fish were likely diversifying in part due to evolutionary selective pressures from other fish and large arthropods of the Paleozoic oceans, such as eurypterids.
The Modern fauna
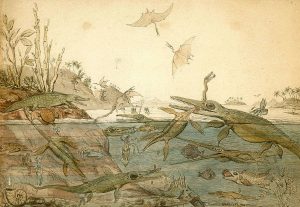
Public domain image.
The Modern fauna follows the ecological reset that occurs after the end-Permian mass extinction. Because so many taxa from the Cambrian and Paleozoic faunas were exterminated during the end-Permian event, many ecological niches were open and available for evolutionary innovations. A number of planktonic clades that are found in modern oceans evolved at this time, including silica-based diatoms and radiolarians, and calcite-based coccolithophores and foraminifera (note forams first evolved in the Cambrian). Modern (scleractinian) corals arose as the primary reef building organisms, along with echinoids (sea urchins and sand dollars) as the main benthic community echinoderms. Most importantly, however, was the rise of molluscs—bivalves, snails, and cephalopods diversified significantly and dominated benthic communities. Bivalves include a wide array of common shells you mind find on the beach or at the seafood market, such as clams, scallops, mussels, and oysters. Bivalves and snails also eventually worked their way into terrestrial ecosystems. Shelled (nautiloids, ammonoids, belemnoids) and unshelled (e.g., octopus, squid) swimming cephalopods competed for food with marine vertebrate groups of the Modern fauna in the pelagic realm for fish and other swimming invertebrates. These vertebrate groups included a wide diversity of fish, swimming reptiles (e.g., icthyosaurs, plesiosaurs, sea turtles), and swimming mammals (e.g., whales and their ancestors, dolphins, sea lions).
To learn more about important fossil groups through time, see the Digital Atlas of Ancient Life from Paleontological Research Institute.
Further reading:
Sepkoski Jr., J.J. 2002. A Compendium of Fossil Marine Animal Genera. Bulletins of American Paleontology (363), 16 Sep 2002: 1-560. [Online]
Servais, T., Harper, D.A.T., Munnecke, A., Owen, A.W. and Sheehan, P.M. 2009. Understanding the Great Ordovician Biodiversification Event (GOBE): Influences of paleogeography, paleoclimate, or paleoecology? GSA Today 19(4): 4-10. doi: 10.1130/GSATG37A.1